Black Marubozu Candlestick Pattern
The Black Marubozu Candlestick Pattern falls under the category of basic candles used in stock trading. It is one of the simplest candlestick patterns, with a long black or red candle that signifies the strength of sellers during a certain trading session.
Let’s explore more about the pattern here.
What is Black Marubozu Candlestick Trading Pattern
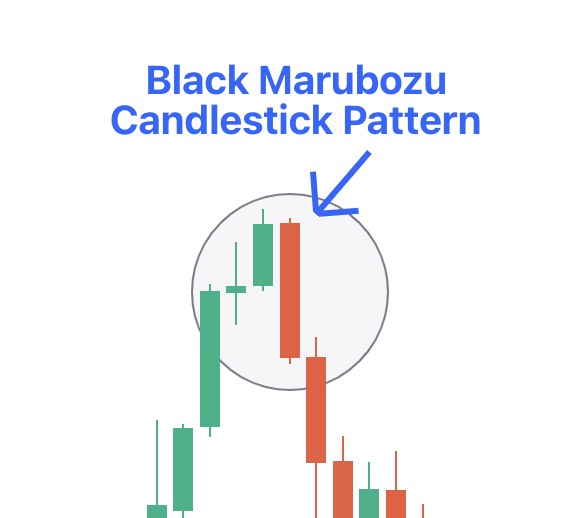
The Black Marubozu candle is long and either black or red. It signals the dominance of sellers in a trading session.
A longer candle indicates a higher decline in price. It opens at the day's high and closes at the day's low. When the pattern is seen at the conclusion of a downtrend, it indicates a probable continuation of the downward trend.
What Does Black Marubozu Pattern Indicate ?
-
The Black Marubozu pattern indicates a scenario where sellers dominate the market throughout the trading period. This results in a further downward push to the prices, which then close at the lowest point.
How to identify this trading pattern:
- Singular Bearish Presence: The Black Marubozu pattern forms with the presence of only one candle, which shows a bearish sentiment in the market.
- Body Size: A defining characteristic of this pattern is the size of the candle's body. This indicates a price movement in a downward direction.
- Absence of or Extremely Few Wicks: The wicks that come along with the Black Marubozu candle are either small or absent, reinforcing the dominance of sellers and the strength of the downward momentum.
Also Read : What is Marubozu Candle and Candlestick Pattern
Different Forms of the Black Marubozu Trading Pattern
Identifying the Black Marubozu candlestick pattern could change according to the charts you're observing. Here are the 3 variations:
- Full Black Marubozu: This version has no wicks present either at the top or the bottom of the candle, and it focuses on a strong and clear bearish sentiment.
- Open Black Marubozu: In this form, there are no wicks at the top, but a small wick may be seen at the lower end. This indicates some initial buying pressure before sellers took control.
- Close Black Marubozu: The Close Black Marubozu shows no wicks at the bottom, with a small wick present at the top. This suggests sellers maintained dominance throughout the session but faced minor resistance towards the end.
Advantages and Disadvantages
The advantages and disadvantages of this pattern are:
|
Advantages |
Disadvantages |
|
Indicates a Bearish Signal: The Black Marubozu pattern can serve as a strong indicator of bearish sentiment. It offers traders a clear signal to anticipate downward price movements. |
Potential for False Signals: Though it is effective in nature, the Black Marubozu pattern can sometimes produce false signals, leading traders to make incorrect predictions and resulting in losses. |
|
Easy to Identify: With its distinct single candle, such as a large body and minimal wicks, the Black Marubozu pattern is easy to identify on the price charts. |
Limited Contextual Analysis: Relying solely on the Black Marubozu pattern, you can overlook broader market factors and fundamental analysis, neglecting important contextual information for informed trading choices. |
|
Trend Continuation: Traders who can spot the Black Marubozu pattern can have increased confidence in the continuation of the prevailing downtrend, potentially leading to profitable trading opportunities. |
Inherent Uncertainty: While the pattern indicates a continuation of the current trend, it does not offer certainty with regard to the magnitude or time of the price movements, posing challenges for precise entry and exit timing. |
|
Confirms a Bearish Reversal: When the Black Marubozu pattern follows an uptrend, it often indicates a reversal to a bearish trend, providing traders with valuable insights for strategic decision-making. |
Need for Confirmation: To lessen the risk of false signals, traders often need additional confirmation from other technical indicators or market factors before acting only on the presence of the Black Marubozu pattern. |
How to Trade Using Black Marubozu Trading Pattern?
Here are some tips for trading with the Black Marubozu trading pattern:
- Determine the prevailing trend in the market to know whether it's an uptrend or downtrend.
- Look for the Black Marubozu candlestick in the context of the identified trend.
- Look for confirmation from other technical indicators or price action signals to confirm the presence of the Black Marubozu pattern.
- Enter a trade according to the confirmation of the Black Marubozu pattern. For a bearish signal, consider entering short positions.
- Set the right stop-loss orders to limit losses in case the trade moves against you.
- Determine a target price level to take profits. Consider support and resistance levels, or other technical analysis tools.
- Watch the trade for any signs of reversal or further confirmation of the trend continuation.
- Make adjustments to the trade as needed, such as trailing stop-loss orders or taking partial profits, according to market conditions and price movements.
- After the trade is over, review the outcome and analyse the effectiveness of the Black Marubozu pattern in guiding your trading decisions.
Understanding the Accuracy of the Black Marubozu Candlestick Pattern
This candlestick pattern is affected by market conditions, timeframes, and trading methodologies. When it is put together with other technical indicators and price action analysis, the Marubozu candlestick pattern is estimated to have a success rate of up to 70%. The Black Marubozu may not always offer precise predictions of price movements.