Ascending Triangle Pattern in Technical Analysis Explained

The ascending triangle pattern is a bullish chart pattern that typically forms when a continuation pattern is in an uptrend. Ascending triangles are known as continuation patterns because the price moves in the same direction as the trend that initially existed. This post looks at the details of this pattern.
What is the Ascending Triangle Pattern?
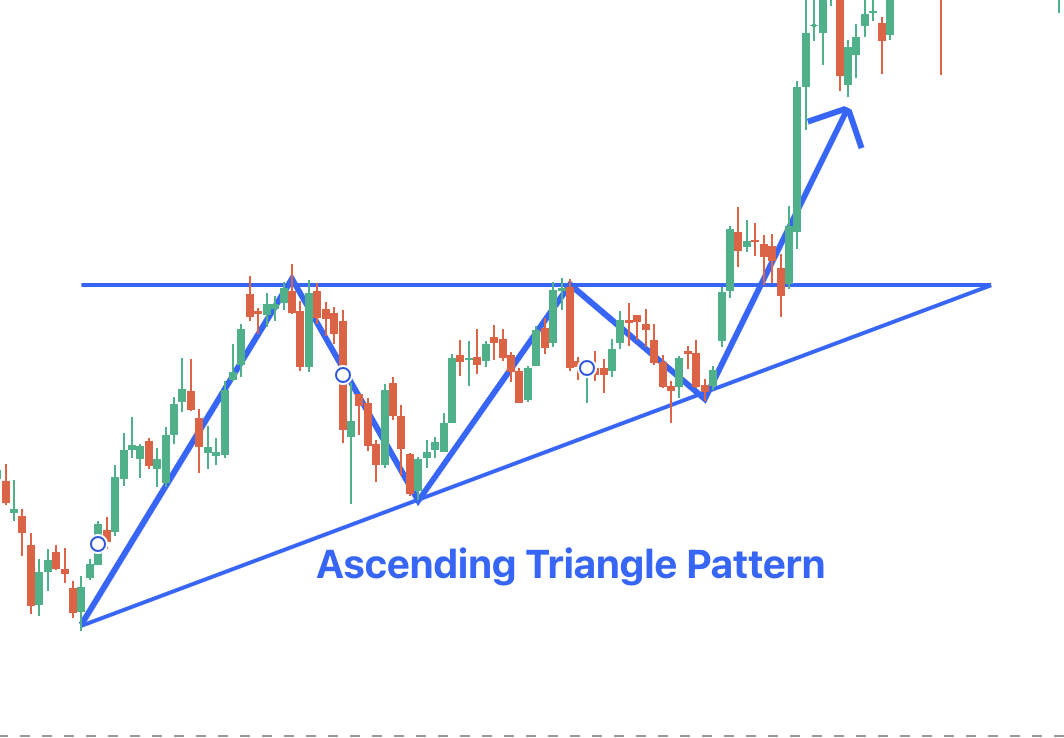
Let us start with the basics of the ascending triangle pattern. Here’s how an ascending triangle pattern looks like -
The market is in an uptrend, but at the same time, it is facing resistance. This leads to profit booking and a pullback. The bulls again try to go up, but are met with resistance. This resistance occurs multiple times and happens around the same horizontal level at the top, and every time there is a pullback.
However, the pullback is not as strong as the previous one, and the low reached is higher than the previous low. This formation can occur multiple times, resulting in a rising trendline (higher lows) at the bottom. This suggests that the buyers are becoming stronger with each pullback.
From the psychological perspective, the sellers are trying to defend at a fixed resistance zone. However, the buyers are not giving in and are, in fact, becoming stronger as time goes on. This proves that at every step, the buyers can reverse the downfall from a higher price. This leads to pressure building, and finally, the buyers can break out on the upside with huge volumes.
Features of Ascending Triangle Pattern
The main features of this pattern are:
1. Strong Trend
For an ascending triangle pattern to exist in the very first place, the price action needs to stem from a clear-cut uptrend.
2. Temporary Pause
The factor refers to the consolidated phase, which will help the buyers consolidate their strength.
3. Breakout
Piercing the upper flat line will mark the breakout and activate the pattern. It will also assist in determining the entry, stop loss and profit taking points at a later stage.
Bullish Breakout Strategies
The triangle pattern provides excellent and profitable bullish entry opportunities for traders. There are two main kinds of strategies.
The first is the direct breakout at the resistance level. This is a more aggressive entry. On the other hand, there can also be a pullback strategy, where the traders wait for the market to retest the resistance zone (which has now converted into a support zone) and take the entry afterwards.
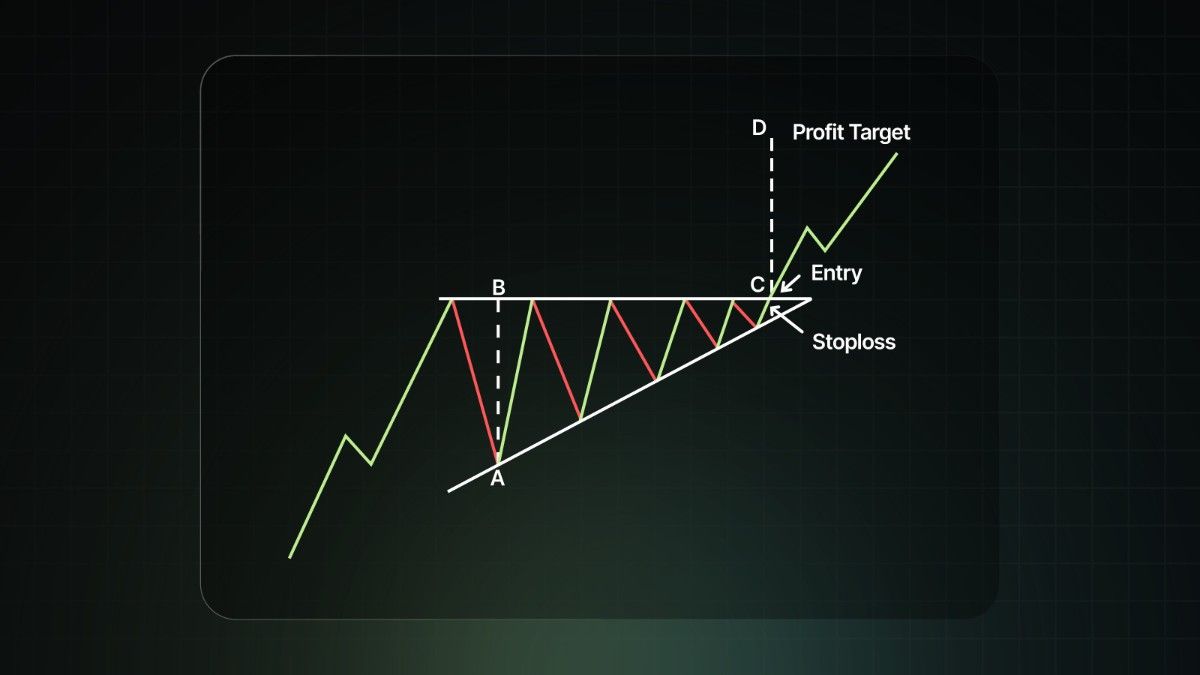
This is how the two entries look. The following infographic depicts an aggressive entry at the breakout directly -
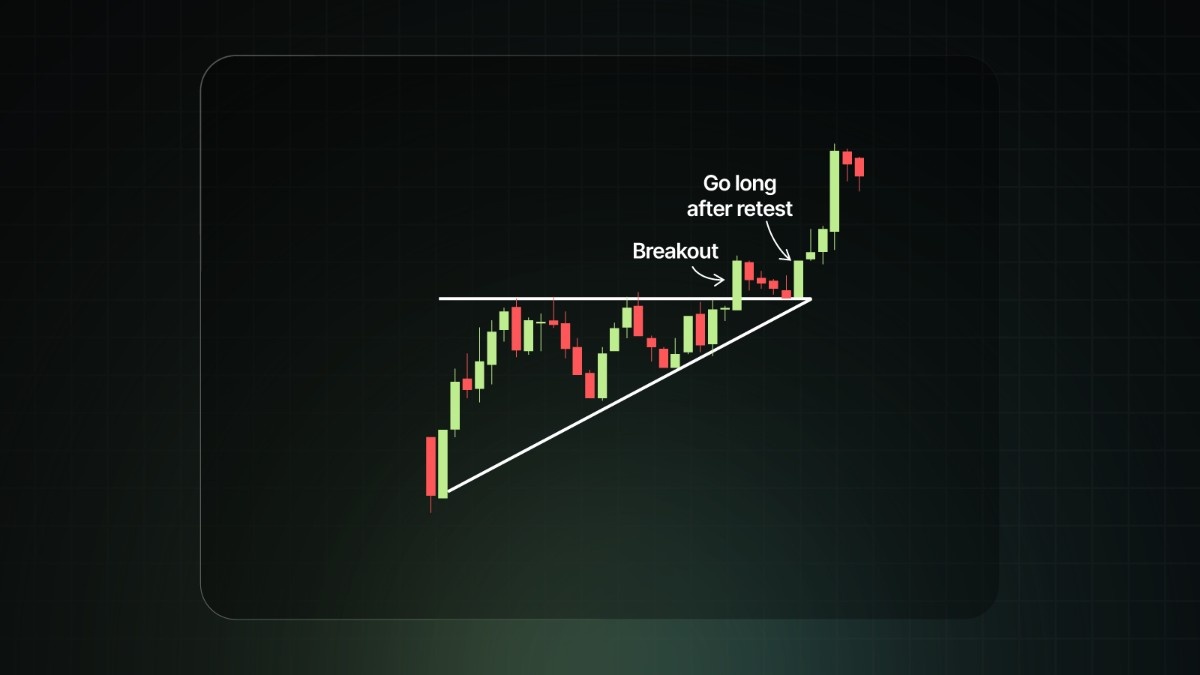
Conservative traders typically wait for the retest of the resistance line and then take entry: -
Stop Loss and Target Setting
Once the entry is made, a stop loss should be added. The stop loss will depend on the kind of entry taken. Suppose you make an aggressive entry, then the stop loss could be the last swing low.
On the other hand, in the case of a retest entry, the stop loss is typically small and just below the retest low candle.
Finally, the target can be based on the risk-to-reward ratio. Usually, a good risk-to-reward ratio of 1:3 is maintained while trading ascending triangle patterns.
Here is the summary of both entries:
|
Factor |
Breakout Entry |
Retest Entry |
|
Entry Point |
Enter right after the price closes above the resistance with volume |
Enter when price retests broken resistance as new support |
|
Stop-Loss |
Below breakout candle or last higher low |
Below retest the low or rising trendline |
|
Target |
Height of the triangle projected upward from the breakout |
Same height projection or next resistance level |
|
Pros |
Captures full move early |
Safer, reduces false breakout risk |
|
Cons |
Higher risk of false breakout |
May miss trade if no retest happens |
How Does the Pattern Help Traders?
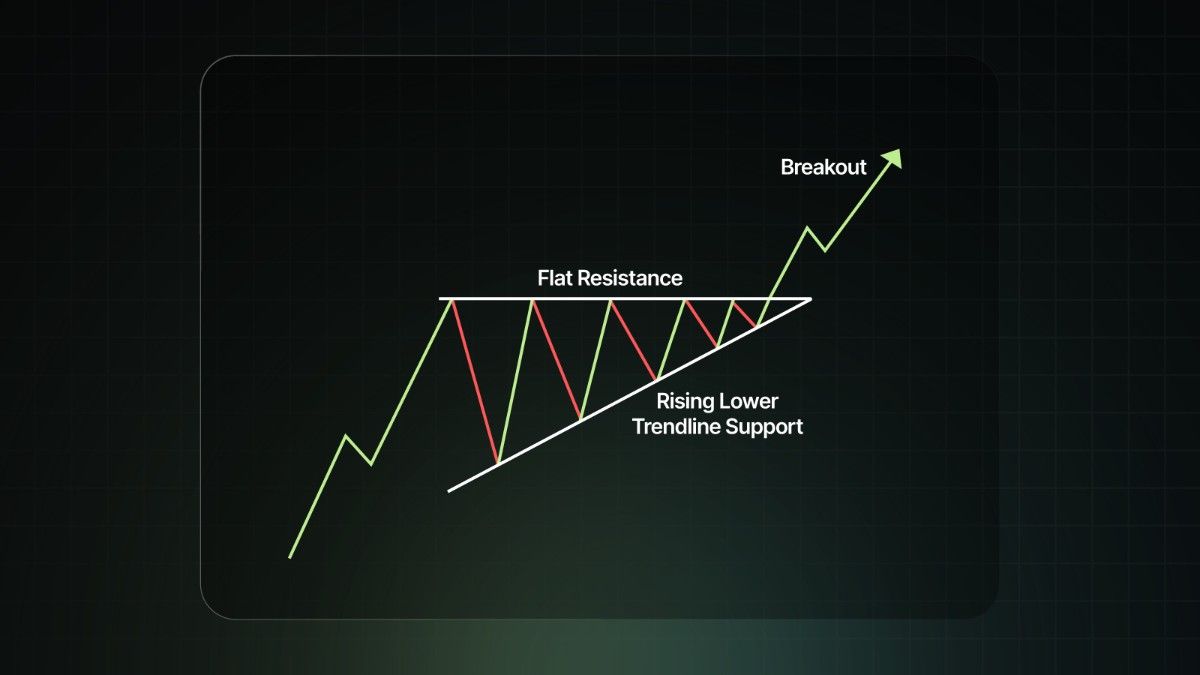
The purpose of the ascending triangle pattern is to assist traders in identifying potential bullish breakouts in the price of a stock. This pattern is formed when the price forms a series of higher lows, and the upper boundary of the pattern stays flat.
This indicates that there is a level of buying pressure building up, and if the stock is able to break through the upper boundary of the pattern, it could signal the trader to enter into a long position.
Traders would usually look for high trading volumes when the breakout occurs to confirm the validity of the pattern.
Real-world Examples
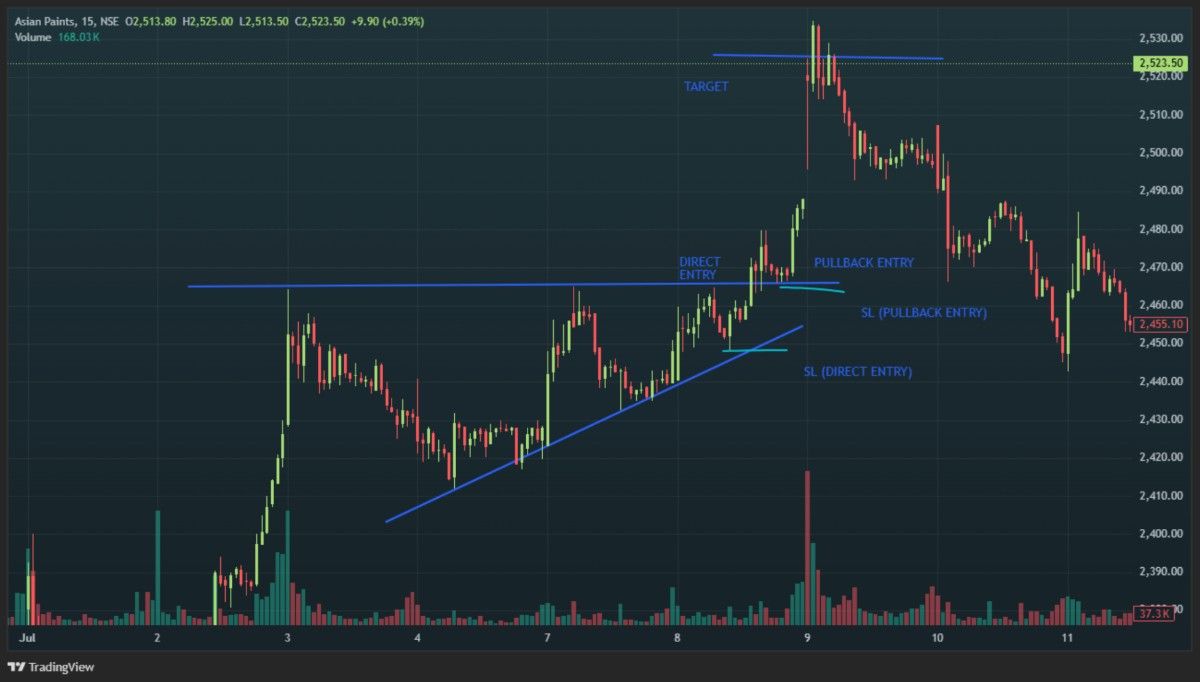
Let's take an example of Asian Paints on a 15-minute timeframe on 8 Jul 2025.
A clear ascending triangle formation occurs with 3 points touching at the resistance zone. Then there was a breakout green candle, which could have given a good entry to traders. For conservative traders, there was a slight retest of the same resistance zone, and an entry could have been initiated. The stop-loss of both types of entries is also shown in the figure. Asian Paints made a significant move the next day, and all targets were hit comfortably, with a risk-to-reward ratio of more than 1:3.
Difference Between Ascending Triangle, Symmetrical Triangle and Descending Triangle
Apart from the ascending triangle, there are symmetrical and descending triangle patterns as well. Here are the differences between them:
|
Aspect |
Ascending Triangle |
Descending Triangle |
Symmetrical Triangle |
|
Upper Line |
Flat (horizontal resistance) |
Downward sloping (lower highs) |
Downward sloping (lower highs) |
|
Lower Line |
Rising (higher lows) |
Flat (horizontal support) |
Rising (higher lows) |
|
Bias |
Bullish (buyers gaining strength) |
Bearish (sellers gaining strength) |
Neutral (breakout can go either way) |
|
Breakout Expectation |
Usually upward |
Usually downward |
Depends on trend direction |
|
Market Psychology |
Buyers press higher each time, sellers stuck at resistance |
Sellers push lower each time, buyers defend support |
Buyers and sellers compress, waiting for a breakout |
|
Reliability |
Strong in uptrends |
Strong in downtrends |
Reliable only with volume confirmation |
Advantages and Disadvantages of the Ascending Triangle Pattern Chart
The merits and demerits of this pattern are listed below:
|
Advantages |
Disadvantages |
|
It helps define the trading environment. |
The price action could move above the resistance line just to return below. |
|
It helps the uptrend to extend. |
The amount of power and strength cannot always be controlled, and it could cause the price to move in the opposite direction. |
|
If the pattern has been activated, traders would be in a better position to determine whether to take profit or exercise stop loss. |
Limitations and False Signals
Always remember that no pattern is foolproof and no pattern works all the time. Here are some limitations of an ascending triangle:
- False breakouts are common in low-volume markets.
- The pattern may fail if the broader trend is weak, especially if the market has been sideways for an extended period.
- When trading a retest entry, there is a chance that a retest may not occur, and the entry may be missed.
Conclusion
An ascending triangle is considered a very strong bullish continuation pattern. Its reliability increases with volume and trend confirmation. Other indicators might be used to make it even better. The best part about the pattern is that it offers high risk for a high reward. However, it should always be used with risk management and supporting indicators.