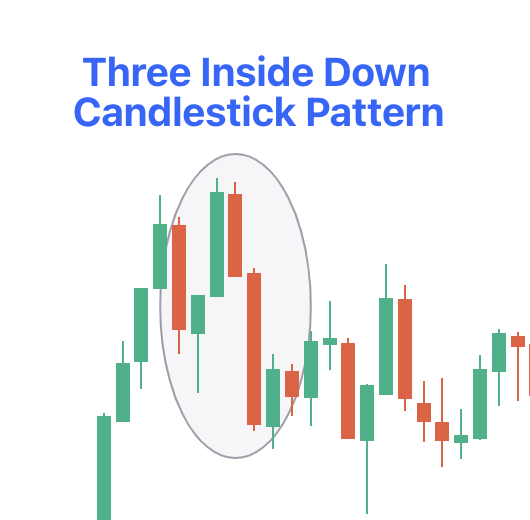
Three Inside Down Candlestick Pattern
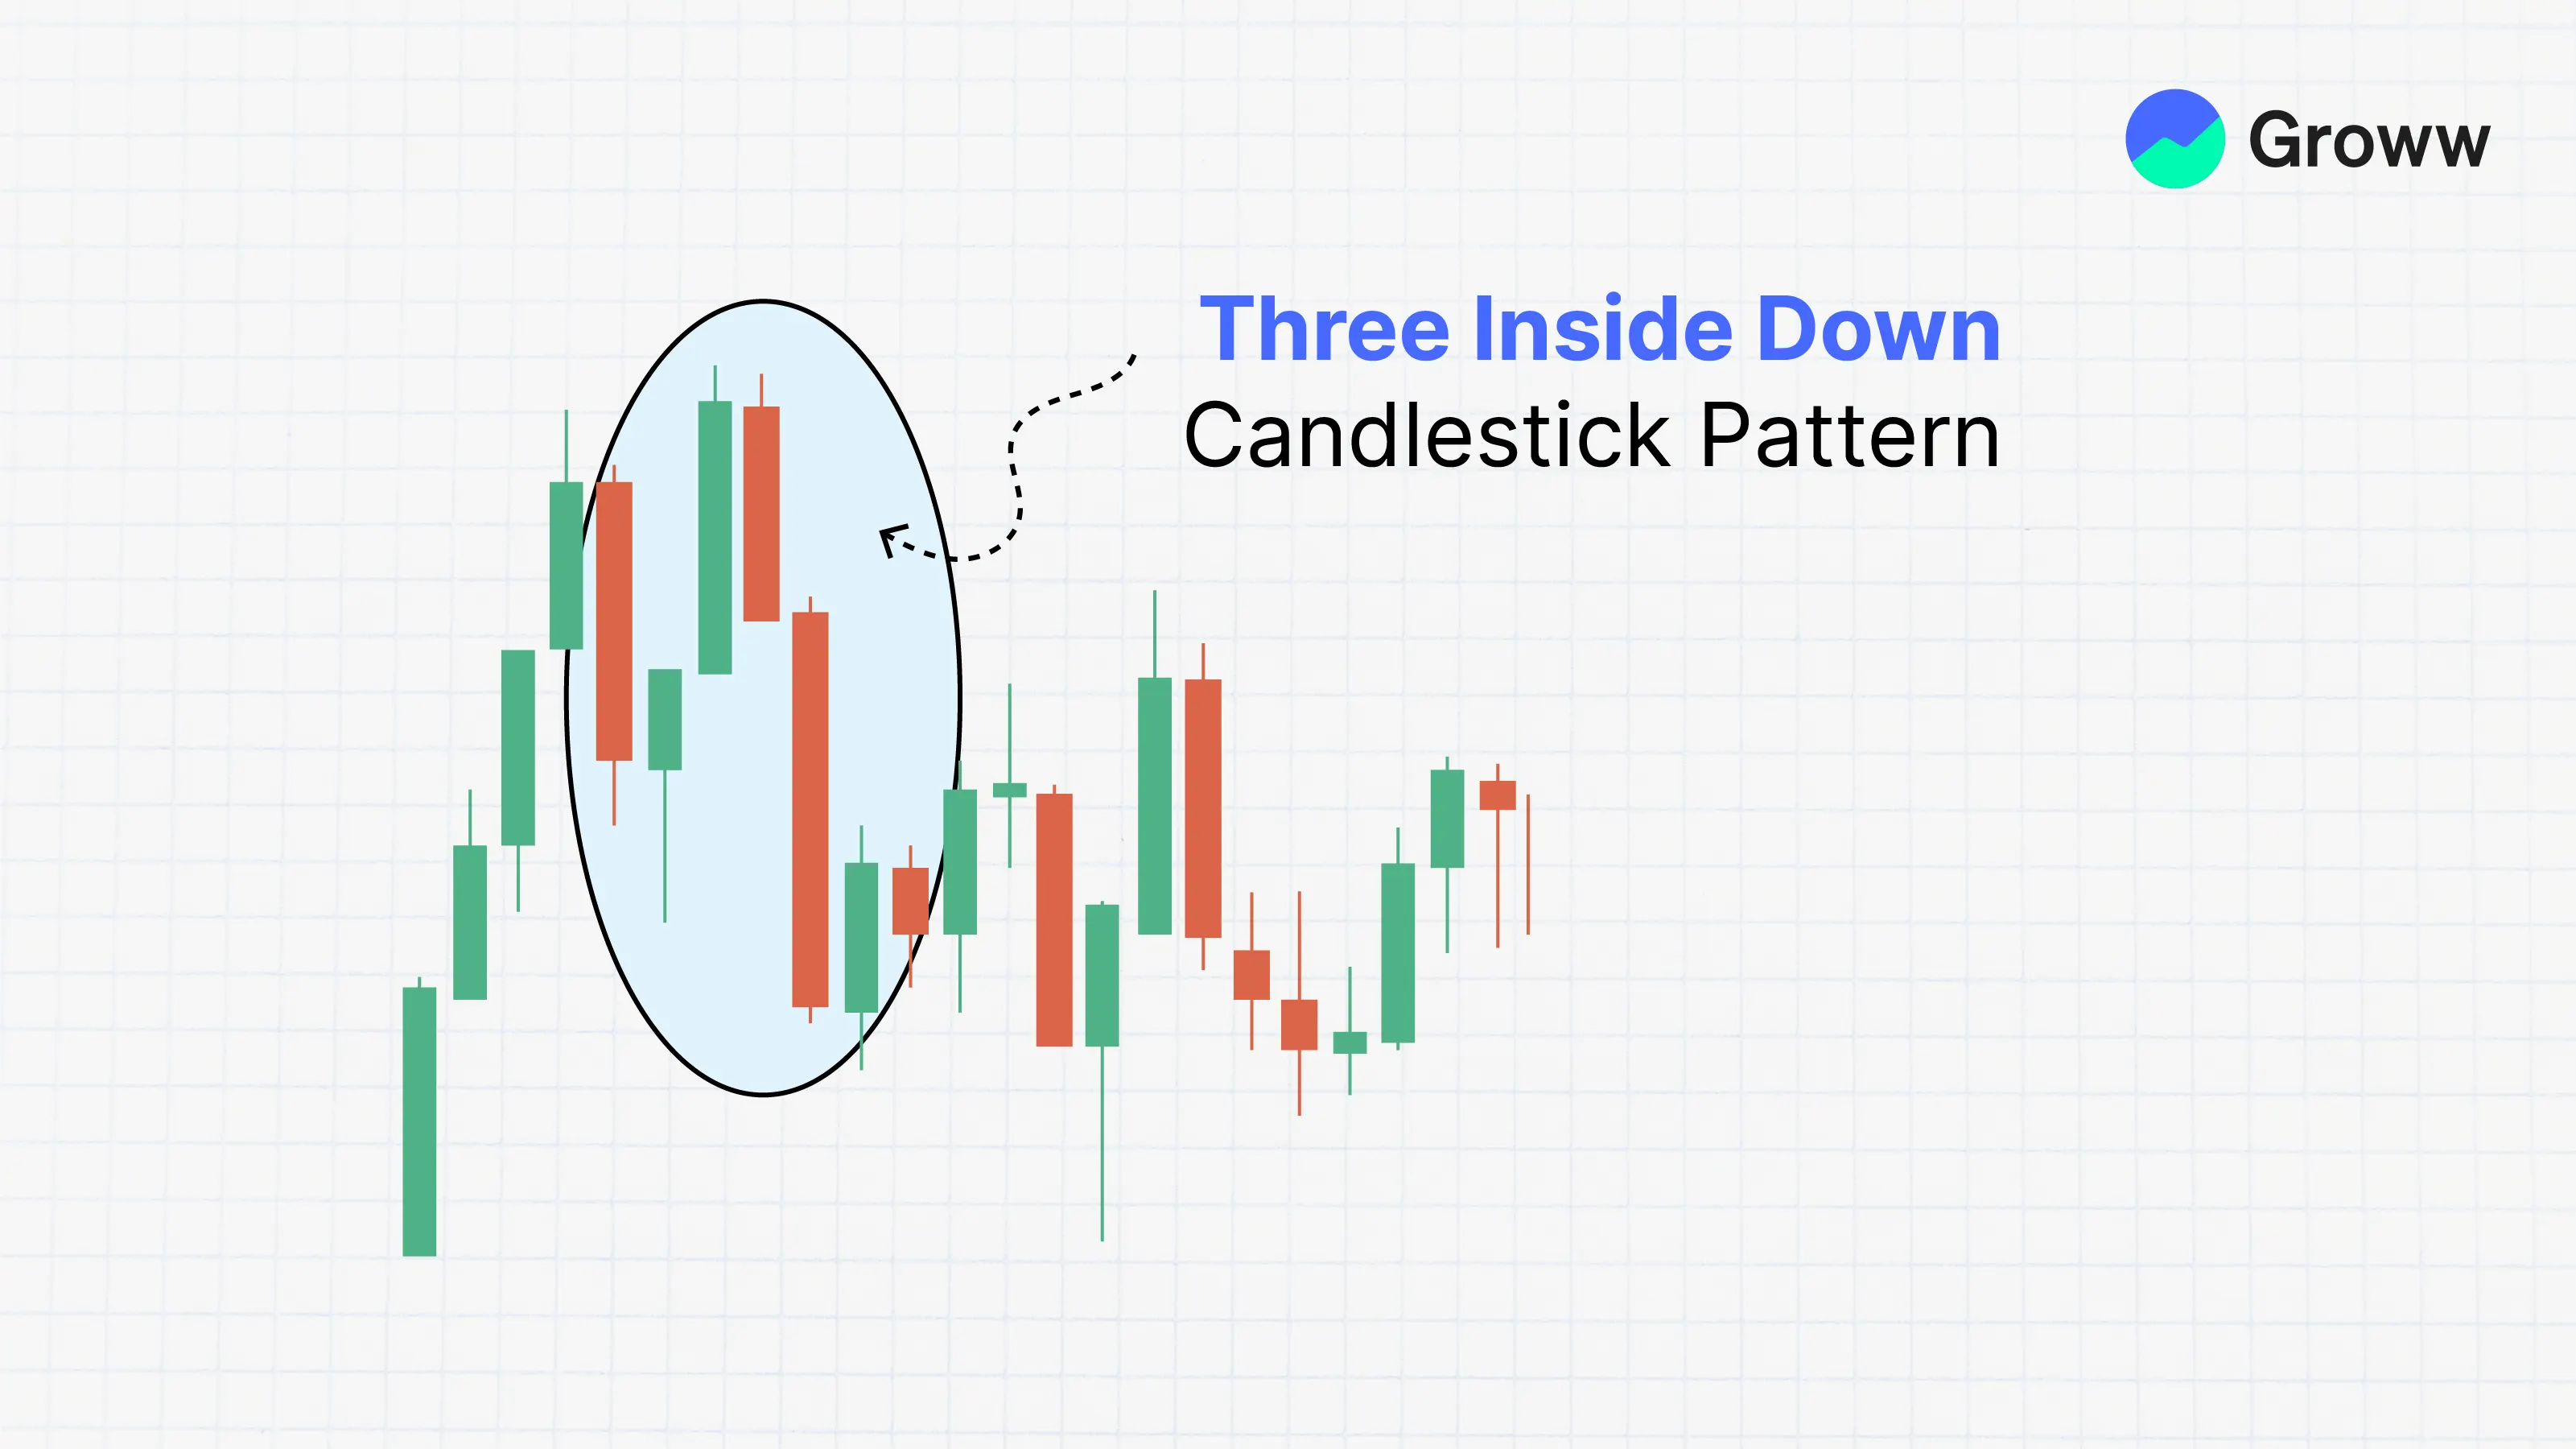
The three inside-down candlestick patterns signal a bearish trend reversal. It has three candlesticks, which include a long bullish candlestick and a smaller bearish candlestick, with the first and the third candlesticks being bearish.
In this post, we can understand the significance of this pattern and methods of trading it.
Check Here to know How to Read Candlestick Charts.
What is Three Inside Down Candlestick Meaning
The three-inside-down candlestick pattern on a price chart indicates that a negative trend is about to reverse. It belongs to the genre of 'triple candlestick patterns', which are price chart formations that include three candlesticks and indicate either a trend reversal or a trend continuation.
It happens towards the end of a bullish upswing, signalling to traders that the positive trend is coming to an end. The three-sided-down pattern implies that bears are gaining market control. When traders spot the three inside down patterns, they change their trading tactics and resort to shorting in order to capitalize on the imminent bearish trend reversal as much as possible.
Formation of the Three Inside Down Candlestick Pattern
The 3 inside down candle pattern would be formed at the end of a bullish trend when the bears or the seller begin to gain over the bulls or the buyers. The buyers or the bulls are in a dominant place at the start of the pattern.
- The first candlestick is bullish in nature, and the second of three will mark a change in market sentiments as it closes below the close of the previous candlestick.
- The second candlestick is either bullish or bearish, which is entirely contained in the body of the first candlestick. The close of the second candlestick is always below that of the first. The sellers would start to gain a winning edge over buyers from the second candlestick of the pattern.
- The third candlestick is a bearish confirmation, with its close below the close of the second one. It will confirm the upcoming bearish trend reversal.
The three inside down candlestick pattern will look like a bearish Harami that is followed by a confirmation candlestick.
What Does the Three Inside Down Candlestick Pattern Indicate
This candlestick pattern will be formed at the end of a bullish trend when the bears or the sellers begin to gain dominance over bulls and buyers. The buyers or the bull will be in dominance at the start of the three candlesticks, and the first candlestick will be bullish in nature.
The second candlestick of the three will mark changes in market sentiment since there is a close below the close of the previous candlestick.
The second candlestick is either bullish or bearish and is completely contained inside the body of the first candlestick. However, the second candlestick's close is invariably lower than the first. Beginning with the second candlestick in the pattern, sellers establish a winning advantage over buyers. The third candlestick is known as the bearish confirmation candlestick, closing below the second. The third candlestick signals a bearish trend reversal.
How to Trade the Three Inside Down Candlestick Pattern
In order to trade this candlestick pattern, it is not enough to find a series of candles with the same shape but the location of where they appear.
The same shape appearing in different locations would have varied meanings. In the case of this pattern, the price needs to be going up first, which marks a bullish move. The Three Inside Down Candlestick Pattern appearing after a bullish move is a sign of a possible reversal to the downside.
This pattern is traded when the low of the last candle has been broken. You also need to protect yourself since it does not always happen as estimated, and place a stop loss for this reason.
To increase accuracy, you need to trade this candlestick pattern along with other forms of technical analysis or indicators.
Advantages and Disadvantages of the Three Inside Down Candlestick Pattern
The merits and demerits of this pattern are listed in the table below:
|
Advantages |
Disadvantages |
|
This pattern can be spotted easily on the price chart, and traders could use it effectively. |
The tendency for the Three Inside Down Candlestick Pattern to signal reversal is minute or insignificant. |
|
It is an ideal indicator for short term and intraday trading, since it indicates minor trend changes that are useful for these attributes. |
It holds the tendency to produce false confirmations, and investors who use the pattern alone could incur losses. |
|
It has the ability to function well with other commonly utilized technical indicators, like the moving averages and more. |
Check More Bearish Chart Patterns
|
Bearish Pattern |
Features |
|
It forms when a small bullish candle is followed by a large bearish candle that completely engulfs the previous green candle |
|
|
It is formed when three consecutive long-red candles with small wicks are visible |
|
|
It appears at the top of the uptrend as a single candle with a small body and a long lower shadow |
|
|
It is a three-candlestick pattern that - Starts with a long bullish candle - Followed by a small-bodied candle that gaps up - And ends with a long bearish candle that closes well into the body of the first candle |
|
|
It is a reversal strategy which: - Is a single candlestick pattern with a small body, a long upper shadow, and little to no lower shadow |
|
|
It is a two-candlestick pattern that: - Starts with a long bullish candle followed by a Doji (a candle with a very small body) |
|
|
It is a two-candlestick pattern where: - A small bearish candle is completely engulfed within the body of the previous large bullish candle |
|
|
- It consists of two or more candles with matching highs and appears at the top of an uptrend. - The first candle is usually bullish - And the second candle is bearish |
|
|
- It starts with a long bullish candle - Followed by a long bearish candle that opens below the previous candle’s opening price and closes lower |
|
|
It is a three-candlestick pattern that - Starts with a bullish candle - Followed by a bearish candle that engulfs the first candle - And ends with another bearish candle that closes lower |
|
|
it is a five-candlestick pattern that: - Starts with a long bearish candle - Followed by three smaller bullish candles that stay within the range of the first candle - And ends with another long bearish candle that closes below the first candle |
|
|
It forms a long green candle followed by a red candle that opens above the previous high but closes below the midpoint of the green candle. |
|
|
It is a three-candlestick pattern that - Starts with a long bullish candle - Followed by a Doji that gaps up from the previous candle - And ends with a long bearish candle that gaps down from the Doji. |