Three Black Crows Pattern
The three black crows pattern is a famous bearish candlestick technical analysis indicator that signals the potential reversal of an uptrend in the stock market. This article explores the qualities of this pattern, interpretations, and trading strategies.
Check Here to know How to Read Candlestick Charts.
What does the Three Black Crows Candlestick Pattern mean?
The phrase three black crows is used to describe a bearish candlestick pattern that predicts the reversal of an uptrend. This chart shows the day's opening, high, low, and closing prices for the asset. In the case of stocks moving higher, the candlestick is white or green in colour. When moving lower, it would usually be in the colours black or red.
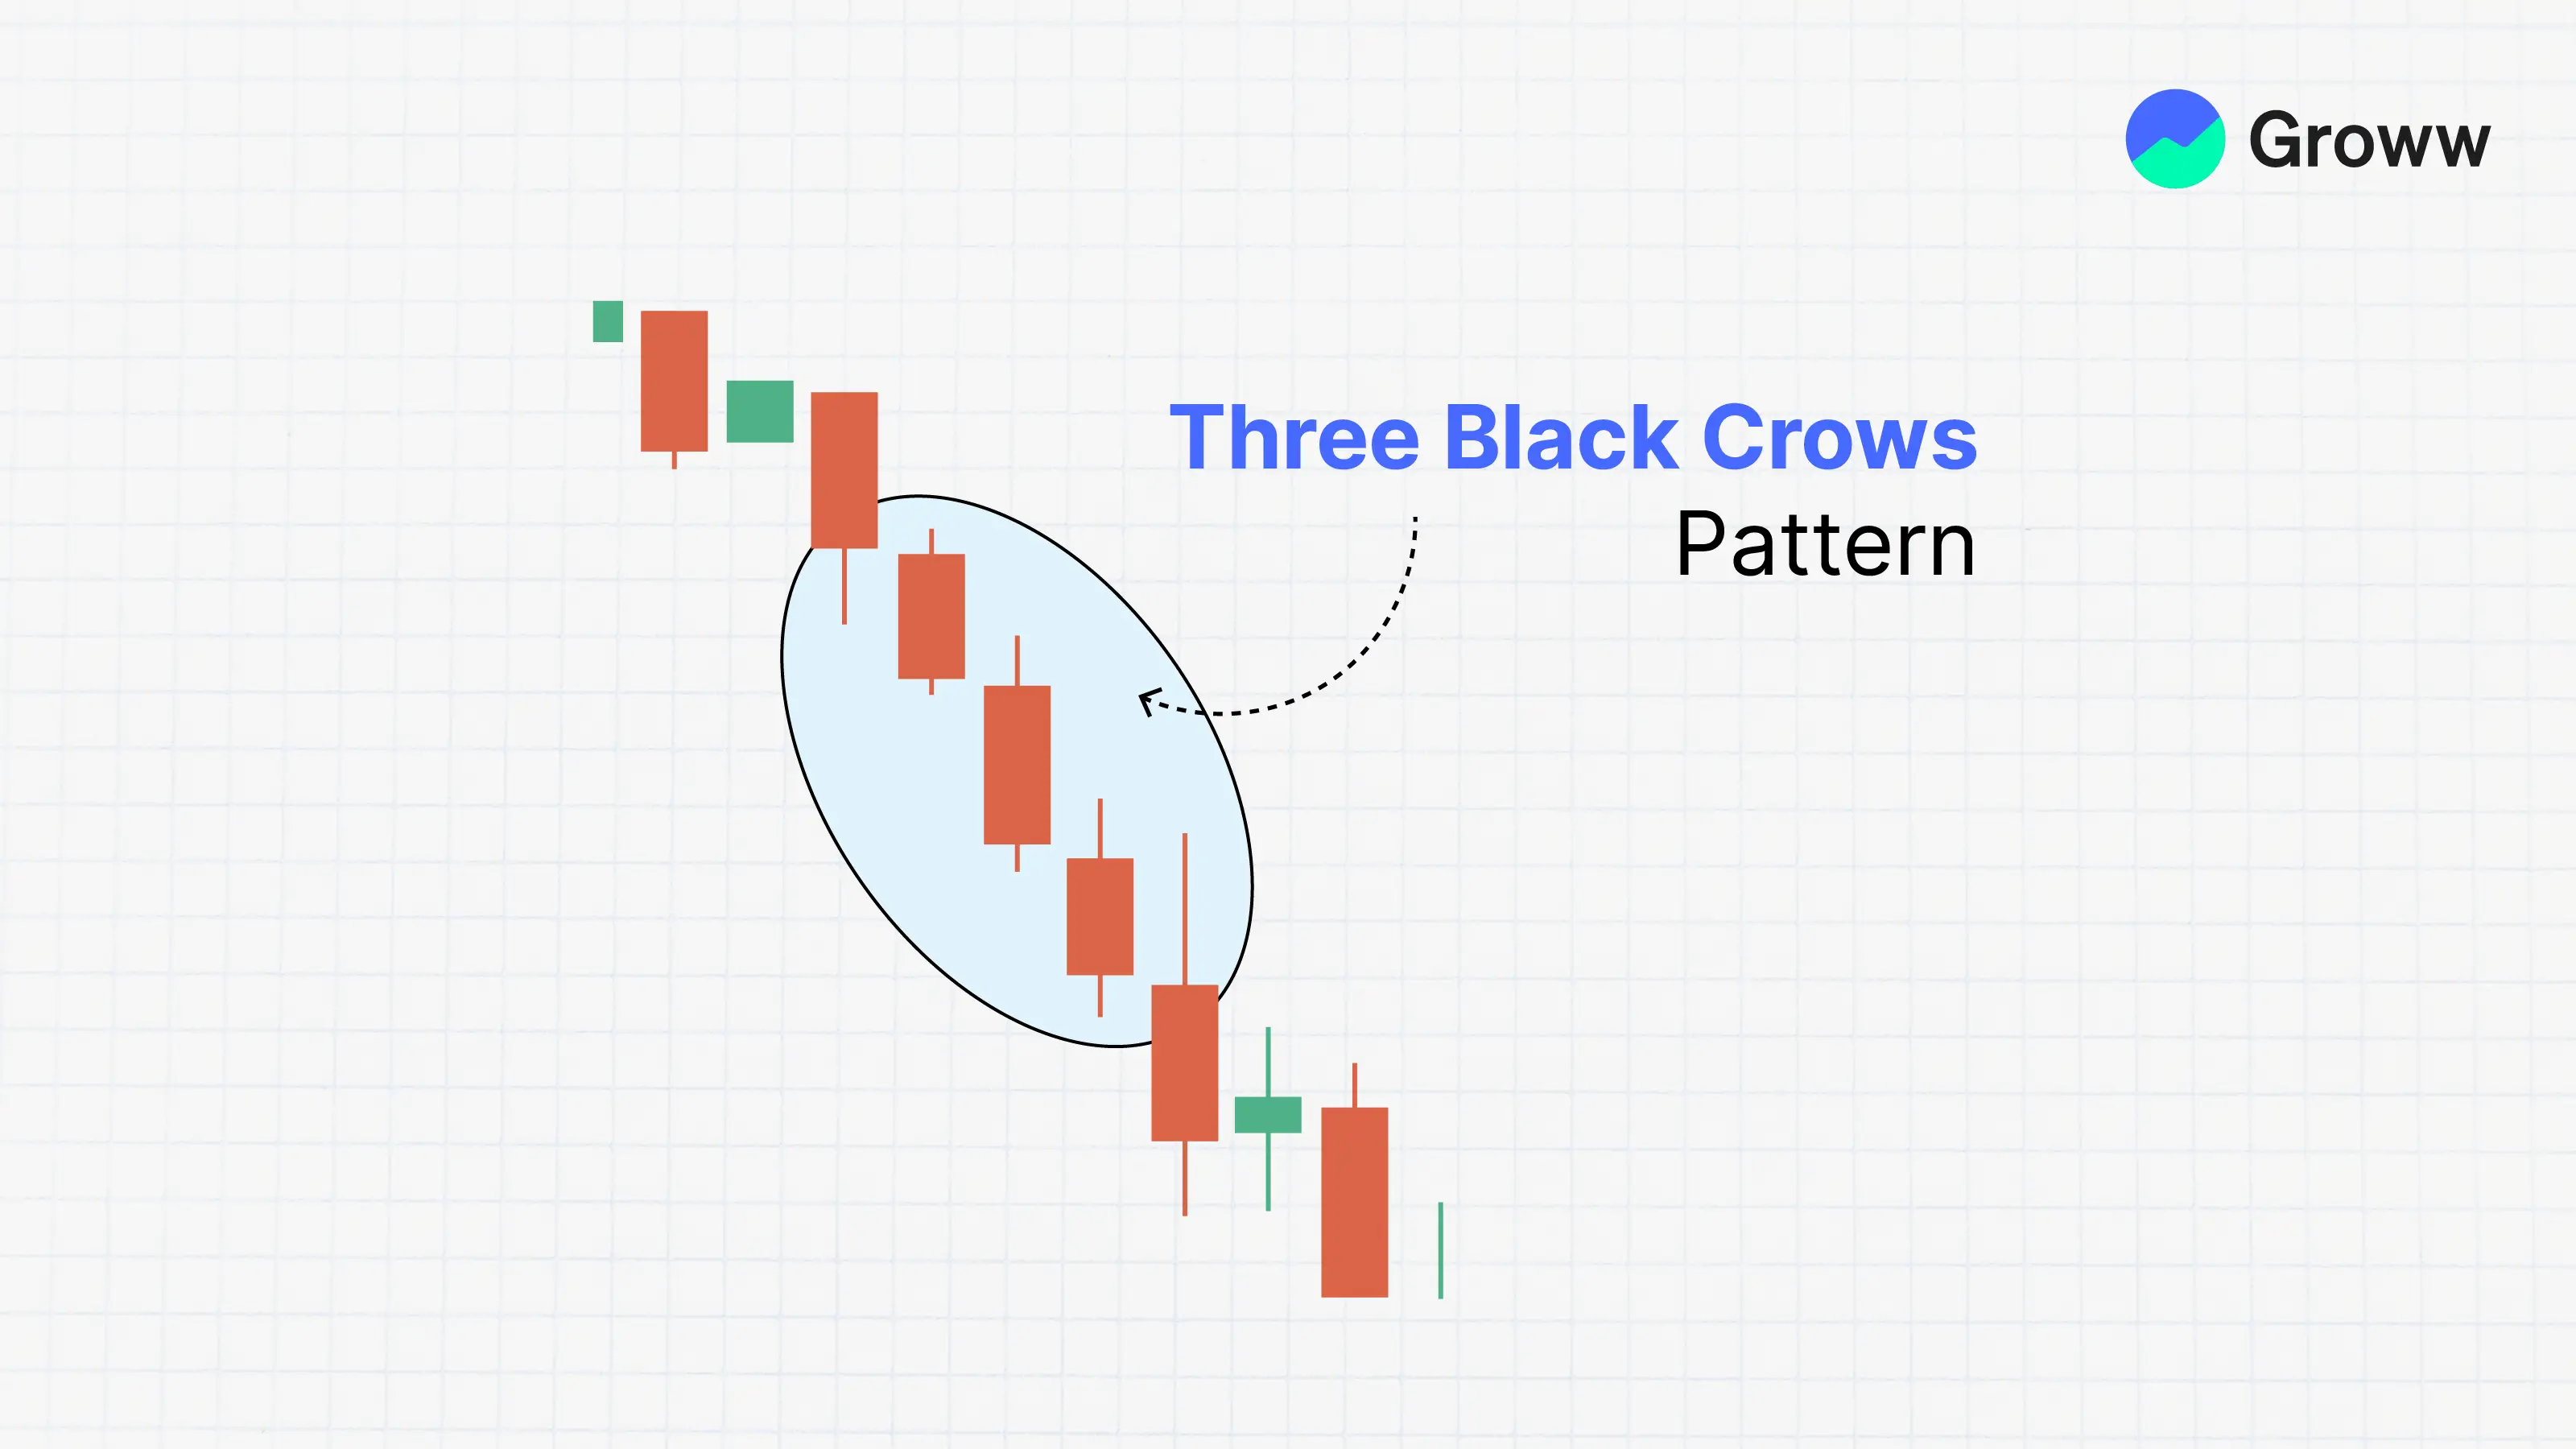
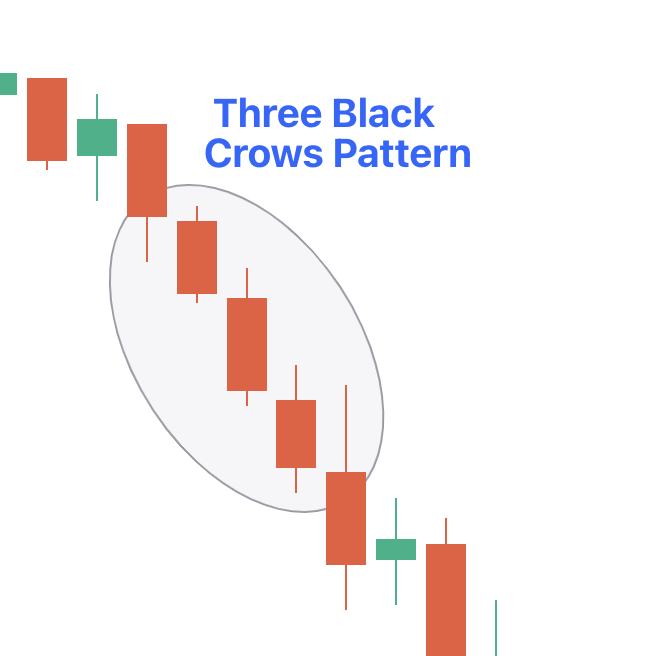
The black crow pattern has three consecutive long-bodied candlesticks that have opened in the real body of the older candle and closed lower than the older candle.
Frequently, traders use this indicator in conjunction with other technical indicators or chart patterns to confirm a reversal.
Understanding the Three Black Crows Candlestick Pattern
The three black crows candlestick chart pattern is a visual pattern, which means there are no specific calculations involved when you identify the indicator. The three black crows pattern is seen when bears overtake bulls in three consecutive trading sessions.
The pattern will show the pricing chart as three bearish, long-bodied candlesticks along with short or no shadows or wicks. When this pattern usually appears, the bulls start the session with the price opening slightly higher than the previous close, but the price is pushed lower through the session.
In the end, the price would close near the session low under pressure from the bears. This trading action would result in very short or non-existent shadows. Traders would often identify this downward pressure that is sustained over three sessions as the start of a bearish downtrend.
Example of the Three Black Crows Pattern
For instance, if you have been observing an uptrend in a specific stock and suddenly see three consecutive bearish candlesticks forming the three black crows, this pattern will indicate a potential reversal of the uptrend, indicating that it may be a good time to consider selling or taking profits.
Traders would frequently use additional indicators to support decisions when trading with the three black crows indicator.
They might look for other technical indicators that signal overbought conditions or bearish divergence to strengthen their analysis.
How to Trade the Three Black Crows Pattern
Here are some steps to effectively trade the Three Black Crows Pattern:
Find the three consecutive bearish candlesticks with lower highs and lower lows. Make sure that each candlestick opens in the real body of the older candlestick and closes at a new low.
Analyse various other technical indicators, market trends, and volume to make sure the reversal signal is provided by this pattern.
Establish proper risk management strategies in order to safeguard capital. This would usually include setting appropriate position sizes, utilising trailing stop loss order, and spreading the portfolio.
Decide on the right entry and exit points for trades. You need to consider utilising stop-loss orders in order to manage risks effectively.
Monitor the price action and adjust your strategy if needed.
Benefits and Limitations of Three Black Crow Pattern
The merits and demerits of this pattern are provided in the table below:
|
Advantages |
Limitations |
|
Research shows that this pattern's success rate is more than 70%. |
A signal from this pattern would show up when the price does not continue to fall. This usually happens when there is a rapid shift in the market mood. |
|
The Three Black Crows Pattern is easily identifiable on candlestick charts. |
Confirmation could be delayed. This pattern will necessitate the creation of three bearish candles, and it might take some time. |
|
This pattern is not limited to one form of asset but can be utilized for various other asset investments, too. |
Check More Bearish Chart Patterns
|
Bearish Pattern |
Features |
|
It forms when a small bullish candle is followed by a large bearish candle that completely engulfs the previous green candle |
|
|
It appears at the top of the uptrend as a single candle with a small body and a long lower shadow |
|
|
It is a three-candlestick pattern that - Starts with a long bullish candle - Followed by a small-bodied candle that gaps up - And ends with a long bearish candle that closes well into the body of the first candle |
|
|
It is a reversal strategy which: - Is a single candlestick pattern with a small body, a long upper shadow, and little to no lower shadow |
|
|
It is a two-candlestick pattern that: - Starts with a long bullish candle followed by a Doji (a candle with a very small body) |
|
|
It is a two-candlestick pattern where: - A small bearish candle is completely engulfed within the body of the previous large bullish candle |
|
|
- It consists of two or more candles with matching highs and appears at the top of an uptrend. - The first candle is usually bullish - And the second candle is bearish |
|
|
- It starts with a long bullish candle - Followed by a long bearish candle that opens below the previous candle’s opening price and closes lower |
|
|
It is a three-candlestick pattern that: - Starts with a bullish candle - Followed by a smaller bearish candle that is completely within the first candle - And ends with another bearish candle that closes lower |
|
|
It is a three-candlestick pattern that - Starts with a bullish candle - Followed by a bearish candle that engulfs the first candle - And ends with another bearish candle that closes lower |
|
|
it is a five-candlestick pattern that: - Starts with a long bearish candle - Followed by three smaller bullish candles that stay within the range of the first candle - And ends with another long bearish candle that closes below the first candle |
|
|
It forms a long green candle followed by a red candle that opens above the previous high but closes below the midpoint of the green candle. |
|
|
It is a three-candlestick pattern that - Starts with a long bullish candle - Followed by a Doji that gaps up from the previous candle - And ends with a long bearish candle that gaps down from the Doji. |