Triple Top Pattern
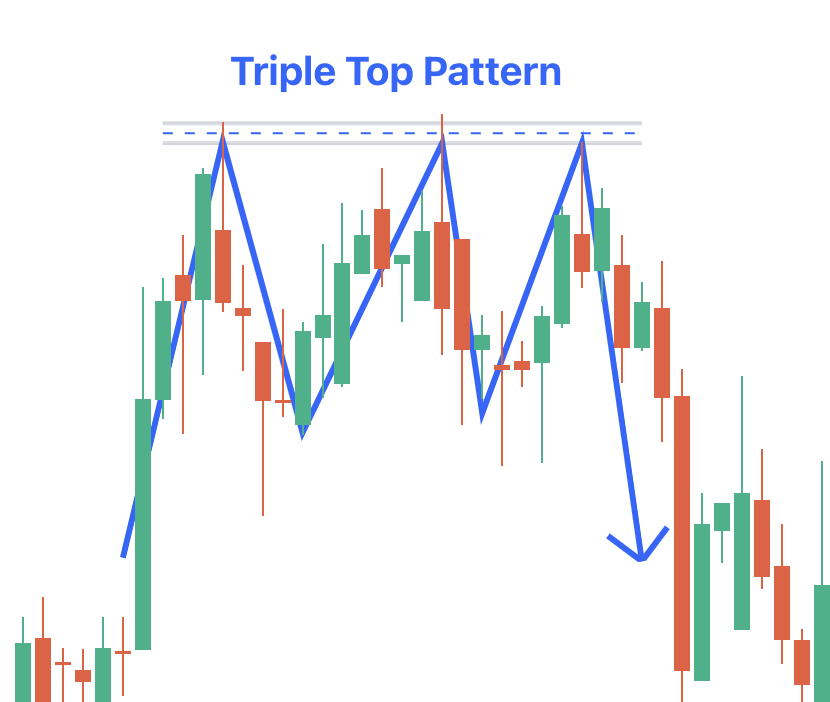
The Triple Top pattern is a bearish reversal that forms after a long uptrend. It suggests a potential shift in market sentiments from bullish to bearish. The pattern has three consecutive peaks at the same price range. However, you can see two minor pullbacks in between.
The peaks form a resistance level that the price fails to break, which suggests a lack of buying pressure. This failure to pass the resistance level three times reinforces its significance and suggests a high probability of a downward reversal.
How Does the Triple Top Candle Pattern Work?
When a triple-top candlestick pattern forms, it indicates a loss in buying momentum and the emergence of selling pressure. The first peak will represent the exhaustion of bullish buying, which will result in a minor pullback.
The subsequent rally would fail to break the older high, which would form the second peak. This failure would further reinforce the resistance level, attracting bearish traders. The price retraces, but the subsequent rally would fall short of breaking the resistance level for the third time, creating a peak.
At this point, the seller will overpower the buyer. This will lead to a downward move, which often results in a trend reversal.
How to Identify the Triple Top Pattern
Identifying the Triple Top pattern requires careful observation of price and chart patterns. Traders frequently use technical tools such as support, trendlines, resistance levels, and oscillators to find patterns.
The steps mentioned below will help you identify the pattern keenly:
- You need to identify the extended uptrend in the price chart.
- You need to spot three consecutive peaks that are equal in height and create a horizontal or slightly downward-sloping resistance level.
- Confirm the pattern by finding two minor pullbacks between the peaks.
- Analyse trading volume during the formation of the pattern. A decrease in volume indicates a loss in buying interest.
How to Trade the Triple Top Pattern
While trading the Triple Top Pattern, you must carefully consider your entry and exit points to maximise profits. The key points you need to keep in mind when trading this pattern are:
Traders often wait for the price to break below the support level, which confirms the pattern completion. This breakdown serves as a signal to enter short positions.
Placing a stop-loss order higher than the resistance level could help you limit your potential losses if the pattern drops and the price goes up.
Traders could set a level to take profit by measuring the pattern's height and projecting it down from the breakout point. In addition to this, support levels or older swing lows could serve as potential targets.
How to Interpret the Triple Top Pattern?
You can analyse the triple top candle pattern as follows:
- Triple top pattern bearish: The Triple Top pattern will serve as a bearish indicator where there is a potential shift in market sentiment from bullish to bearish.
- Resistance Level: The resistance level formed by the three peaks will be a significant barrier for further upward movement.
- Price targets: By measuring the pattern's height and navigating it down from the breakout point, traders can estimate the potential price targets for the downward move.
Advantages and Disadvantages of the Triple Top Pattern
The merits and demerits of the pattern are listed below:
|
Advantages |
Disadvantages |
|
Triple top candlestick pattern offers an early alert of buying pressure and the potential trend change ahead. Traders can prepare for reversals in advance. |
Sometimes, support breaks temporarily before the price returns above it. This false breakdown invalidates the pattern, resulting in lost trades. |
|
The entry near support with stops higher, the triple peaks will offer a defined risk point. Profit targets are open below support, offering a favourable risk-reward situation. |
The pattern can be nullified if resistance breaks to the upside. Traders must swiftly exit losing deals when patterns collapse. |
|
According to statistical research, the triple top often resolves in the predicted direction once support breaks. This high chance of success boosts the trading edge and profit potential. |
Triple tops are best suited for trending markets. Range-bound situations cause frequent failures and pauses to occur. |
|
The pattern establishes an objective environment for completing or avoiding transactions. Traders wait for precise setups instead of overtrading without a strategy. This boosts the victory rate. |
The pattern should ideally coincide with other technical indicators to confirm the reversal with a higher likelihood of its happening. |
|
Reduced volume at each peak and increased volume at the breakdown improve pattern validity. Combining volume analysis with the pattern increases confidence. |
Entering at the second top expecting a breakdown, increases the probability of failure compared to waiting for confirmation. |