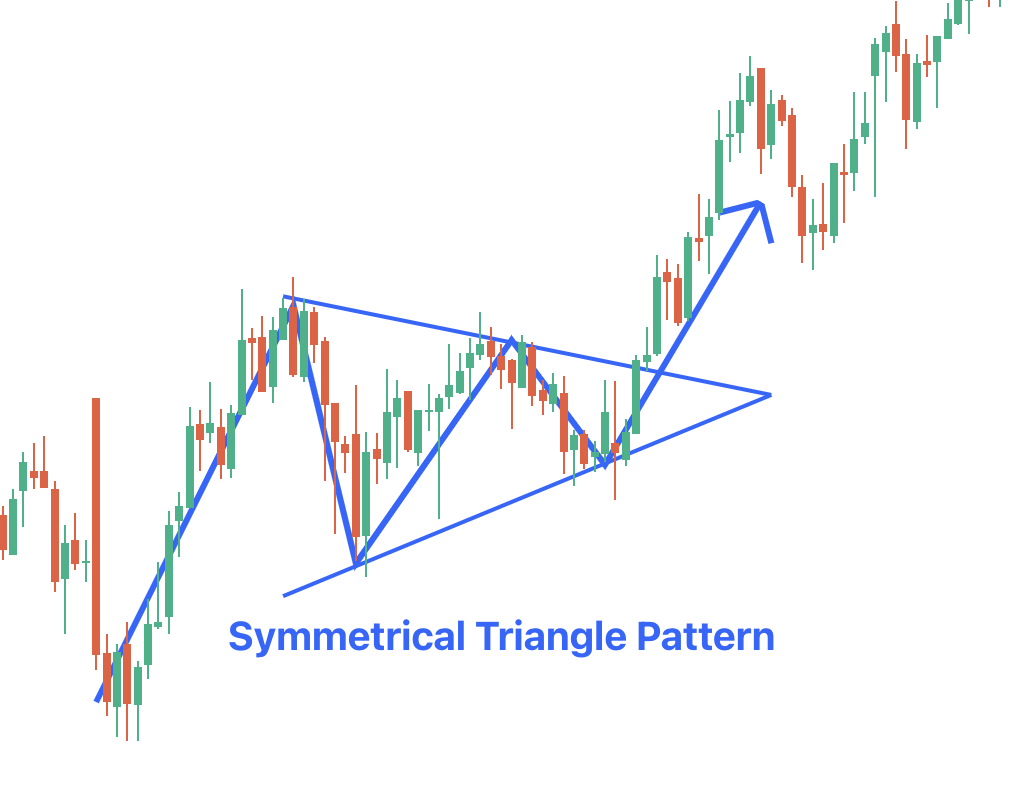
Symmetrical Triangle Pattern
A symmetrical triangle pattern is also known as a coil. It is a chart pattern that features two converging trendlines linking a series of sequential peaks and troughs. These trendlines need to converge with opposite slopes, which form a narrow pattern that mirrors a triangle.
Keep reading to understand this pattern in detail.
Overview of the Symmetrical Triangle Chart Pattern
A symmetrical triangle candlestick pattern is a period of consolidation before the price is pressured to break out or down. A breakdown from the lower trendline will mark the beginning of the bearish symmetrical triangle pattern. A breakout from the upper trendline will indicate the beginning of a bullish, symmetrical triangle chart pattern.
The price target from a symmetrical triangle pattern breakout or breakdown will be equal to the distance from the high and low of the earliest part of the chart applied to the breakout price.
The stop-loss for this pattern is frequently put right below the breakout point. Symmetrical Triangles will be different from ascending and descending triangles that are from the upper and lower trendlines and will slope towards the centre point.
In contrast to this, the ascending triangles have a horizontal upper trendline, which predicts a potential breakout higher, and descending triangles have a diagonal lower trendline, which predicts a potential breakdown lower.
Symmetrical triangle chart patterns are like pennants (a form of continuation pattern) and flags since they can signal a continuation in price trends.
However, the flags and pennants can signal the required shift before they are formed. Symmetrical Triangles could take shape even without any previous movement.
How to Identify a Symmetrical Triangle Pattern Chart
Six primary attributes can help identify a Symmetrical Triangle. These are:
- Converging Trendlines
Traders will first look for two converging trendlines. One should be ascending, and the other descending. The upper trendline will connect with the lower highs, while the lower trendline will connect with the higher lows. The convergence of these trendlines will show that buyers and sellers are quite unsure of the market direction, which will produce a phase of consolidation.
- Volume
Volumes will tend to decrease as the pattern develops, mirroring the market's indecision. A drop in trading volume could be an important indicator of a Symmetrical Triangle. When the breakout takes place, there needs to be an increase in the volume, which confirms the pattern's validity and the new movement of the price.
- Duration
Symmetrical Triangles can be created over different time frames – in weeks or months. The longer the pattern develops, the more impactful the results of the breakout. The Symmetrical Triangle pattern will end with the price breaking out of the converging trendlines. This breakout is an important signal of the price's future direction. The breakout could take place in either direction, upward or downward.
- Breakout
Once the breakout happens, a trader can predict the price target by measuring the broadest part of the triangle and indicating the distance from the breakout point. This measurement will show how far the price could move following the breakout.
- Market Sentiment
When the Symmetrical Triangle does not signal the direction of the breakout, it will reflect a period of equilibrium between supply and demand. A trader will often read the direction of the breakout, which is where the market sentiment has moved. Spotting a Symmetrical Triangle will take patience and practice since the pattern develops over a period of time.
If you are a trader, you need to watch for these formations closely, as they can make tactical moves.
How to Trade the Symmetrical Triangle Candlestick Chart
Once you have found the Symmetrical Triangle on a chart, you will have to wait for a breakdown or breakout to take place. Just like other breakdowns or breakouts, there are two major options for entering a trade. First, you will have to enter the market when the candle on a high time frame chart closes above or below the triangle.
Second, you could choose to wait for the price action to break the triangle and then get back to retest the broken trendline. This choice will give you a better entry, as you can utilise the opportunity to enter the trade exactly as planned. On the other hand, its demerits lie in the fact that you would never get the chance to enter a trade, as the retest is not guaranteed to occur.
The benefit of the first option is that you would not miss out on a trade, as you would when the candle closes above or below the trendline.
However, the close could happen far away from the trendline, which would mean that your profit window has been slashed while the amount of pips you are risking has increased.