Spinning Top Candlestick Pattern
A spinning top is a candlestick formation signaling indecision regarding the future trend of the stock. It is known to be a neutral pattern, though it could end up in reversals. In this post, we will discuss the spinning top candlestick pattern and all other attributes revolving around this pattern.
What is the Spinning Top Candlestick Pattern?
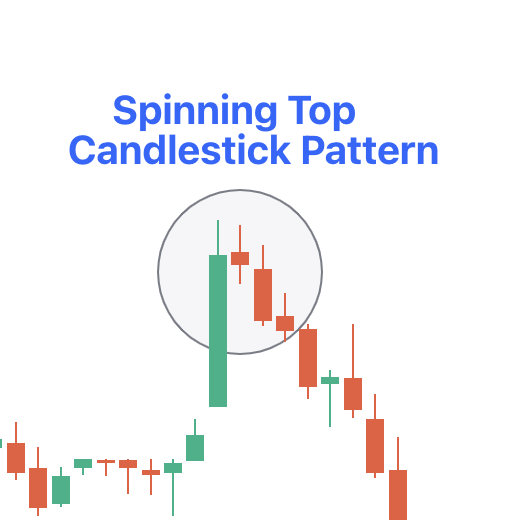
The spinning top is a candlestick pattern with a short real body vertically centred between long upper and lower shadows. The candlestick pattern represents indecision about the future movements of the asset, which suggests that the buyer or seller could possibly gain the upper hand.
This candlestick forms when the buyers push the price up in a provided time frame, and the sellers push the price down during the same time period. Ultimately, the closing price ends up being very close to the opening price. After a strong price advance or fall, this pattern could possibly signal a price reversal if the candle that follows confirms.
A spinning top could close above or below the open. However, the prices are always close together.
Insights Provided by Spinning Top Candlestick
Spinning tops are a sign of indecision in the stock, and the long upper and lower shadows tell us there wasn't a meaningful change in prices between the open and close. The bulls sent the price sharply higher, and the bears sent the price sharply lower, but in the end, the price closed close to where it opened.
The indecision could indicate more sideways movements, especially when the spinning top occurs within an established range.
It could also predict a possible price reversal if it happens after a price advance or fall. Sometimes, these patterns signal a significant change in trend. A spinning top that occurs at the top of an uptrend would be a sign that bulls are losing their control, and the trend could reverse.
Likely, a spinning top at the bottom of a downtrend could signal that bears are losing control and bulls may take the reins.
In some cases, the confirmation would assist in clarifying what the spinning top is saying. The confirmation comes from the next candle. When a trader believes that a spinning top after an uptrend could result in a reversal to the downside, the candle that comes after the spinning top needs to witness price drops. If that does not happen, the reversal is not confirmed, and the trader will need to wait for another trade signal.
If the spinning top happens within a range, this will show that indecision is still present, and the range will likely continue. The candle that follows needs to stay in the established sideways channel.
Spinning tops are a common candlestick pattern, which means they work in conjunction with other forms of technical analysis.
How to Trade the Spinning Top Candlestick Pattern
There are a few methods for trading the spinning top candlestick pattern. The first crucial step is to confirm the signal. Most traders use technical indicators to confirm what they believe the spinning top is signalling, since these indicators could offer more insights into price trends.
If you think a spinning top at the bottom of a downtrend could indicate an upcoming reversal, you could test the signal with the stochastic oscillator. This indicator could assist you in estimating price movements since it shows the speed and momentum of the market over a specific time horizon. If the upcoming reversal is confirmed, you would want to buy or go long.
To trade this pattern, you could use derivatives such as spread bets or contracts for difference (CFDs). With derivatives, you do not take ownership of the underlying assets but estimate their price movements.
This means you could trade rising and falling markets to take action following both the bearish spinning top candlestick pattern and the bullish spinning top candlestick pattern.
Advantages and Disadvantages of Spinning Top Candlestick Pattern
The merits and demerits of the spinning top are listed below:
|
Advantages |
Disadvantages |
|
This pattern will help the trader work in the minimum suggested investment time. |
Since these candlesticks are too common, many of them could be inconsequential. |
|
The spinning top is where the traders can move prices higher and lower during the trading process. |
The pattern occurs when the price is already moving sideways or a movement is about to begin. |
|
When the spinning top patterns occur after a prolonged uptrend or downtrend, it would suggest that the current trend is losing momentum and a reversal could be imminent. |
The pattern requires confirmation, but even with confirmation, the price is not certain to continue in the new direction. |
|
This pattern helps the trader identify possible pause points in an ongoing trend, which allows for better timing of entry and exit points. |
Trading around the spinning top could also pose problems since the candle could be pretty large from the high to the low. |
|
This pattern can be used in different time frames, making it applicable for both long- and short-term strategies. |
Analysing the reward potential of this pattern is also hard since the candlestick pattern does not offer a price target or an exit strategy. |