Double Bottom Pattern
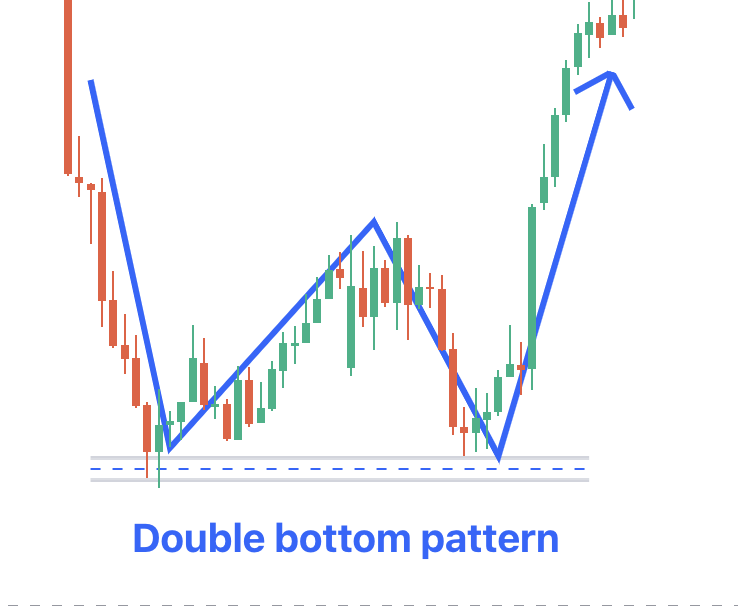
The Double Bottom Pattern is one of the very few that clearly illustrates reversals in market direction. It looks much like the letter 'W' and is a chart pattern that investors can utilise to their benefit.
This post describes the details of this pattern, how to spot it, its strengths and limitations.
What is Double Bottom Pattern?
The double bottom pattern points out a trend reversal in the stock market. The pattern belongs to the price action technical analysis technique, which involves analysing price movements without utilising additional technical indicators. It is formed when two bottoms come into being at the same level.
Between these two lows, a small upward correction takes place. This is a reversal pattern that signals a move from bearish to bullish. The double bottom pattern is found in all financial markets.
This pattern is formed both in the short and long term. It mainly has three parts:
- The First Low: After a strong downtrend, the market bounces higher. Whenever the price of a security is lower than that of another over a time frame, you can see the formation of a swing low. It is likely a retracement in a downtrend, not an indication of a price trend reversal.
- The Second Price Reversal: The second drop is formed as the market discounts the previous downtrend and the buying pressure rises. There would be signs of a price reversal and an uptrend when the second bottom is formed. However, it is still too early to say if the price will continue to rise.
- The Neckline: The neckline or resistance level is the maximum price that the asset could achieve over a period of time in an uptrend market. A double bottom pattern is complete when the price breaks over the neckline. This indicates more buyers than sellers, and the price is likely to continue moving higher.
Also Read : What is Double Bottom Pattern?
Indications of the Double Bottom Chart Pattern
This pattern is a classic technical chart that shows a major change in trend following a previous down move. This analysis is significant because it shows an important low or strong level of support (support is the price level that an asset does not fall below for a period of time) has been reached during the down move.
The pattern always follows a big or small downtrend in a security, indicating a reversal and the beginning of a potential uptrend.
The minimum price target of the formation is the distance from the prior low to the high in the middle formation. The target will be approximately 10% higher than the initial low of the double bottom pattern chart.
In technical analysis, the price movement of the double bottom pattern is seen when the price drops, rises, falls again, and then rises once more. This pattern resembles the shape of the letter 'W'.
How to Identify a Double Bottom Pattern
As mentioned earlier, identifying and drawing the double bottom pattern is extremely crucial. You can spot the analysis when a pair moves lower before it struggles to break below the horizontal support and further extends into the bearish phase.
Merits and Demerits of the Double Bottom Candlestick Pattern
The advantages and disadvantages of a double-bottom pattern are described in the table below:
|
Merits |
Demerits |
|
This is one of the strongest reversal patterns since it is not a very common pattern. |
The main risk is that the market will continue to move in the same direction. |
|
It is known to be very effective in predicting the change in trend direction. |
It needs to be consulted with supporting factors in the context of other indicators. |
|
It offers a clear and defined level to play against. |