Head and Shoulders Pattern
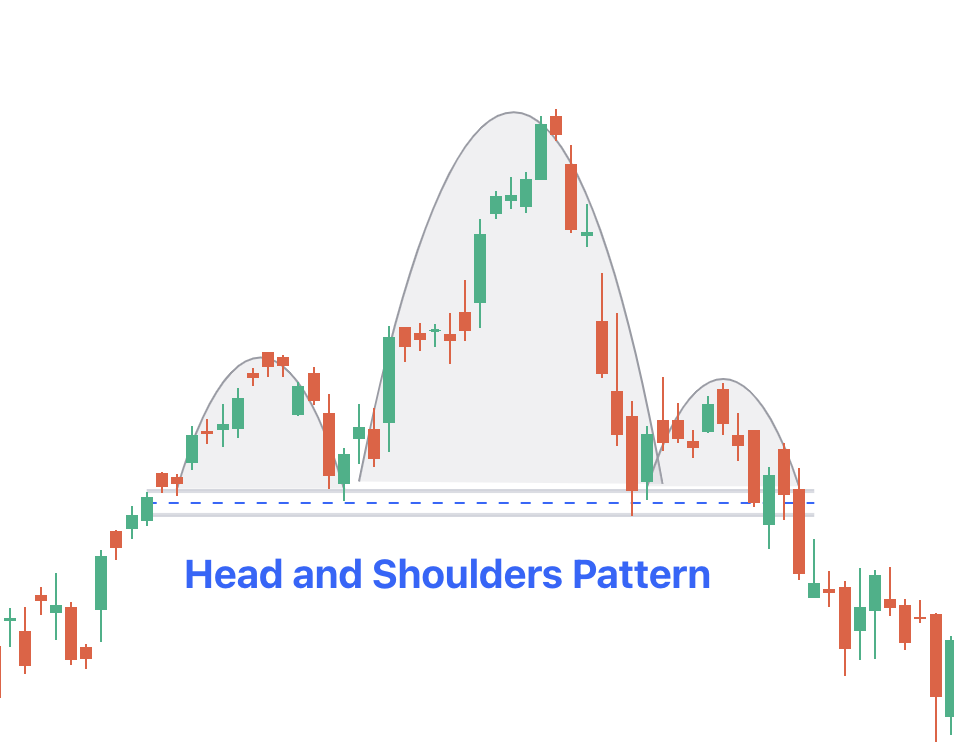
Head and Shoulders is a notable chart pattern employed in technical analysis to anticipate changes in market trends. It consists of three peaks and troughs that mimic the shape of a human head and shoulders.
This pattern serves as a valuable indicator for traders, offering insights into potential shifts in market direction. Let's take a closer look at its mechanics.
What is the Head and Shoulders Pattern
In the head and shoulders chart pattern, the first peak, or "shoulder," is followed by a decline into a trough. Then, a higher peak forms the "head," surpassing the first shoulder. Finally, another decline forms the second shoulder, typically not dropping significantly below the first shoulder.
A key feature is the neckline, connecting the troughs of the shoulders. The pattern completes when the price breaks below this neckline, confirming the reversal.
Additionally, here is the head and shoulders pattern breakout that consists of 4 key components:
|
S.No. |
Pattern Name |
Details |
|
1. |
Left Shoulder (Initial Peak and Decline) |
The pattern begins with an initial peak in the price, followed by a decline, forming the left shoulder. This decline indicates a temporary reversal from the upward trend seen before the peak. |
|
2. |
Head (Higher Peak and Another Decline) |
Following the left shoulder, the price rises again to form a higher peak, known as the head. This peak signifies a strong upward movement. Subsequently, the price declines once more after the head formation. |
|
3. |
Right Shoulder (Third Peak) |
After the decline from the head, the price rises again to form a third peak, which is similar in appearance to the first peak. This completes the formation of the right shoulder, mirroring the left shoulder. |
|
4. |
Neckline |
Finally, the crucial element of the head and shoulders chart pattern is the neckline, which is a horizontal line connecting the troughs of the first and second shoulders. The pattern is considered complete when the price breaks below this neckline, signalling a confirmation of the reversal. |
Inverse Head and Shoulders Chart Pattern
The Inverse Pattern of Head and Shoulders serves as a bullish reversal signal from a downtrend to an uptrend. It's essentially a mirror image of the traditional head and shoulders candlestick pattern, featuring three troughs and peaks that resemble an upside-down head and shoulders.
Firstly, the pattern formation starts with a trough, followed by a rise in price, marking the formation of the first peak. Subsequently, the price declines below the previous trough before rising again to create the second, lower trough, which acts as the head of the pattern. Finally, the price rises once more to form the third trough, which is typically not as low as the second trough, thus completing the formation of the right shoulder.
Similar to its traditional counterpart, the neckline is a pivotal element in the inverse head and shoulders trading pattern. It is drawn by connecting the highs of the two peaks formed after the first and second troughs. The pattern is considered complete when the price breaks above this neckline, confirming the reversal from a downtrend to an uptrend.
Advantages and Disadvantages of the Head and Shoulders Chart Pattern
The advantages and disadvantages of this pattern are:
|
Advantages |
Disadvantages |
|
Defined Risk and Profit: Traders can clearly define entry and exit points, along with stop-loss levels, minimising ambiguity and managing risk effectively. |
Neckline Movement Ambiguity: There might be instances where the neckline appears to shift, causing confusion and uncertainty among traders regarding pattern confirmation. |
|
Versatility Across Markets: This pattern can be applied across various markets, including forex and stocks, enhancing its utility and applicability. |
Novice Traders' Challenge: Novice traders may struggle to recognise the pattern, potentially missing out on trading opportunities. |
|
Profit from Significant Movements: The pattern typically unfolds over a considerable time frame, enabling traders to profit from substantial market movements. |
Large Stop Loss Distances: In certain scenarios, the pattern may lead to large stop-loss distances, increasing the risk exposure for traders. |
|
Easy Recognition: This pattern is easily identifiable by experienced traders, facilitating prompt decision-making. |
Unfavourable Risk-to-Reward: Traders may encounter situations where the risk-to-reward ratio is unfavourable, posing challenges in achieving desirable profitability. |
How to Trade Using Head and Shoulders Pattern?
Trading with the Head and Shoulders model involves several strategic steps to maximise the potential for profitable trades. Here's a comprehensive guide on how to effectively trade using this pattern:
- Wait for the pattern to fully form before trading to avoid false signals.
- Identify the key components of the pattern: three peaks and troughs, with the head higher than the shoulders, connected by a neckline.
- Initiate trades only after the neckline is breached, confirming the pattern's validity.
- The head and shoulders pattern target can be calculated by measuring the distance between the head and neckline.
- Implement stop-loss orders strategically to manage risk.
- Monitor trading volume during the breakout phase for confirmation.
- Adjust trading plan based on evolving market conditions.
- Consider supplementary indicators for confirmation, such as trend lines or moving averages.
- Practise proper risk management principles to protect capital.
Assessing the Reliability of Head and Shoulders Candlestick Patterns
The head and shoulders trading pattern is often viewed as a dependable signal for potential trend reversals; however, its effectiveness can vary depending on market conditions. Like any trading approach, it's advisable to combine this pattern with other indicators for improved precision and reliability.
Understanding its components, advantages, and disadvantages empowers traders to make informed decisions. While its reliability varies, combining it with other indicators enhances accuracy.