Descending Triangle Pattern
A descending triangle pattern indicates a bearish chart, and it is widely used for the purpose of technical analysis. This chart is characterised by a descending upper trendline and another flatter and horizontal trendline, which is lower than the first one.
Here, we will try to understand the basics of the descending triangle pattern.
What is Descending Triangle Chart Pattern?
Traders can use this pattern to determine whether the demand for an asset, derivative, or commodity is weakening. When the price breaks below the support level, it indicates that the downward momentum can continue. The descending triangle, often known as the falling triangle, has an inherent measuring technique that could be applied to the pattern to gauge likely take-profit targets.
Traders look for descending triangles since the pattern indicates a breakdown. When the price drops, buyers come in and push the price up even higher.
However, the descending triangle indicates a lack of buying pressure. Descending triangles are famous for offering traders the chance to make considerable profits over a short period of time.
Technical traders take a bearish position to trade the pattern. To profit from the descending triangle, traders have to identify clear breakdowns and avoid false indicators.
They need to consider that if there are no breakdowns, the prices will test the upper resistance before moving down once again.
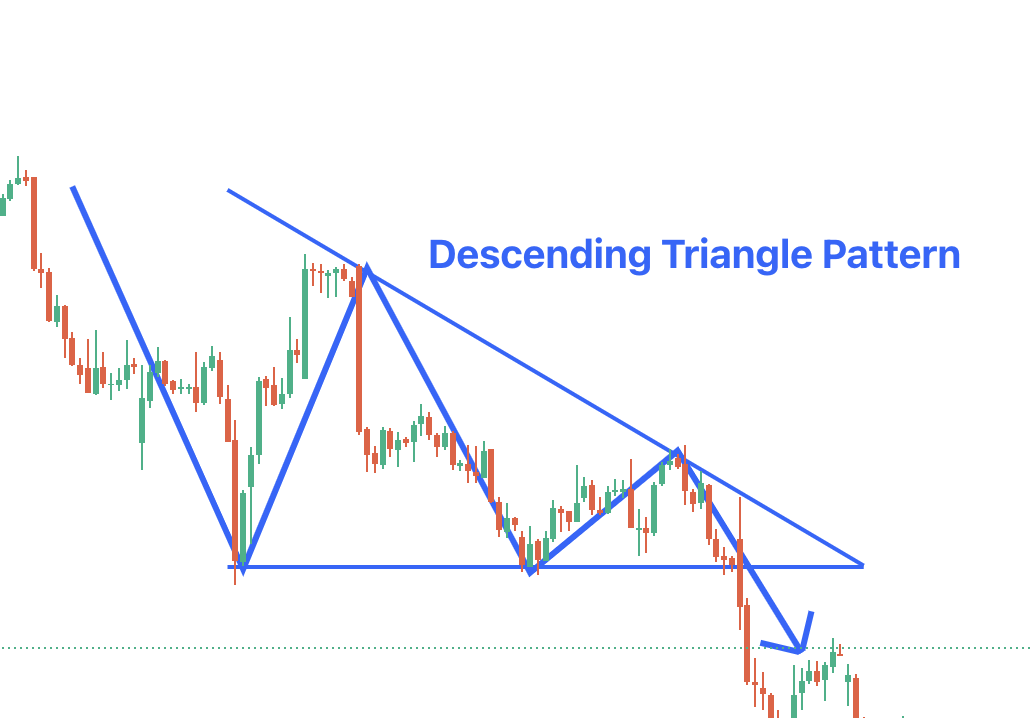
Visual Structure and Formation
Here is how the Descending Triangle pattern looks-
The descending triangle pattern has two parts:
- Horizontal support: This is the support line which acts like the base of the triangle.
- Descending resistance: The resistance line is downward sloping. This line connects the series of all the lower highs. This decline shows that the buyers are not able to reach the previous peaks, and hence, the strength is reducing for the buyers.
Over time, these two forces may squeeze the price into a narrowing range. This depends on the time frame; the triangle may last from a few weeks to several months.
In shorter time frames, it might compress quickly. The best way to think of this is spring being compressed. As the pattern continues to grow, the tension builds up. Eventually, the spring releases its energy. This is usually in the direction where there is less resistance. And in the case of Descending Triangle, this is the downward short entry.
Characteristics of Descending Triangle Pattern
The main features of this chart pattern are listed below:
- Descending triangles are typically of two trend lines.
- These triangles suggest that investors and traders are more aggressive than buyers, as the price consistently reaches lower highs.
- It is a famous chart because it clearly shows that the demand for an asset or commodity is weakening.
- The pattern completes itself when the price breaks out of the triangle in the direction of the trend.
- Once the descending triangle pattern breakout takes place, technical traders can aggressively push the price of the asset even lower and make profits in a short time.
Bearish Signals and Market Behaviour
The Descending Triangle pattern gives a sign of deep market psychology. Buyers are trying to take the market up from the support level. However, they are unable to push the prices up. Every rally attempt is weaker than the previous one. Sellers, on the other hand, are trying to lower prices. They are consistently able to do, as can be seen by declining swing highs. Every time the sellers hit the support zone, it weakens.
Let's take an analogy. Imagine a person who is hitting the ground with a hammer. The first few hits are usually a waste of effort. There will be evidence of very little to no damage. However, if he keeps striking multiple times, these blows will eventually lead to a crack. Similarly, the more often the price tests the support, the higher the probability that it will break down decisively. This is the reason why the descending triangles are classified as a bearish continuation pattern.
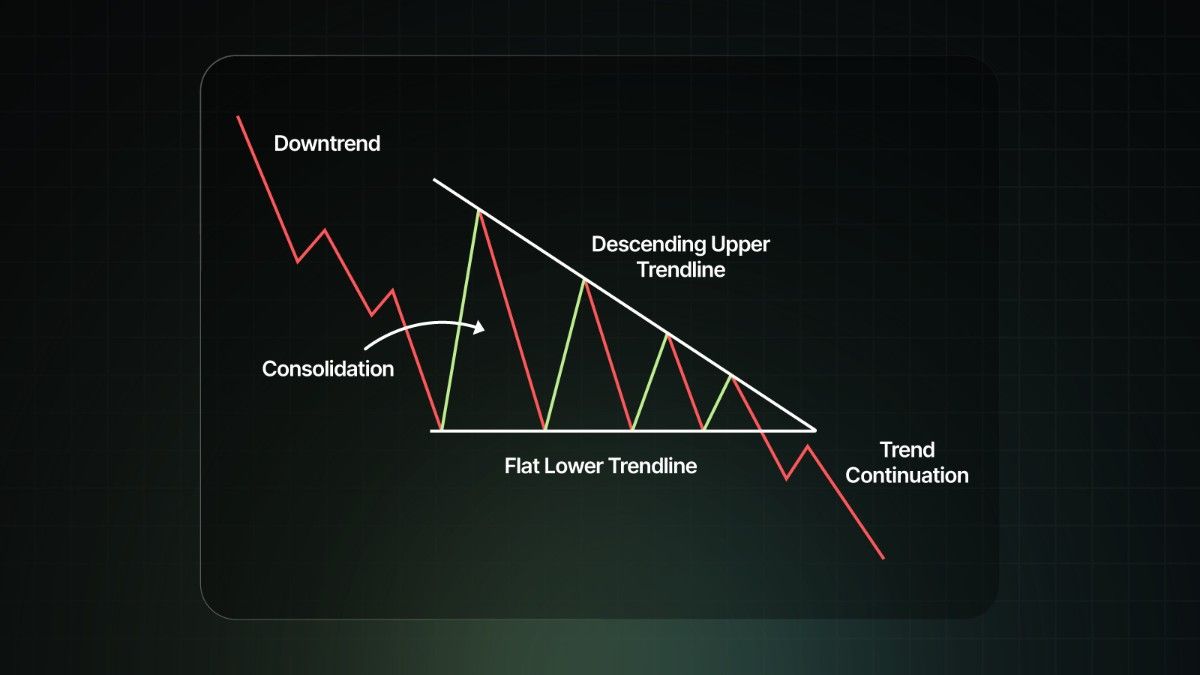
How to Find a Descending Triangle Candlestick Pattern
Descending triangles have several notable characteristics that traders and investors can use to identify them. The features typically applied here are:
The market needs to be in an existing downtrend before the descending triangle patterns form.
The descending triangle forms when the market enters the consolidation phase. Building on the second point, a downward-sloping trend line could be drawn by linking the upper points and indicating that the sellers are pulling the prices down.
The lower horizontal trend line acts like a support, and the prices often approach the level until the breakout happens. The continuous downtrend takes place after the breakout below the lower trend line.
How to Trade the Descending Triangle Pattern: Entry and Exit Points
Here is how a descending triangle pattern can be traded:
- Breakout Strategy
Traders can enter a short position as soon as the price breaks below the support level. Conservative traders can wait for the price to close below the support to take the entry. - Retest Entry
This is a more protective approach where the traders can wait for the stock to retest. Retest means the stock makes a minor pullback to the resistance zone. Once this is done, the traders can go for a short entry. While this method will result in missing some quick moves, it reduces the risk of falling for a false breakdown. - Stop Loss Placements
Stop losses are very critical when you are trading a descending triangle. The most common placements are: - Slightly above the descending resistance line.
- Or just above the most recent swing.
If the market reverses unexpectedly, you are protected from significant losses.
- Target setting
This measured move technique is widely used for selling profit targets. To find this, measure the height of the triangle, which is the vertical distance between the first height and the support line. And this distance can be projected downwards from the breakdown point.
For example, if the triangle height is ₹50, and the breakdown happens at ₹200, the projected target becomes ₹150. The approach gives the traders a clear, logical price objective, helping them to lock in the profits rather than holding them blindly.
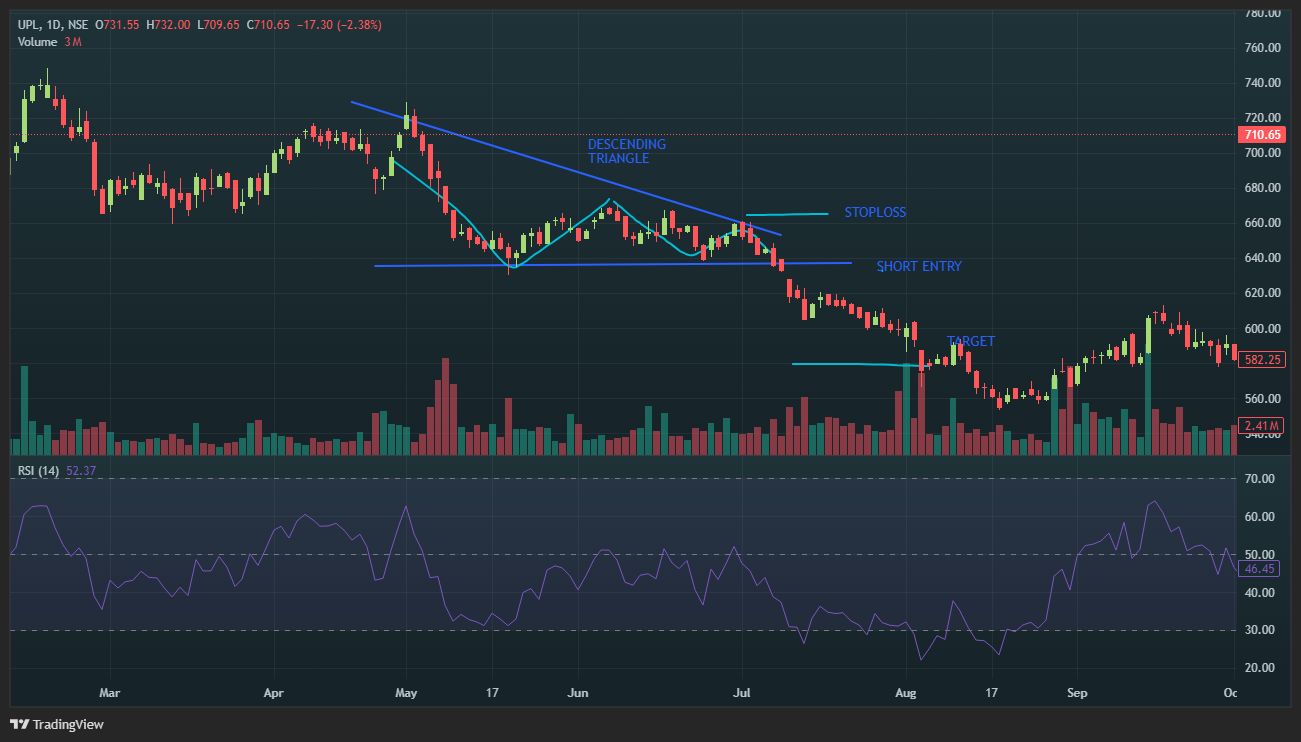
Real Examples from Markets
Here is an example of UPL on a daily timeframe. A descending triangle formation occurs, which breaks the support level. Traders can get a short entry there. The stop loss can be the previous swing high. Traders may put a 1:2 target on the downside, which can be easily attained in this case.
Difference in Comparison With Other Triangle Patterns
There are different kinds of triangle patterns. Here are the differences between them:
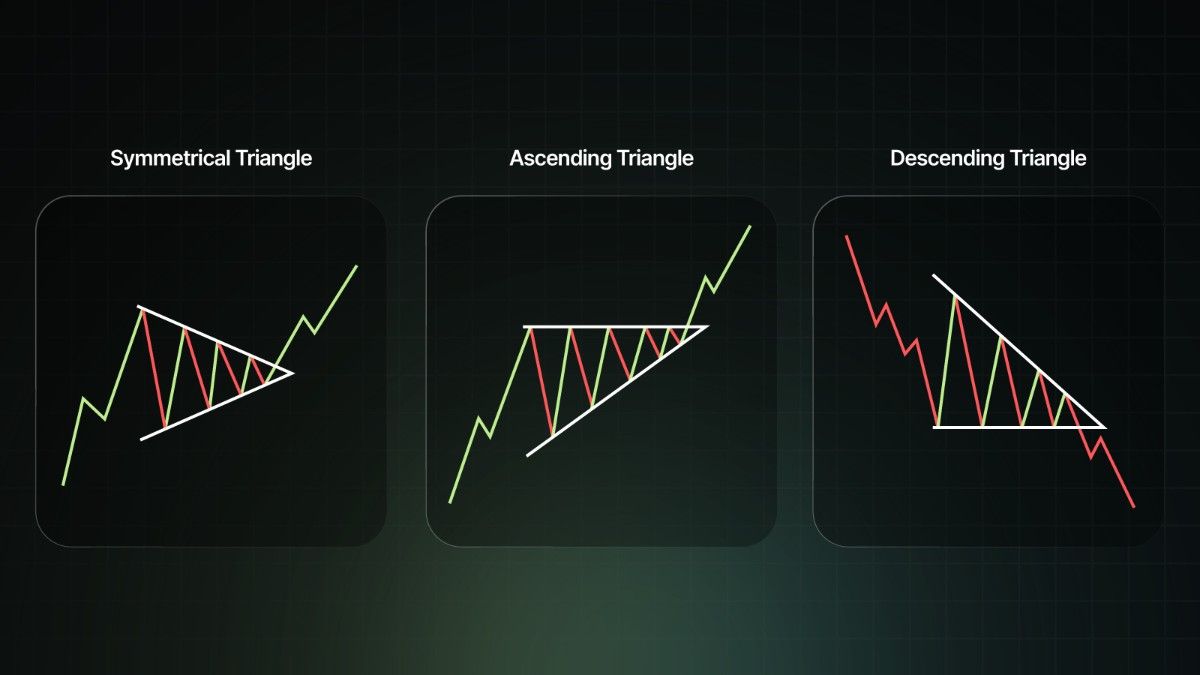
- Ascending Triangle: They are seen when the market is already in a bull run but faces a temporary resistance. Rising support levels mark them, and the break of the resistance can offer further bullish bias.
- Descending Triangle: This pattern is seen when the market is already in a bear trend but faces temporary support. Declining resistance levels mark these, and the break of the support can offer further bearish bias.
- Symmetrical Triangle: This is very interesting, because here both the upper (resistance) and lower (support) lines are converging trendlines. This looks like a volatility contraction and a breakout either way is possible.
Here is the anatomy of the three types of triangles:
Risk and the Reward
While this pattern more often than not produces good short entries, it cannot always be profitable. Risk management is extremely important when you are trading the pattern. Traders should put a stop loss and aim for a risk-to-reward ratio of at least 1:2. If the markets are choppy, traders can reduce the position size because the accuracy of the pattern reduces.
Merits and Demerits of the Descending Triangle
The table below lists out the advantages and disadvantages of the descending triangle:
|
Merits |
Demerits |
|
It is an easily identifiable pattern and forms a clear target level. |
There is always the potential for a false breakdown, which is where the downtrend reverses the pattern. |
|
The descending triangle pattern is thought to be one of the most trustworthy and effective trading patterns, as post-pattern implications take place faster than other patterns. |
There are chances of the prices moving sideways or higher over lengthy time horizons, which acts contrary to the usual characteristics of the descending triangles. |
|
Traders would consider opening a long or short position once the falling triangle pattern is verified based on the direction of the price movement. |
In some cases, the trend lines need to be redrawn as the prices can break out in a direction opposite to what was expected. |
Conclusion
The descending triangle is one of the most useful bearish patterns. It can be used to convey that there is growing seller pressure, weakening buying strength and a high probability of breakdown. To be able to trade successfully, traders must:
- Wait for the confirmation through volume and closing prices.
- Manage the risk with a well-placed stop loss
- Can look for critical zones to trade.
When used with the correct mindset and discipline, it could help the traders identify the high probability setups.