Evening Star Pattern
In the fast-paced world of stock trading, where market sentiment shifts can impact investments, a candlestick pattern is important. Among these patterns, the Evening Star chart pattern emerges as a powerful indicator of potential market reversals.
In this article, we'll look into the Evening Star Pattern to get a thorough grasp of its importance and complexities.
Check Here to know How to Read Candlestick Charts.
What is Evening Star Pattern?
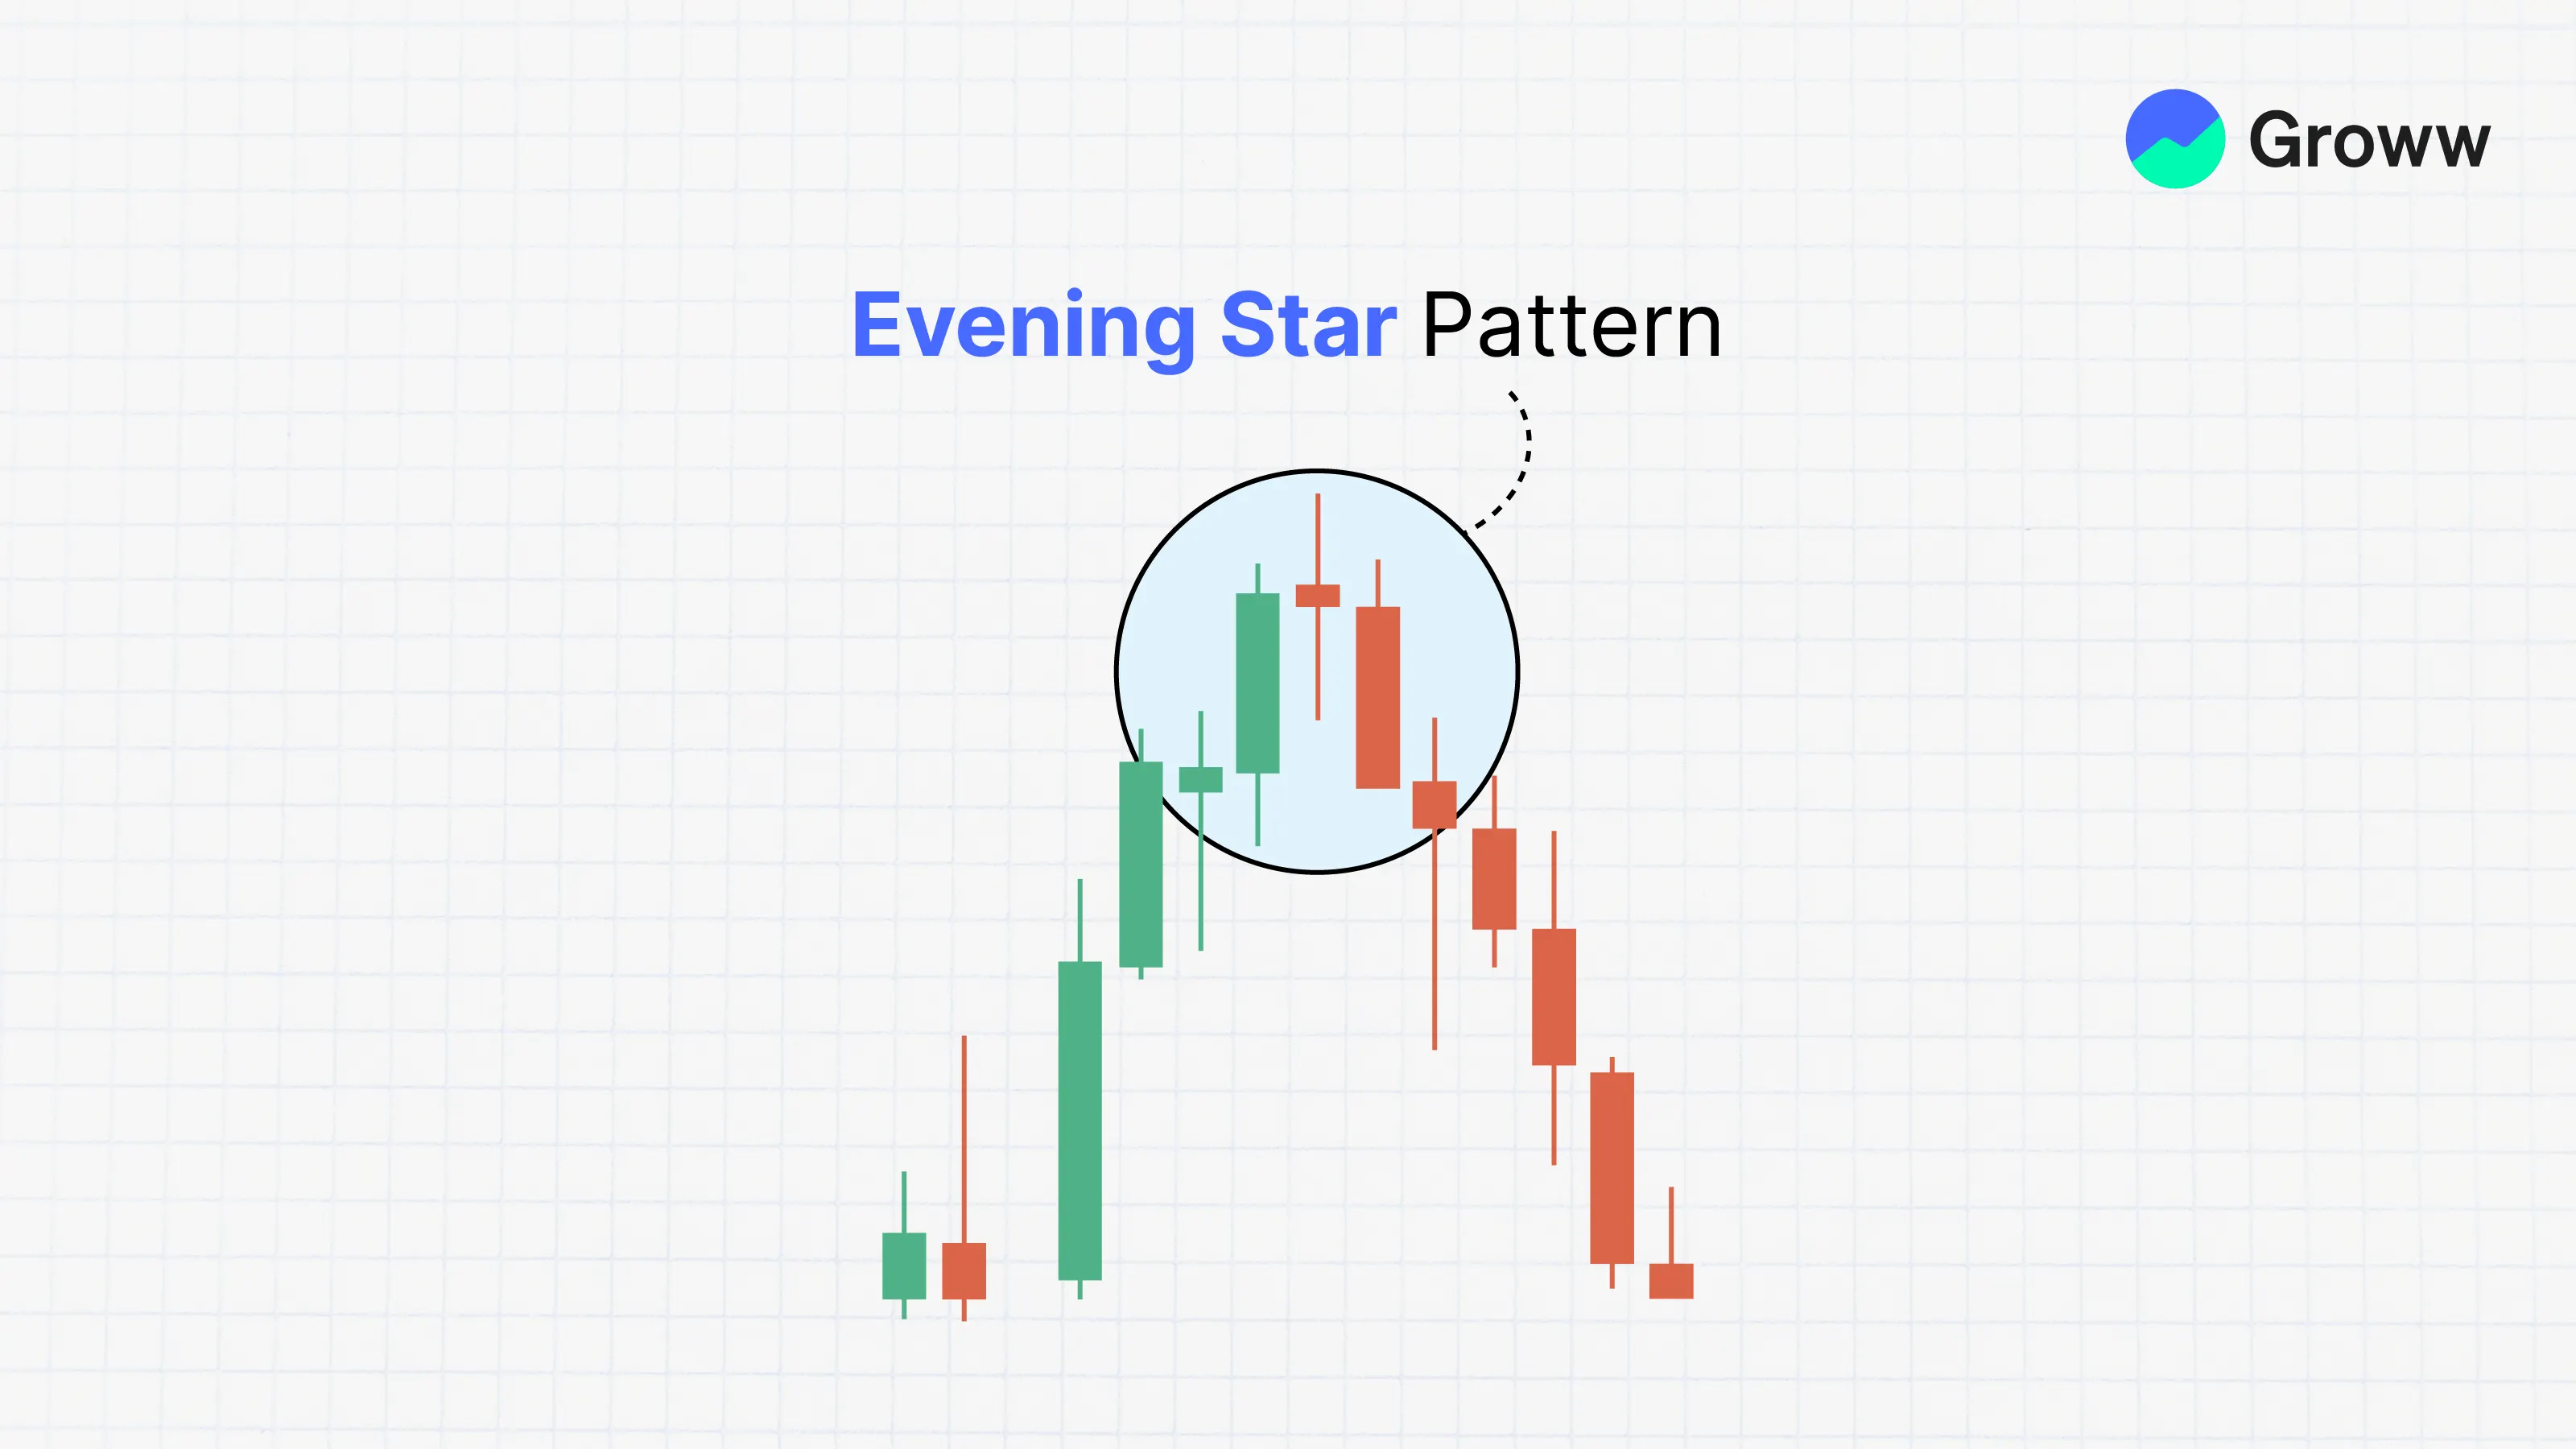
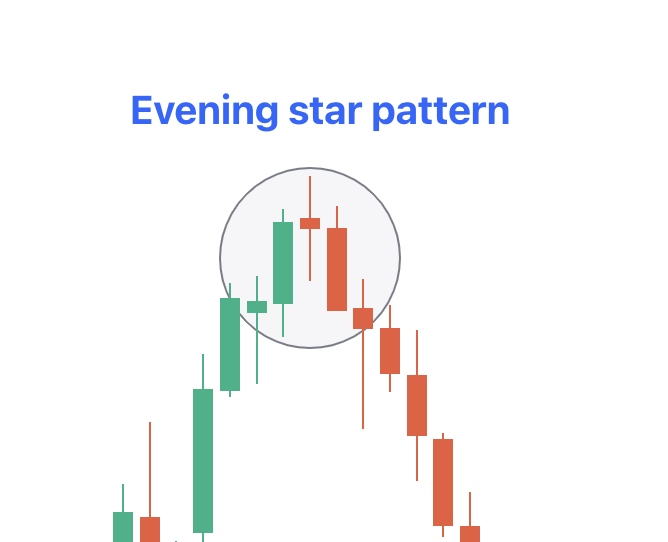
The Evening Star Pattern is used by technical analysts to look for trend reversals. It is a candlestick formation comprising three candles. The pattern looks like a sizable bullish one with a smaller-bodied candle, concluding with a bearish candle.
These patterns come with a peak of an upward price trend, indicating an impending end to the uptrend. The Morning Star pattern shows the inverse scenario, suggesting a bullish reversal.
What does the Evening Star Pattern Indicate?
The Evening Star candlestick pattern comprises three candles, each representing a trading day:
- Significance of the Middle Candlestick: The middle candlestick within the Evening Star is known as the Star. It serves as the initial indicator of weakness in the uptrend. Despite a gap between its real bodies and the preceding candlestick, the inability of buyers to drive prices higher is evident. This weakness is focused on the small real body of the middle candlestick, rendering the colour of the second candlestick unimportant.
- Confirmation of Weakness: The weakness indicated by the Star is confirmed by the next candlestick. This candlestick moves against the uptrend. It is bearish in nature, often characterised by a dark colour. It closes into the body of the first candlestick, further affirming the reversal in momentum.
- Anticipation of Bearish Downtrend: With these signals in place, a bearish downtrend is seen. Bulls who entered the market during the first candlestick are likely to face pressure to close their positions. They will transition to sellers and worsen the bearish reversal pressure.
How to Identify the Evening Star Pattern
To identify the bearish Evening Star candlestick pattern, follow the steps enumerated below:
- An Existing Uptrend: The market should show a series of higher highs and higher lows.
- A Large Bullish Candle (DAY 1): The first candle is bullish. It indicates a strong upward movement in asset prices. Momentum weakens on the second day, often marked by a gap up.
- A Small Bearish/Bullish Candle (DAY 2): The second candle is often small, like a Doji candle. It marks the initial sign of a weakening uptrend. It opens with a gap up, which indicates market indecision.
- A Large Bearish Candle (DAY 3): This candle unveils the onset of fresh selling pressure. In non-forex markets, it opens lower than the previous close. This signals the commencement of a new downtrend.
Advantages and Disadvantages
The advantages and disadvantages of the bearish Evening Star candlestick pattern are:
|
Advantages |
Disadvantages |
|
There is Visual Clarity on Bearish Reversal: This pattern has a clear visual indication of a downturn in price momentum. |
Rare Occurrence Limits Utility: The pattern's infrequent appearance lowers its practicality for frequent use. |
|
There is Assistance in Identifying Selling Opportunities: This pattern assists traders spot potential selling chances or exit points from long positions. |
Risk of False Signals: False signals may be thrown up, risking losses if solely relied on for decision-making. |
|
It Has a Defined Structure for Easy Identification: This pattern offers a structured format with specific candlestick formations. |
Confirmation Prerequisites for Accuracy: This pattern needs confirmation through additional technical indicators or analysis to ensure reliability. |
|
Versatility Across Markets: This pattern is applicable across various timeframes and financial markets, enhancing its versatility. |
Effectiveness Susceptible to Market Variability: The pattern's effectiveness may fluctuate with changing market conditions and trends, requiring careful risk management. |
How to Trade Using the Evening Star Pattern?
Below are the guidelines for trading with the Evening Star candlestick pattern:
- Price Analysis: Check open, close, high, and low prices within a specific chart. Look for the Evening Star chart pattern. It is characterised by two bullish candlesticks, followed by a larger bearish one showing reversal.
- Integration of RSI Indicator: Combine the Relative Strength Index (RSI) with the candlestick pattern to identify overbought market conditions. When the RSI intersects 70 with the Evening Star, it validates a reversal signal, prompting traders to establish exit orders.
- Entering the Market: Identify market entry patterns by recognising the three-candles. Place a sell order beneath the third candle to start a new short position.
- Setting Stop Loss: Position the stop loss above the Evening Star chart to see potential bearish reversals. Place the stop loss above the Doji candlestick to mitigate potential losses.
- Time Frame Change: Transition focus to a shorter time frame after detecting overbought conditions. This change offers precise price levels for setting exit or sell orders. This ensures optimal speed without sacrificing accuracy.
How Accurate is the Evening Star Pattern?
The Evening Star forecasts a bearish reversal with a reliability of about 70%. But the next move after the reversal often results in a modest outcome, with only around a 50% chance of reaching the price target. Thus, relying on this candlestick pattern for trading signals should be done carefully.
Check More Bearish Chart Patterns
|
Bearish Pattern |
Features |
|
It forms when a small bullish candle is followed by a large bearish candle that completely engulfs the previous green candle |
|
|
It is formed when three consecutive long-red candles with small wicks are visible |
|
|
It appears at the top of the uptrend as a single candle with a small body and a long lower shadow |
|
|
It is a reversal strategy which: - Is a single candlestick pattern with a small body, a long upper shadow, and little to no lower shadow |
|
|
It is a two-candlestick pattern that: - Starts with a long bullish candle followed by a Doji (a candle with a very small body) |
|
|
It is a two-candlestick pattern where: - A small bearish candle is completely engulfed within the body of the previous large bullish candle |
|
|
- It consists of two or more candles with matching highs and appears at the top of an uptrend. - The first candle is usually bullish - And the second candle is bearish |
|
|
- It starts with a long bullish candle - Followed by a long bearish candle that opens below the previous candle’s opening price and closes lower |
|
|
It is a three-candlestick pattern that: - Starts with a bullish candle - Followed by a smaller bearish candle that is completely within the first candle - And ends with another bearish candle that closes lower |
|
|
It is a three-candlestick pattern that - Starts with a bullish candle - Followed by a bearish candle that engulfs the first candle - And ends with another bearish candle that closes lower |
|
|
it is a five-candlestick pattern that: - Starts with a long bearish candle - Followed by three smaller bullish candles that stay within the range of the first candle - And ends with another long bearish candle that closes below the first candle |
|
|
It forms a long green candle followed by a red candle that opens above the previous high but closes below the midpoint of the green candle. |
|
|
It is a three-candlestick pattern that - Starts with a long bullish candle - Followed by a Doji that gaps up from the previous candle - And ends with a long bearish candle that gaps down from the Doji. |