Three White Soldiers Pattern

The three white soldiers pattern is a reversal pattern that predicts a change in the direction of a trend. The pattern has three consecutive candles, which will make them less frequent than some other candlestick patterns.
Learn more about this pattern, how to spot it, and what actions to take here in detail.
What is the Three White Soldiers Candle Pattern?
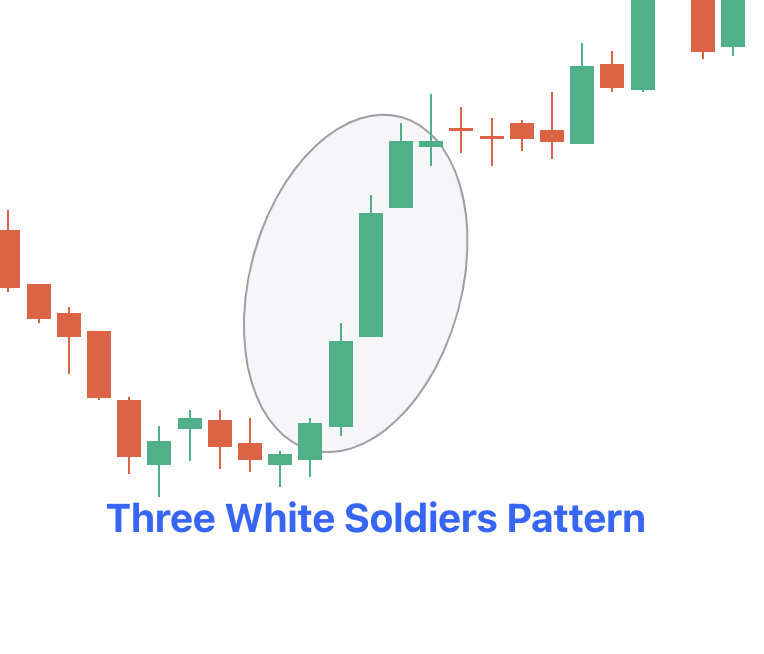
The three white soldiers candlestick pattern is used to estimate the reversal of the current downtrend on the pricing charts. The pattern has three consecutive long-bodied candlesticks that open within the older candle's real body and close to the point where it crosses the previous candle's height.
These candlesticks do not need very long shadows and are ideally open within the real body of the preceding candle in the same pattern.
How to Spot a Three White Soldiers Pattern
The Three White Soldiers Pattern is bullish and reversal in nature. It occurs in the event of a strong downtrend and an estimated change in direction. The formation will have three consecutive bullish candles, and each will close higher than the previous candle.
Since it will have three candles, the pattern will almost confirm that a reversal is taking place, thanks to the bullish force behind the creation of this pattern.
Check Here to know How to Read Candlestick Charts.
What Does the Three White Soldiers Candlestick Pattern Indicate?
The three white soldiers candlestick pattern is usually seen as a reversal indicator, and it often appears after a period of price fall. This chart pattern suggests a strong move in market sentiments in terms of the stock or commodity, making up the price action on the chart.
When a bullish candle closes with a small or no shadow, it indicates that the bulls have kept the price at the top of the range for the session.
The bulls take over the rally in all such sessions and close near the high of the day for three consecutive sessions. In addition, the pattern is preceded by other candlestick patterns, suggesting a reversal.
Importance of Colour in the Three White Soldiers Pattern
The colour of this pattern is crucial, as it indicates the strength of the bullish momentum in the market. Every candlestick will represent a bullish candle, which means the closing price is greater than the opening price.
The colour of the candlesticks is either white or green, based on the charting software used.
The colour of the three white soldiers candlestick pattern does not impact the interpretation of the pattern itself. Some traders, however, choose to use a green colour to show the bullish candles, as it is a more intuitive colour to indicate bullishness.
Limitations of Three White Soldiers Pattern
Three white troops occasionally emerge during consolidation, which is an easy way to get caught up in the process. One should also check to see if the volume supports the creation of three white troops.
To overcome the drawbacks of visual patterns, traders can combine the three white soldiers candlestick pattern with additional technical indicators like trendlines, moving averages, and Bollinger bands.
Check More Bullish Candlestick Patterns
|
Bullish Pattern |
Features |
|
A reversal pattern which consists of: - A small bearish candle followed by a - Larger bullish candle. |
|
|
A reversal pattern which consists of: - A small body candle, and - Long lower shadow/wick |
|
|
A reversal pattern which consists of: - It starts with a long bearish candle - Followed by a small-bodied candle (either bullish or bearish) - And ends with a long bullish candle. |
|
|
- A strong bearish candle followed by a bullish candle. - Second candle opens below the previous candle's close but closes above the midpoint (50%) of the previous bearish candle. |
|
|
- It is is a two-candlestick pattern that signals a possible upward trend reversal. - Small bullish candle is completely contained within the body of the previous large bearish candle. |
|
|
A reversal pattern which: - Appears at the bottom of a downtrend - A small body with a long upper shadow and little to no lower shadow. |
|
|
A reversal pattern which consists of: - A single candlestick pattern - A very small body and a long lower shadow that appears at the bottom of a downtrend |
|
|
- It consists of a long bearish candle - Followed by a doji candle that gaps down - And then a long bullish candle that gaps up. |
|
|
A three candlestick pattern with: - A large bearish candle, - A small bullish candle that closes above the 50% level of the first candle and - A third bullish candle that closes above the first candle's open. |
|
|
Starts with a bearish candle - Followed by a bullish candle that engulfs the first candle - Ends with another bullish candle that closes higher. |
|
|
- Starts with a long bearish candle - Followed by an even longer bullish candlestick. The candle opens higher than the previous day's closing price and rises even more. |
|
|
A two-candlestick pattern that includes: - Two equal-sized bullish and bearish candles. |
|
|
It consists of five candles in a continuation pattern - A long bullish candle - Three small bearish candles that trade above the low and below the high of the first candlestick - And another long bullish candle that closes above the high of the first candlestick. |
|
|
It is similar to the rising three methods pattern consisting of five candles - It starts with a long bullish candle - Followed by three small bearish candles (a smaller bearish candles that move lower) that stay within the range of the first candle - And end with another long bullish candle that closes above the high of the first candle. |