Marubozu Candlestick Pattern
The Marubozu candlestick pattern, derived from the Japanese term 'Marubozu,' represents one candlestick devoid of shadows, signalling high market pressure. It comes in two forms - bullish and bearish. The pattern indicates different market sentiments. Understanding its fundamental features, like the absence of wicks and its depiction of buying or selling, is very important.
This article dwells on the different types, advantages, and disadvantages of Marubozu candles. It gives traders the power to improve strategies and risk management.
What is Marubozu Candle and Candlestick Pattern
As said earlier, the name of this candlestick pattern is taken from the Japanese term 'Marubozu', meaning 'bald'; the Marubozu pattern is shown by a single candle. Traders can define the standard Marubozu as a candle devoid of any shadows, unlike most other candlestick patterns.
It usually has a prominent 'real body'. This pattern is divided into two forms: the Bullish Marubozu Candle and the Bearish Marubozu Candle.
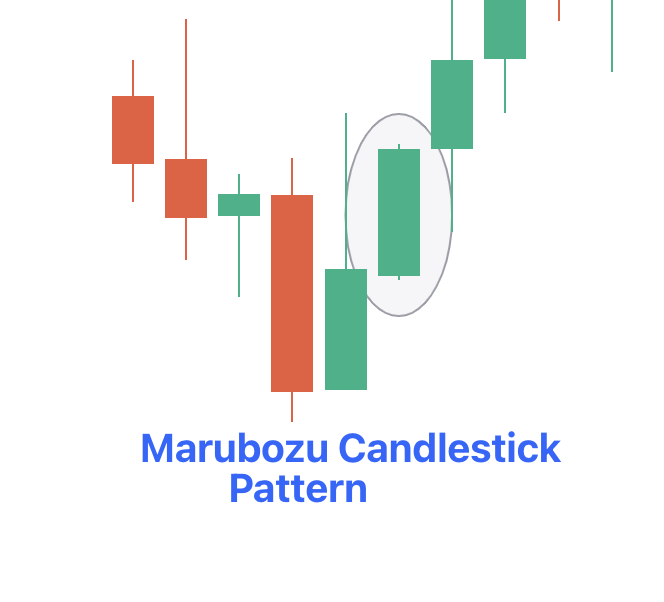
- Bullish Marubozu Candlestick Pattern - The Bullish Marubozu shows strong buying activity, opening at its low and closing at its high, with no upper or lower wicks.
- Bearish Marubozu Candlestick Pattern - The Bearish Marubozu also known as Black Marubou Candlestick Pattern indicates dominant selling pressure, opening at its high and closing at its low, again without wicks.
These candles show minimal or no wicks, resembling a "shaved" appearance; that’s why the name. These patterns are robust indicators of potential trend reversals or continuations, depending on their presence on the trading chart.
Features of Marubozu Candlestick Pattern
Identifying the Marubozu Candlestick is very simple compared to other trends. Yet it's important to keep in mind the following fundamental characteristics:
- Absence of Wicks or Short Wicks: The candlestick shows either no wicks or very short ones.
- A Notably Large Real Body: This candlestick is seen as a real body, highlighting substantial price movements within the given period.
- Absence of Shadows: This candlestick portrays no shadows at either end, which further indicates strong market sentiment and a clear price direction with no conflicting signals.
- Strong Buying or Selling Activity Indication: This pattern indicates great buying or selling activity.
Types of Marubozu Candles
There are 3 different types of Marubozu trading patterns –
- Marubozu Full - The Full Marubozu pattern has a candle devoid of any wicks or shadows, indicating that the closing price equals the highest price for the specified time, while the opening price equals the lowest price.
- Marubozu Close - The Marubozu Close candle pattern shows us a candle without an upper wick and a very short lower or upper wick. This says that the price traded slightly below the opening price or higher than it for a bearish Marubozu candlestick, with the closing price remaining flat.
- Marubozu Open - The Marubozu open candle features a candlestick with a brief wick higher or below the closing price, and this indicates a level opening price. This candle begins moving in a specific direction instantly after the opening time.
Advantages and Disadvantages
The advantages and disadvantages of the Marubozu Candlestick Pattern are:
|
Advantages |
Disadvantages |
|
Indicates a Clear Trend: Marubozu candlesticks tell us strongly of market trends, with bullish ones indicating uptrends and bearish ones signalling downtrends, making trend identification straightforward. |
Offers Limited Information: Marubozu candles only reveal opening and closing prices; they do not have data on daily highs and lows. This hampers traders' ability to make well-rounded judgments. |
|
Easy to Identify: Marubozu trading patterns are easy to spot because of their distinct appearance as single candles without any wicks or shadows. These are easily recognised even by novice traders. |
Limited Applicability: Marubozu patterns are effective primarily in markets with clear, consistent trends, limiting their usefulness in volatile or range-bound conditions where they fail to provide meaningful insights. |
|
Clarity of Trends: The absence of wicks or shadows on Marubozu candlesticks eliminates the ambiguity regarding opening and closing prices, aiding traders in making well-informed decisions with confidence. |
Risky to Depend Too Much on It: Overusing Marubozu candles may lead traders to overlook important market signals, emphasising the importance of incorporating diverse chart patterns and indicators for informed decision-making. |
|
Indicates Reliable Price Action: Marubozu stock patterns can be a dependable indicator of price action, offering clear insights into trend direction and market strength, thus enhancing the reliability of the trading decisions made. |
Misinterpretation Risk: New traders might view Marubozu patterns as foolproof signals, potentially prompting hasty trades without considering broader market factors. Caution and supplementary analysis are essential to avoid losses. |
How to Trade Using Marubozu Trading Pattern?
Marubozu candlesticks offer great advantages for traders, both for short-term and long-term trading goals. Here are some key trading points you need to know:
- When trading with Marubozu candlesticks, you need to confirm the strength of the trend. A bullish Marubozu appearing in an uptrend signals high buying momentum, indicating a potential continuation of the trend. Conversely, a bearish Marubozu observed in a downtrend confirms prolonged selling pressure in the market.
- Pay attention to the high and low points of Marubozu candlesticks, as they can serve as significant resistance and support levels for future trading decisions. These levels provide valuable insights into potential price moves and can guide traders in establishing effective entry and exit points.
- Keep an eye out for potential trend reversals indicated by Marubozu candlesticks. A bearish Marubozu observed at the peak of an uptrend or a bullish Marubozu at the bottom of a downtrend may signal an impending reversal in market direction. Identifying these reversal patterns could possibly help you adjust your strategies according to new market trends.
- Confirm Marubozu signals with volume analysis. Increased trading volume with Marubozu candlesticks strengthens their validity and provides more confidence in the observed market sentiment.
How Reliable is the Marubozu Candlestick Pattern?
The Marubozu candlestick is regarded as one of the most reliable candlestick formations in technical analysis. It serves as a good intraday chart pattern, often employed to ascertain whether a buyer or seller dominates the market. Its efficacy may fluctuate depending on prevailing market conditions.
The Marubozu candlestick pattern is a powerful tool in technical analysis, offering clear insights into market sentiment and direction. Its varied features make it simple to identify, which offers traders valuable trading dynamics. Despite its perks, such as clear trend indication and ease of identification, traders should also be aware of its limitations, including the lack of overall information and limited applicability in some market conditions.