Morning Star Pattern
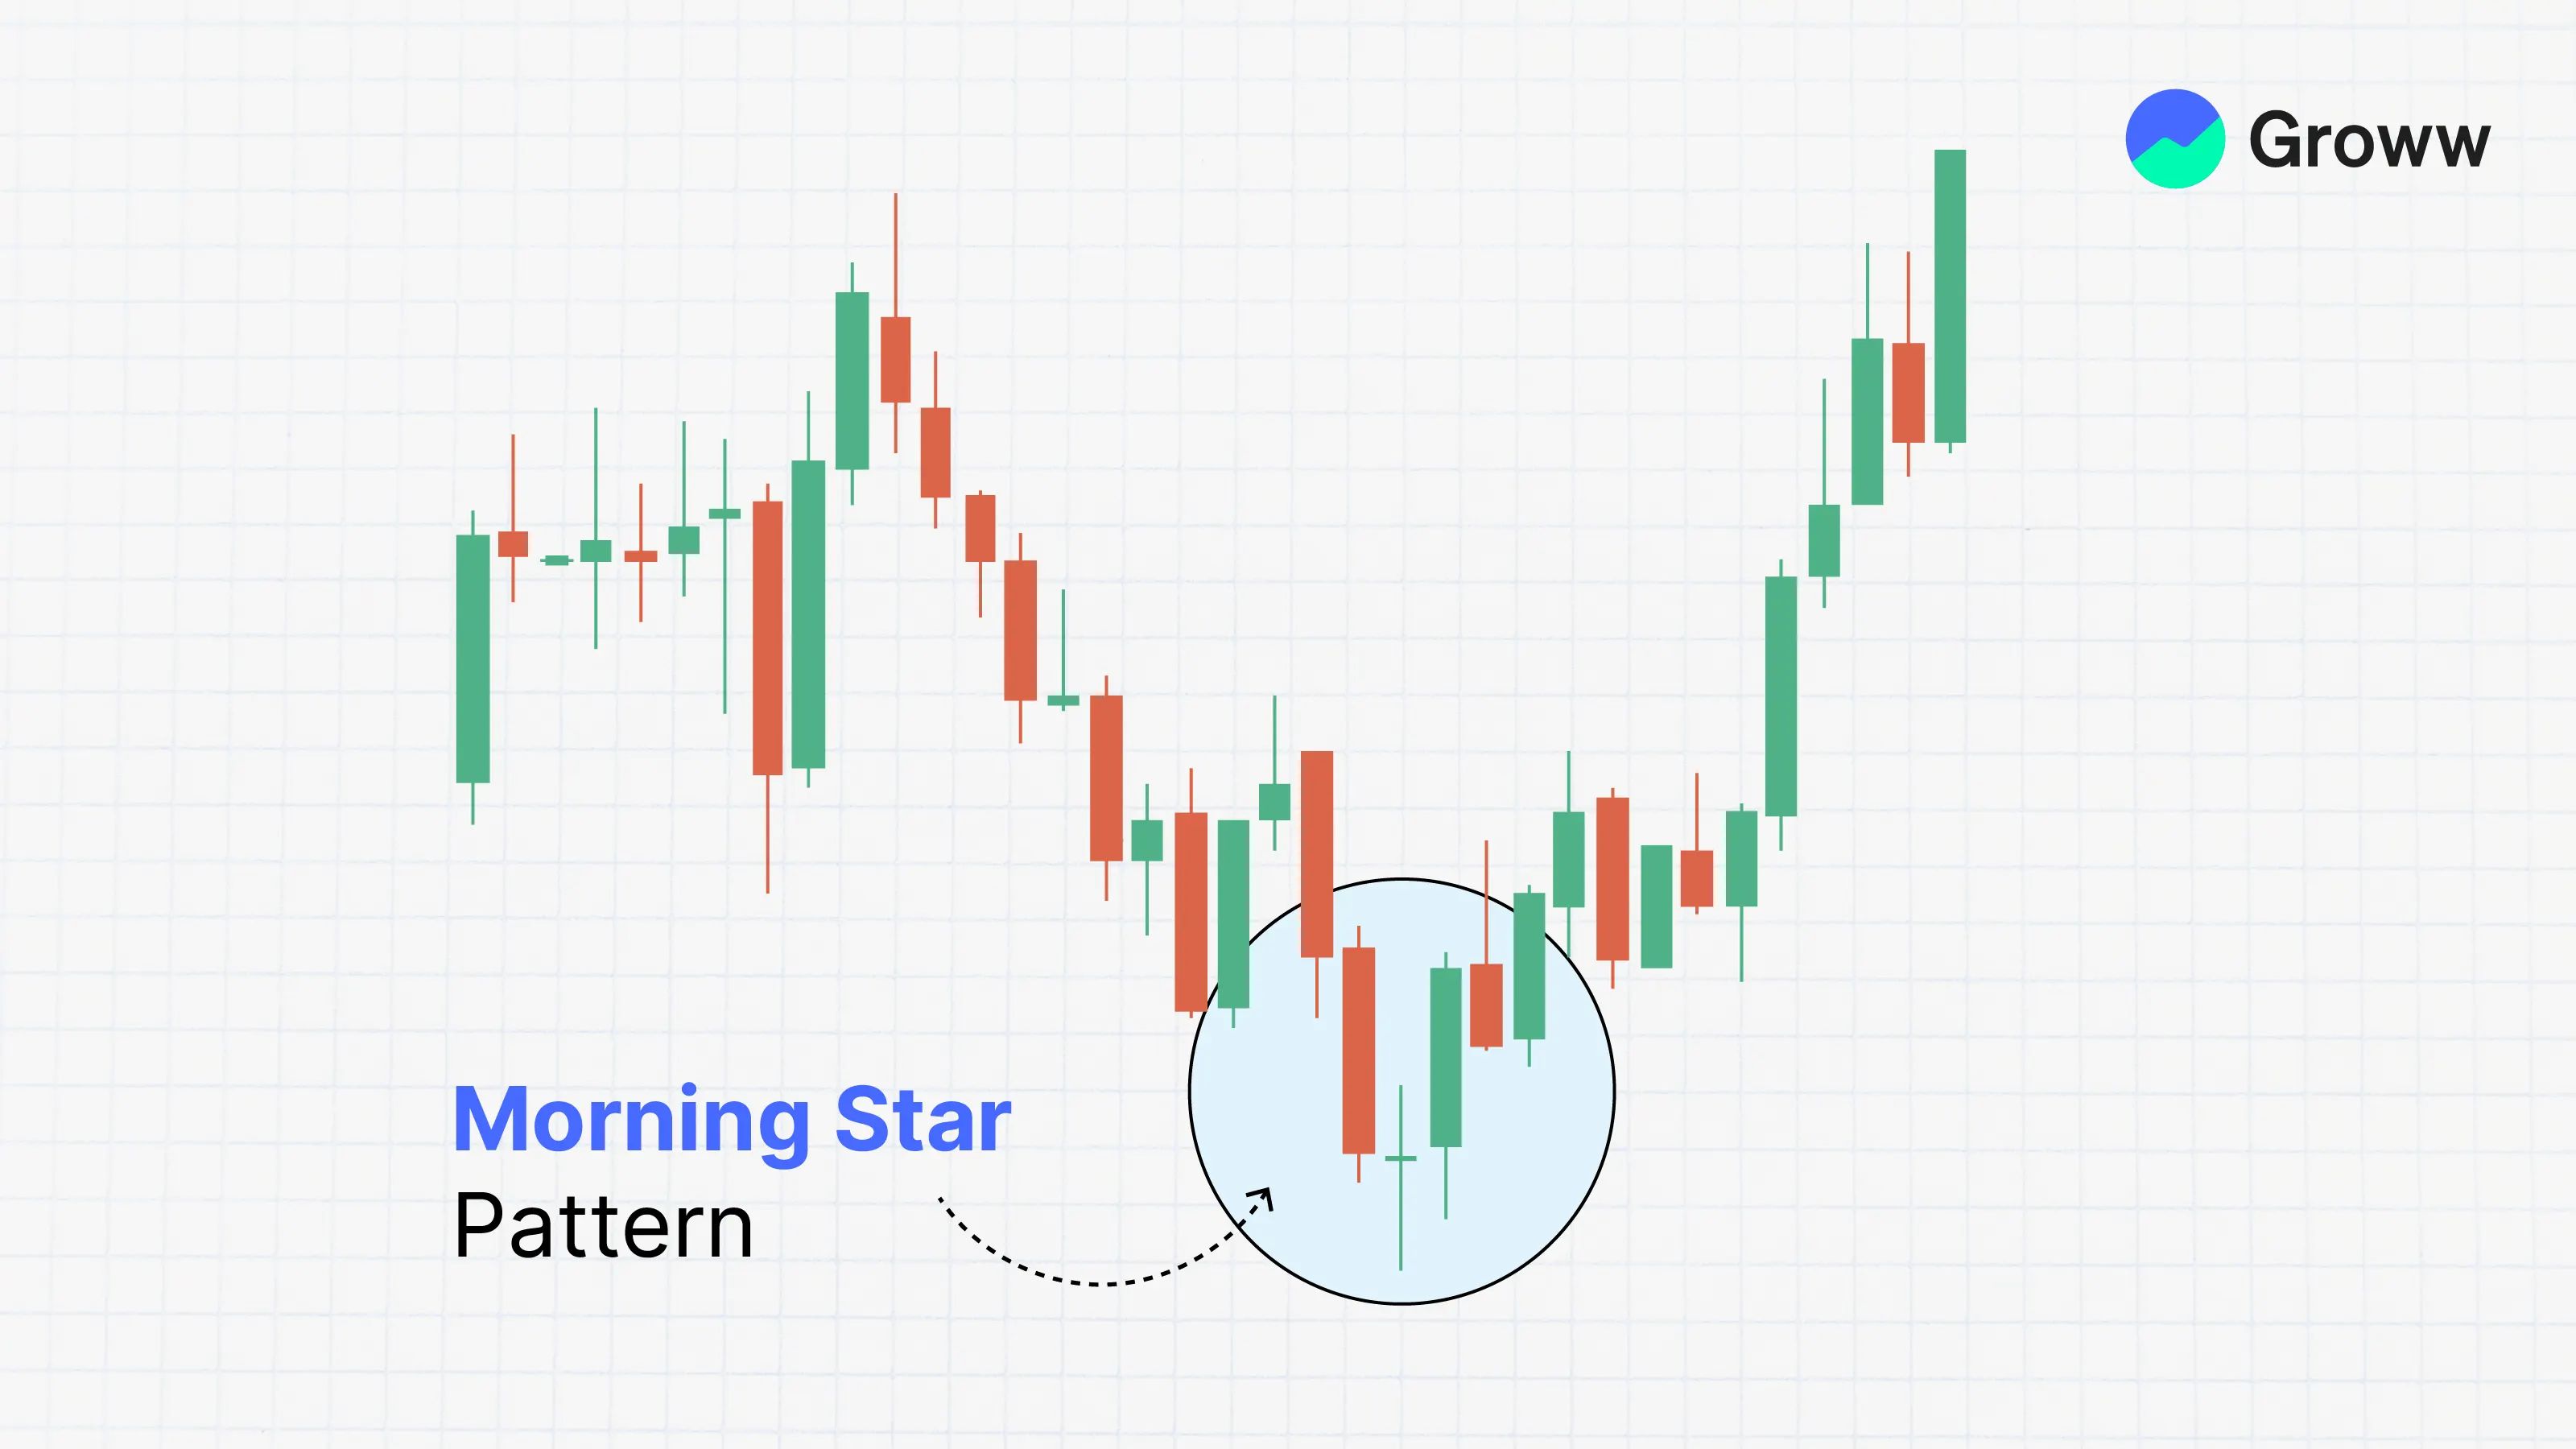
A Morning Star Candlestick patterns is a bullish visual pattern in technical analysis with three candlesticks. It typically forms after a downward trend, telling us it is the start of an upward climb and indicating a reversal in the previous price trend.
Traders can examine this formation of a morning star and use additional indicators to confirm the occurrence of the reversal.
Here, we look at the Morning Star Pattern to gain a comprehensive understanding of its significance.
Check Here to know How to Read Candlestick Charts.
Pattern Structure and Components
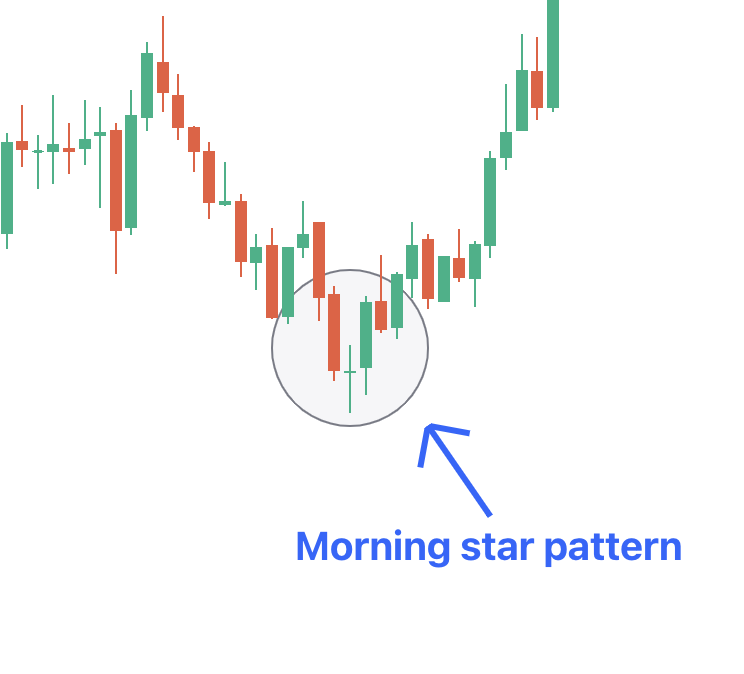
Here is how the morning star pattern looks like:
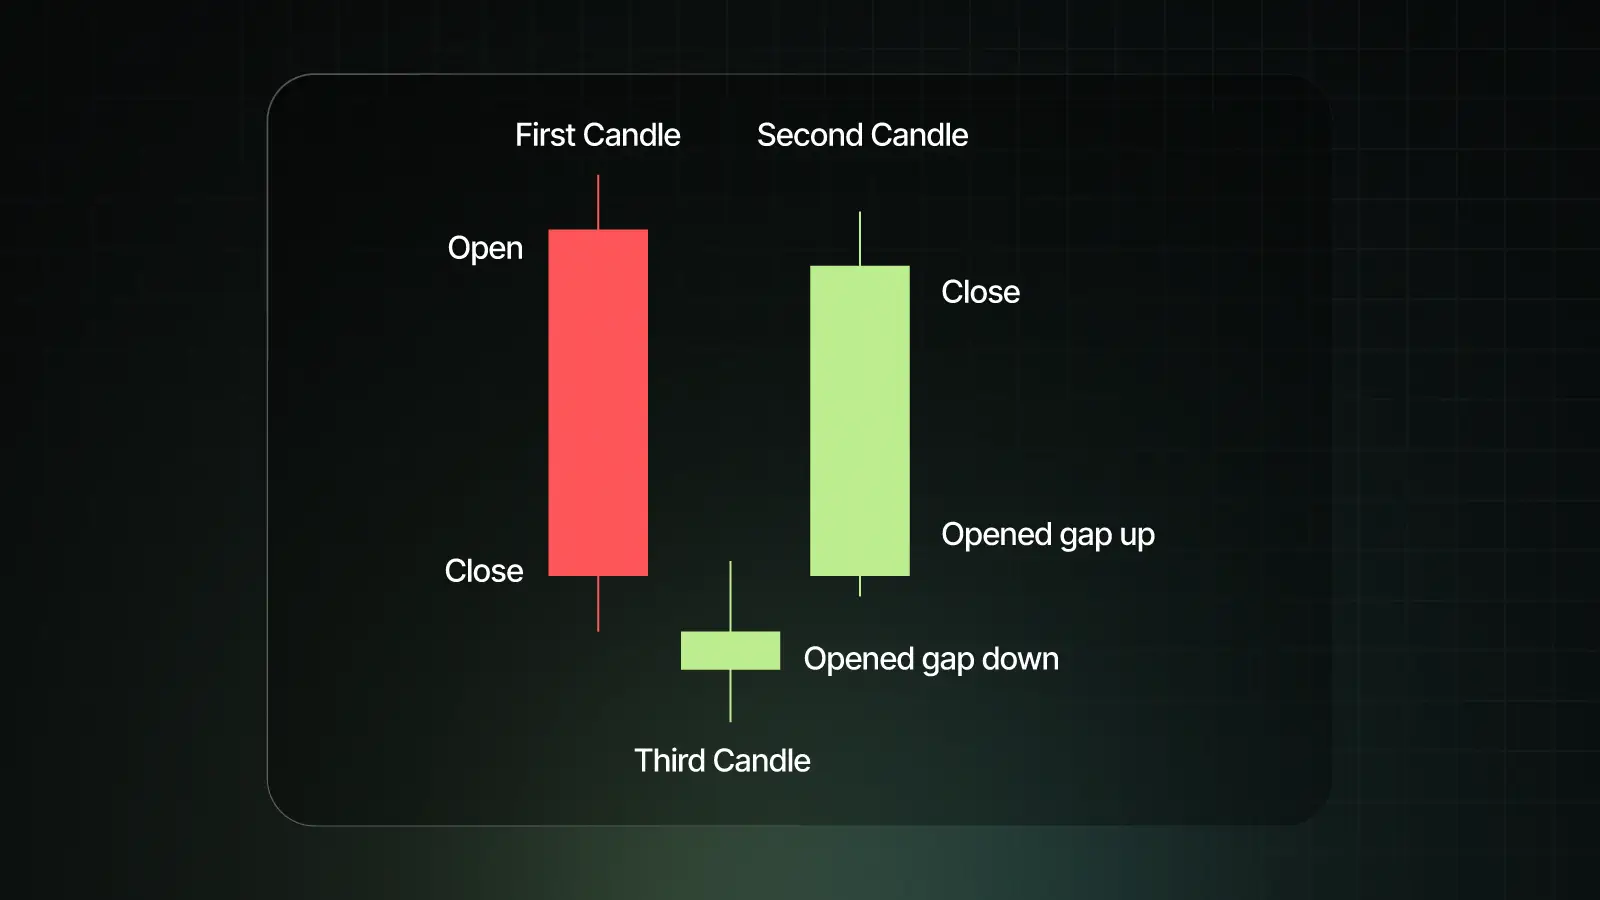
The pattern consists of three candles:
- First candle: This is a long bearish candle, which signifies strong selling. It is important to note that this is the continuation of the downtrend that has been there in the markets.
- Second candle: The next candle is a small body candle. This candle usually is gapped down. So the opening price of second candle is lower than the closing price of the first candle. The candle color is not given much importance. This candle can be a bullish, bearish or a neutral doji candle. Because of the small body of the candle, this is usually an indecisive candle
- Third candle: This is a strong bullish candle closing above midpoint of first candle. This is gapped up candle, that is, the opening price of this candle is above the closing price of second candle. The body is significantly large of this candle.
What Does Morning Star Pattern Indicate?
The Morning Star Candlestick Pattern offers insights into potential market reversals. In a bearish trend, traders can predict further downward movements. The formation of the first candle maintains this sentiment, followed by a second candle, suggesting another bearish day.
The Morning Star pattern indicates a potential bullish reversal after a downtrend. It reflects a shift from bearish to bullish sentiment, with increased buying pressure overcoming the previous selling pressure. This pattern assists the traders estimate a potential upward movement in the market.
Identifying the Morning Star Candlestick Pattern
Key characteristics of the bullish Morning Star chart pattern:
- Bearish Candle: The first candle is a bearish candle, longer than the other two candles.
- Downtrend: The pattern occurs after a prolonged downward move.
- Bullish Candle: The third candle is bullish, confirming the reversal.
- Small-bodied Candle: The second candle is a small-bodied candle, indicating indecision.
Ideal Conditions for Reliability
Like with all the candlestick patterns, there are some idea conditions that makes Morning Star much more potent. Here are some idea conditions for it be a great reversal pattern:
- It works best after a prolonged downtrend.
- The best results are fund when there are higher volume on the third candle.
- The candle accuracy and reliability increases on daily/weekly charts than smaller timeframes.
- It should be validated with support zones or oversold conditions.
How to Trade Using Morning Star
Morning Star pattern is traded after the three candles have completely formed. Usually, the entry happens when the high of the third candle is broken. The usual stoploss is slightly below the low of the second candle. The target can be placed in different ways. Either, the trader can do a risk to reward of 1:2 . So, if the risk is 10 points (entry price – stoploss price), then the potential target can be 20 points. Another way to place a target is at next resistance level.
Examples from Historical Charts
Let us take an example to show how Morning Star pattern works. In this example, we will see what can be the potential entry and exits after using the pattern. Below is the daily chart of ZYDUSLIFE.
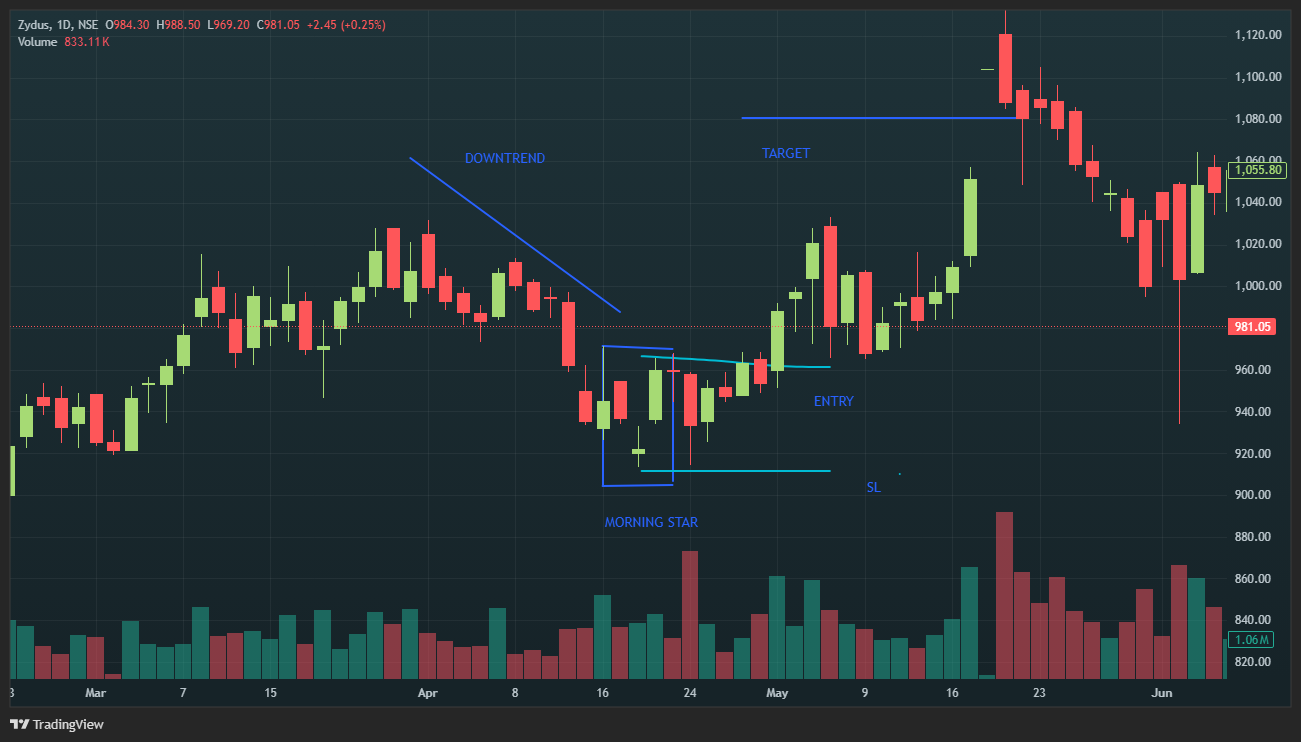
There was a clear downtrend for several days and then there was a red candle in continuation to the downward trend. The next day there was a spinning top after a gap down. And next day, the market gapped up convincingly and made a green candle. This was the completion of the Morning Star pattern. Traders could have taken the Buy trade the next day once the high of the third candle was broken. The stoploss would have been the low of the middle candle. We can see from the chart that the market did come done, but it did not hit the stoploss. And then market went up hitting the target of 1:2 risk to reward.
Advantages and Disadvantages of Morning Star Chart Pattern
The advantages and disadvantages of the Morning Star pattern are as follows:
|
Advantages |
Disadvantages |
|
Confirms with Other Indicators: Traders can rely on this pattern by correlating it with other technical indicators or chart patterns. This provides more confirmation of the reversal signal. |
Interpretation Plays Key Role: There could be subjectivity in interpreting the Morning Star chart pattern to identify the specific characteristics of each candlestick. This may vary depending on the perspective of individual traders. |
|
It is User-Friendly: This chart pattern is easy to recognise. This makes it accessible to traders of all experience levels. |
Can Give False Signals: Like any trading pattern, the Morning Star is not foolproof and can sometimes generate false signals. |
|
Versatility: The Morning Star chart pattern is not limited to specific markets and can be applied across various financial instruments, including stocks, forex, commodities, and cryptocurrencies. |
Limited Application for Short-Term Trades: While effective for identifying medium to long-term trend reversals, the Morning Star chart pattern may have limited applicability to short-term trades. This requires traders to consider more factors for intraday or short-term trading strategies. |
|
Reversal Signal: The Morning Star chart pattern serves as a reliable signal, indicating a potential reversal from a downtrend to an uptrend, allowing traders to capitalise on the upward movement. |
Market Conditions: The effectiveness of the Morning Star chart pattern can be influenced by the prevailing market conditions, such as volatility and liquidity, which may impact its reliability in certain situations. |
How to Trade Using the Morning Star Pattern?
Morning Star patterns are visual indicators of a potential reversal from a bearish to a bullish trend, especially when complemented with other technical indicators. Volume is important in pattern formation, with traders preferring to notice increasing volumes across the three sessions, peaking on the third day. High volume on the third day often validates the pattern, signalling an uptrend. Traders enter bullish positions when the Morning Star appears during the third session, riding the uptrend until signs of another reversal appear.
Below are some effective strategies for trading the Morning Star pattern:
Stop-Loss Placement
Safeguard your investment by positioning a stop-loss order at the bottom of the pattern. This level functions as a support level. A breach suggests the potential reversal might be invalid. Setting a stop-loss here can spread potential losses if the trade does not work out.
Entry Points
Recognise the Morning Star candlestick pattern following an extended downtrend. Start with a bearish first candle that indicates selling pressure and a small-bodied candle signaling market indecision. Confirm the potential reversal with a bullish candle, and enter the trade at the opening of the next candle.
Profit Targets
Identify the low of the first candle, and the high of the third candle in the morning star pattern. Measure the distance between the two points. From the breakout point project the measured distance upward. This projection will give you the potential profit target.
Risk Management
Install effective risk management strategies to protect your capital. Decide on an appropriate risk-reward ratio for each trade. Make sure that potential losses are lower while allowing for profit potential. Review and adjust risk management parameters based on evolving market conditions and trade performance.
How Accurate is the Morning Star Pattern?
Usually, this pattern is dependable, especially when combined with other technical indicators and thorough asset analysis. Its reliability makes it a valuable tool for traders of all levels. This provides clarity and confidence in the decision-making processes across various market conditions. Though the candlestick pattern is a potent tool, it's essential to acknowledge that no pattern guarantees 100% accuracy. So, it's advisable to use these patterns alongwith other technical indicators to enhance the robustness of trading strategies and decisions.
Check More Bullish Candlestick Patterns
|
Bullish Pattern |
Features |
|
A reversal pattern which consists of: - A small bearish candle followed by a - Larger bullish candle. |
|
|
A reversal pattern which consists of: - A small body candle, and - Long lower shadow/wick |
|
|
- A strong bearish candle followed by a bullish candle. - Second candle opens below the previous candle's close but closes above the midpoint (50%) of the previous bearish candle. |
|
|
- It is is a two-candlestick pattern that signals a possible upward trend reversal. - Small bullish candle is completely contained within the body of the previous large bearish candle. |
|
|
- It consists of three long bullish candles with small wicks that appear consecutively one after another. - Each new candle opens inside the previous one’s body and closes higher than the last. |
|
|
A reversal pattern which: - Appears at the bottom of a downtrend - A small body with a long upper shadow and little to no lower shadow. |
|
|
A reversal pattern which consists of: - A single candlestick pattern - A very small body and a long lower shadow that appears at the bottom of a downtrend |
|
|
- It consists of a long bearish candle - Followed by a doji candle that gaps down - And then a long bullish candle that gaps up. |
|
|
A three candlestick pattern with: - A large bearish candle, - A small bullish candle that closes above the 50% level of the first candle and - A third bullish candle that closes above the first candle's open. |
|
|
Starts with a bearish candle - Followed by a bullish candle that engulfs the first candle - Ends with another bullish candle that closes higher. |
|
|
- Starts with a long bearish candle - Followed by an even longer bullish candlestick. The candle opens higher than the previous day's closing price and rises even more. |
|
|
A two-candlestick pattern that includes: - Two equal-sized bullish and bearish candles. |
|
|
It consists of five candles in a continuation pattern - A long bullish candle - Three small bearish candles that trade above the low and below the high of the first candlestick - And another long bullish candle that closes above the high of the first candlestick. |
|
|
It is similar to the rising three methods pattern consisting of five candles - It starts with a long bullish candle - Followed by three small bearish candles (a smaller bearish candles that move lower) that stay within the range of the first candle - And end with another long bullish candle that closes above the high of the first candle. |
Complementary Indicators
Morning Star pattern can be a good potential when combined with other indicators. Here are some ways, other indicators can be used along with Morning Star pattern:
|
Indicator |
How It Helps with Morning Star |
Confirmation Signal |
|
RSI (Relative Strength Index) |
RSI tells whether the market is overbought or oversold |
RSI going from below to above 30 signals that uptrend is starting |
|
MACD (Moving Average Convergence Divergence) |
MACD can help in determining sentiment shift |
MACD bullish crossover gives double confirmation |
|
Volume |
Volume tells the strength of the move |
The volume of the third candle is important and should be highest among the three candles for double confirmation |
|
Support/Resistance Zones |
The zones help in finding strong reversal areas |
Morning Star near major support is more trustworthy |
|
Moving Averages (50/200 EMA) |
Confirms overall trend direction |
If the morning star Pattern is formed at moving average, this is a particularly strong reversal signal |
Conclusion
Morning Star is a reliable bullish reversal pattern consisting of triple candles. The pattern works well when the market has been in the prior downtrend, the entry comes near support level and high volumes are observed during the entry. The pattern becomes more potent when it is combined with other indicators. However, always remember that not all trades taken using this pattern will be profitable and hence risk management is super important.