Three Inside Up Candlestick Pattern
The three inside up candlestick pattern chart is a bullish or bearish indicator that offers valuable insights for traders on trend reversals. It is a pattern that is created by a sequel of candles. It indicates a shift in the balance between buyers and sellers.
It is essential for a trader to understand this pattern. We discuss it in detail here.
What is Three Inside Up Candlestick Pattern?
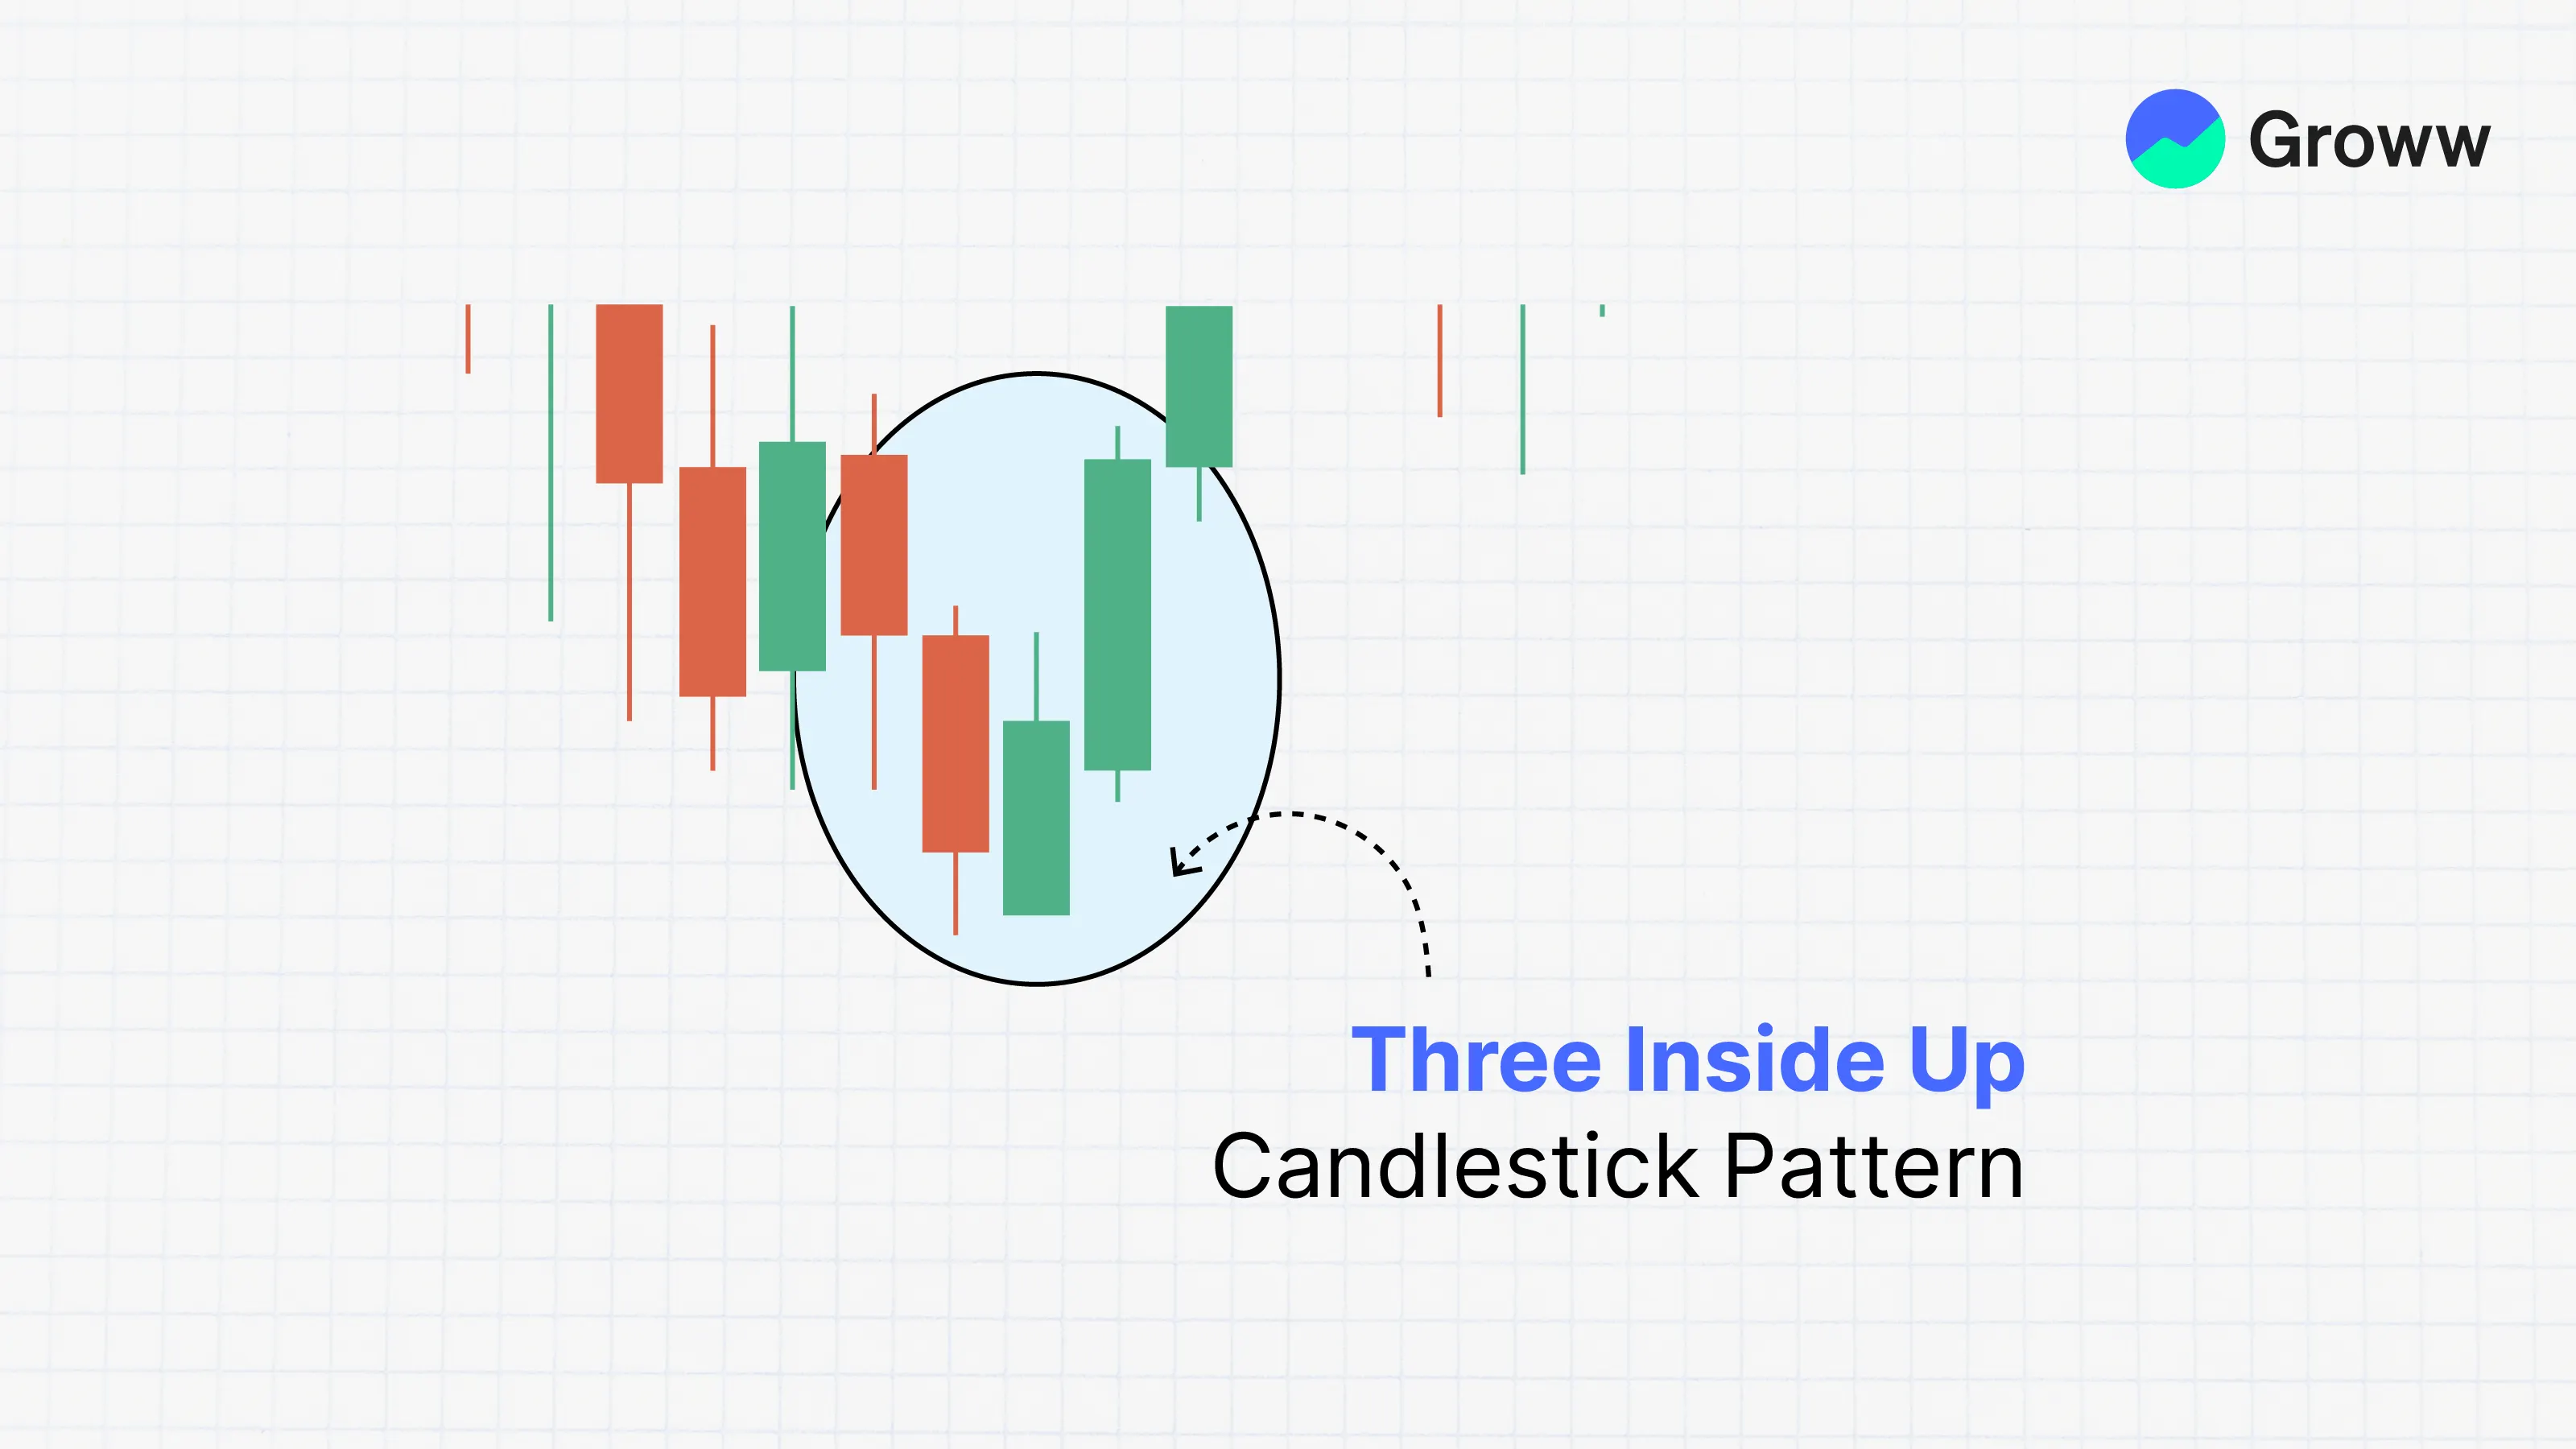
The three Inside Up candlestick patterns are indicator patterns. The three Inside Up patterns indicate a market trend reversal. The three insides represent a negative to positive trend in the market. The three Inside Up patterns indicate that the decline in the market has lost pace and that the bulls will soon regain control of the market. The three-sided pattern is made up of three candlesticks, and it is regarded as complete when the candlesticks appear in a precise pattern.
The three inside candlestick patterns are created when the seller has exhausted his selling power to give back the bulls. A triple candlestick pattern is seen at the end of a downtrend, and the pattern would begin with a bearish candlestick with a large body.
This candlestick will say there is a closing price one over the other. The higher highs and the higher lows that follow the bearish candlestick show the sellers have booked their profits and got out while the buyers have begun to place a long position in the market.
Check Here to know How to Read Candlestick Charts.
How is the Three Inside Up Candle Pattern Formed?
- The initial bearish candlestick in the three inside up pattern will show the sellers making an exit from the security. The sellers have begun losing their dominance, and the buyers will take over.
- The second stick of the pattern indicates a slow emergence of bulls.
- The third candlestick is bullish in nature, and it needs to have an opening halfway above the body of the first bearish candlestick.
How to Trade the Three Inside Up Chart Patterns?
In order to trade this pattern, the trader needs to wait for confirmation signals before making a move. Confirmation could come in the form of additional candlestick patterns, trendline breaks, or even support and resistance. It is important to consider the entire market context and utilise other technical analysis tools to enhance the accuracy of the trading decision.
Some traders would prefer to wait for the entire third candle to form to confirm the pattern's validity. Other traders would enter into partial positions during the formation of the pattern and add to their positions once the confirmation signals come up.
Risk management strategies, such as setting stop loss and profit targets, need to be employed to manage potential risks and maximise profits.
Conditions of Formation for the Three Inside Up Pattern
Certain parameters must be met to form the three inside up/down patterns. The pattern should follow a clear and established trend, showing a shift in market sentiments. The second candle should be smaller and within the range of the first candle, indicating a stop in the current trend. The third flame must be strong enough to swallow the previous two candles, suggesting a possible reversal.
It is crucial to highlight that while the Three Inside Up/Down patterns might give useful insights, they should not be seen in isolation. Traders should combine them into a larger trading strategy, including other technical indicators, risk management approaches, and market analysis.
Merits and Demerits of Three Inside-Up Candlestick Pattern
The table below charts the pros and cons of this pattern:
|
Merits |
Demerits |
|
The three inside up pattern is seen frequently in the stock market. Traders who are familiar with candlestick patterns may quickly spot and capitalise on the three Inside Up formations. |
The pattern has a propensity to break apart in the middle of its creation. This break in the pattern results in unclear situations. |
|
The three Inside Up patterns can be used to forecast the intensity of a trend reversal. The development of the third candlestick in the three Inside Up patterns indicates strength. |
The three Inside Up patterns occur at the end of a downtrend, but traders do not recognise them until it is too late. |
Check More Bullish Candlestick Patterns
|
Bullish Pattern |
Features |
|
A reversal pattern which consists of: - A small bearish candle followed by a - Larger bullish candle. |
|
|
A reversal pattern which consists of: - A small body candle, and - Long lower shadow/wick |
|
|
A reversal pattern which consists of: - It starts with a long bearish candle - Followed by a small-bodied candle (either bullish or bearish) - And ends with a long bullish candle. |
|
|
- A strong bearish candle followed by a bullish candle. - Second candle opens below the previous candle's close but closes above the midpoint (50%) of the previous bearish candle. |
|
|
- It is is a two-candlestick pattern that signals a possible upward trend reversal. - Small bullish candle is completely contained within the body of the previous large bearish candle. |
|
|
- It consists of three long bullish candles with small wicks that appear consecutively one after another. - Each new candle opens inside the previous one’s body and closes higher than the last. |
|
|
A reversal pattern which: - Appears at the bottom of a downtrend - A small body with a long upper shadow and little to no lower shadow. |
|
|
A reversal pattern which consists of: - A single candlestick pattern - A very small body and a long lower shadow that appears at the bottom of a downtrend |
|
|
- It consists of a long bearish candle - Followed by a doji candle that gaps down - And then a long bullish candle that gaps up. |
|
|
Starts with a bearish candle - Followed by a bullish candle that engulfs the first candle - Ends with another bullish candle that closes higher. |
|
|
- Starts with a long bearish candle - Followed by an even longer bullish candlestick. The candle opens higher than the previous day's closing price and rises even more. |
|
|
A two-candlestick pattern that includes: - Two equal-sized bullish and bearish candles. |
|
|
It consists of five candles in a continuation pattern - A long bullish candle - Three small bearish candles that trade above the low and below the high of the first candlestick - And another long bullish candle that closes above the high of the first candlestick. |
|
|
It is similar to the rising three methods pattern consisting of five candles - It starts with a long bullish candle - Followed by three small bearish candles (a smaller bearish candles that move lower) that stay within the range of the first candle - And end with another long bullish candle that closes above the high of the first candle. |