Triangle Pattern
In technical analysis, triangles fall under the category of continuation patterns. There are 3 types of triangles, and all three of them need to be studied in depth. The three different triangle patterns are ascending triangle pattern, descending triangle pattern and symmetrical patterns.
This blog looks in detail at the technical analysis of triangle chart patterns.
What is Triangle Chart Pattern?
A triangle chart pattern is a tool that is used for technical analysis. The triangle pattern, or as its name says, resembles a triangle. It is depicted by drawing trendlines alongside a converging price that links to a pause in the prevailing trend.
Despite the triangle pattern being a continuation pattern, as mentioned above, traders need to look for breakouts before they make a move to exit or enter a position.
Overview of Triangle Pattern Trading
A triangle chart pattern is formed when the upper and lower trendlines ultimately meet at the apex on the right side, which forms a corner. These patterns are created once the trading horizon of a stock or another security becomes close.
Connecting the beginning of the upper trendline to the start of the lower trendline completes the other two corners to form the whole triangle. The upper trendline is created by drawing together the highs, while the lower trendline is created by connecting the lows.
Triangles are similar to wedges. Wedges are price patterns marked by converging trendlines. Pennants (meaning continuation patterns formed when an asset shows a large movement) are also used in the analysis. If they are validated, they can either be a continuation pattern or a powerful reversal pattern at the time of loss.
Traders utilize triangle patterns to highlight when a stock or security's trading range closes after a downtrend or uptrend.
Types of Triangle Patterns
There are three potential triangle variations (as mentioned earlier) that could develop as a price action carves out a holding pattern.
The types of triangle patterns are explained in the table below:
|
Name |
Meaning |
How to Trade? |
|
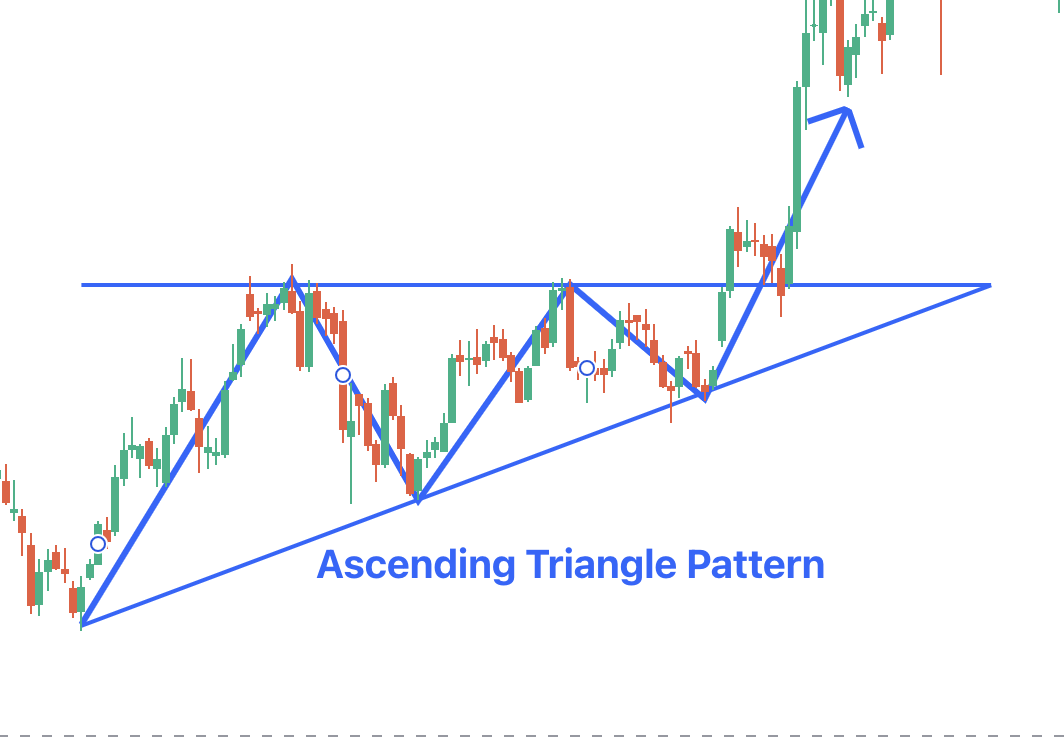
Ascending Triangle |
An ascending triangle pattern is a breakout pattern that is formed when the price breaks the upper horizontal trendline with rising volume. This is a bullish pattern. The upper trendline needs to be horizontal, which indicates identical highs forming a resistance level. The lower trendline would need to rise diagonally, which would further indicate a higher low as buyers step up their bids. Buyers will eventually lose patience and move into the security above the resistance price. This triggers more buying when the uptrend resumes. The upper trendline that was formed at a resistance level will now become a support. |
In this pattern, you typically have to buy after the pattern breaks the resistance. It is always good to set a stop loss just below the last low. |
|
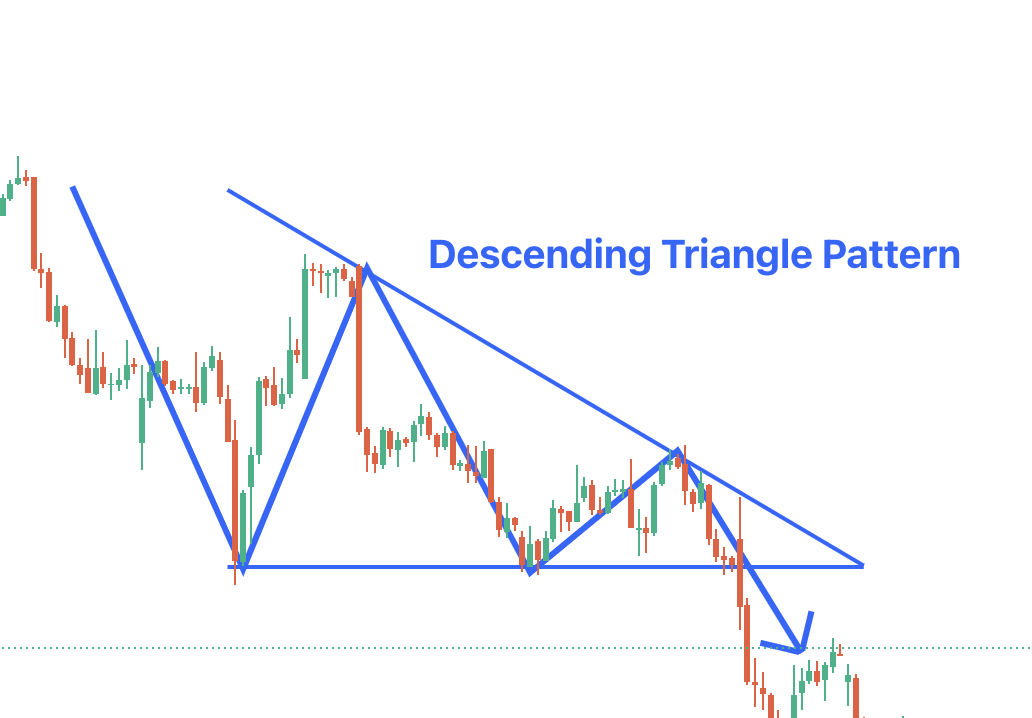
Descending Triangle |
A descending triangle is an inverted form of the ascending triangle pattern. The lower trendline needs to be horizontal, connecting the identical lows. The upper trendline declines diagonally towards the apex. The breakdown happens when the price falls through the base horizontal trendline support as a downtrend restarts. The lower trendline that was a support now becomes a resistance. |
In this pattern, you need to buy after the pattern breaks the resistance. Here, too, it is best to set a stop loss. |
|
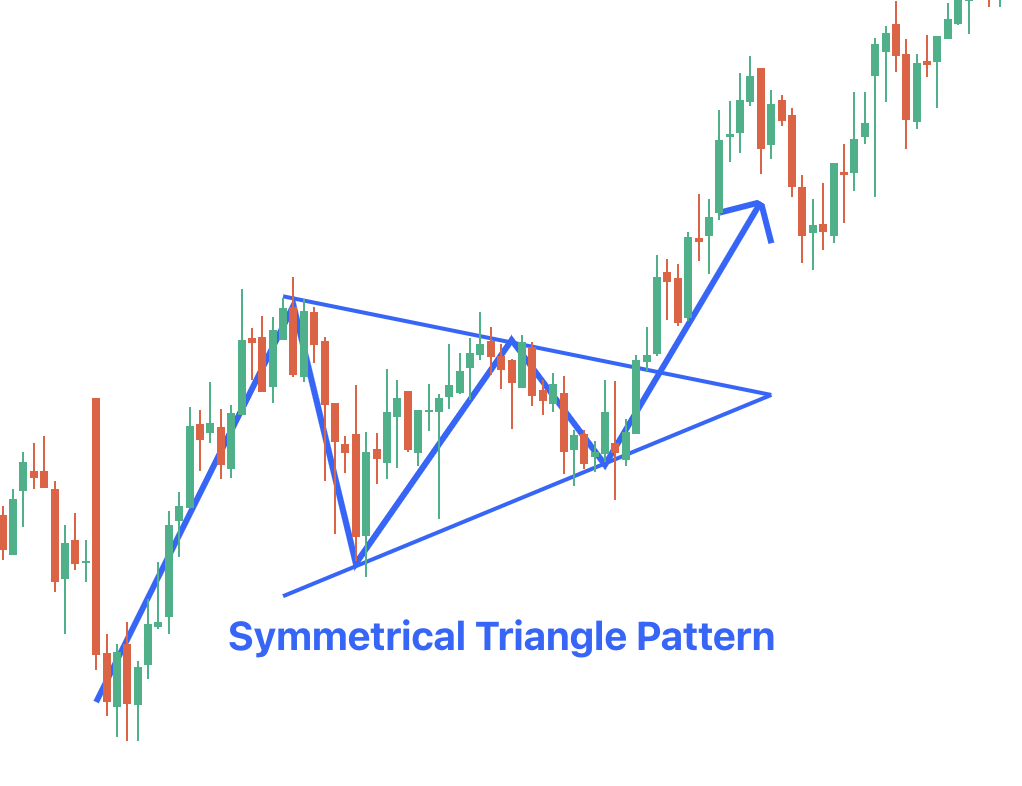
Symmetrical Triangle |
A symmetrical triangle has a diagonally falling upper trendline and a diagonally rising lower trendline. As the price moves towards the apex, it will inevitably break the upper trendline for a breakout and uptrend on increasing prices or breach the lower trendline, creating a breakdown and downtrend with falling prices. Traders need to look closely at the volume of hikes and for at least two closes beyond the trendline to ensure the break is valid and not a head fake. Symmetrical triangles often tend to be continuation break patterns. This means they have to break in the direction of the first move before the triangle forms. So, if an uptrend precedes a symmetrical triangle, traders would expect the price to break to the upside. |
Look for an opportunity to buy a pair since it is partial to the conclusion of the pattern mentioned above. |
Ascending Triangle :
Descending Triangle :
Symmetrical Triangle :