Triple Bottom Pattern
The triple bottom pattern is a much-needed concept in technical analysis. It offers insights into potential trend reversals in financial markets. With this robust pattern, an investor/trader can explore the markets, experience better trading strategies, and more.
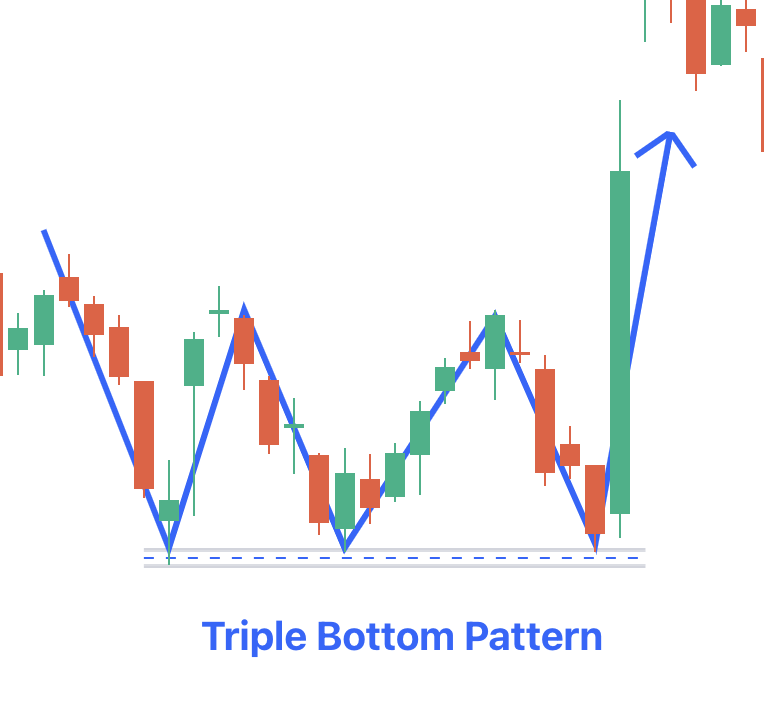
What is Triple Bottom Chart Pattern?
It is a bullish reversal chart pattern formed when there is a downtrend. It can signify potential trend reversals and shifts from bearish sentiments to bullish sentiments. The pattern has three consecutive bottoms or lows at or close to the same level, which creates a unique support area.
This triple bottom chart pattern is characterised by two minor pullbacks between the three lows, which form a pattern that resembles the letter W.
Understanding the Triple Bottom Stock Chart Pattern in Depth
The Triple Bottom Pattern is formed when the price attains a support level and prevents further downward movement. This forms a level where the demand exceeds the supply, leading to a potential reversal in the price trend.
The first two will represent the initial selling pressure, after which there will be a minor pullback. The second low will confirm the support level. This will be followed by another pullback.
Lastly, the third low would reaffirm the strength of the support level, indicating a possible trend reversal.
How to Trade Triple Bottom Candlestick Pattern
Follow the steps listed below to start trading this pattern:
- You need to find three consecutive lows around the same level, which will form a support area.
- Make sure that each low is greater than the older one, which would indicate a potential trend reversal.
- The price has to break above the resistance level formed by minor pullbacks. This will confirm the pattern and offer an entry point for bullish traders.
- You need to set a stop-loss order below the lowest point of the triple bottom chart pattern to limit potential losses if the reversal fails.
- Decide on the target price according to the pattern's height. You need to measure the distance between the support and resistance and add it to the breakout point.
How to Identify Triple Bottom Pattern
You can spot this pattern through:
- Find three consecutive lows forming around the same level. You need to pay attention to the shape of the pattern, which would resemble a W.
- Observe the volume in the formation of the pattern; volume needs to diminish as the pattern develops and increases during the breakout.
- Wait till you see the price break above the resistance level formed by the minor pullbacks. This will confirm the pattern and offer a reliable signal for potential traders.
Advantages and Disadvantages of the Triple Bottom Pattern
The table below lists the merits and demerits of the pattern:
|
Advantages |
Disadvantages |
|
Triple bottom chart pattern is easily identifiable by traders because of its unique manner of construction. |
This pattern cannot possibly provide 100% accurate results at all times, just like any other technical tool. |
|
Traders can use this pattern to create support levels and risk-reward ratios and to set a benchmark. |
There is a chance that prices will decline further and breach the support level. |
|
This pattern is seen in different timeframes, starting from short- to long-term charts; this allows it to be used in different types of stock market trading. |
Time and patience are key elements in the pattern's formation and confirmation. |
|
Traders can set a stop-loss order with clarity through this pattern to reduce the potential risks. |