Long Legged Doji Candlestick Pattern
The Long-Legged Doji Candlestick Pattern is a go-to tool in terms of trading, holding implications for traders. This pattern suggests that a balance between demand and supply often comes with potential shifts in market sentiment. Traders perceive the long-legged Doji as an indication of uncertainty in the stock market.
This article will explain the significant aspects of the Long-Legged Doji trading pattern.
What is the Meaning of Long-Legged Doji?
The emergence of a Long-Legged Doji in financial markets shows a delicate balance between demand and supply, indicating a potential shift in the prevailing trend. This candlestick pattern suggests that neither the buyers nor the sellers have adequate control, often signalling indecision or uncertainty in the market.
When coupled with a preceding uptrend or downtrend, it implies a possible exhaustion of momentum, paving the way for a reversal in price direction. Traders closely monitor such patterns as they can come up with some valuable insights into forthcoming market movements, though it is prudent to consider other technical indicators and fundamental factors before making trading decisions solely based on candlestick formations.
How the Long-Legged Doji Candlestick Pattern Works?
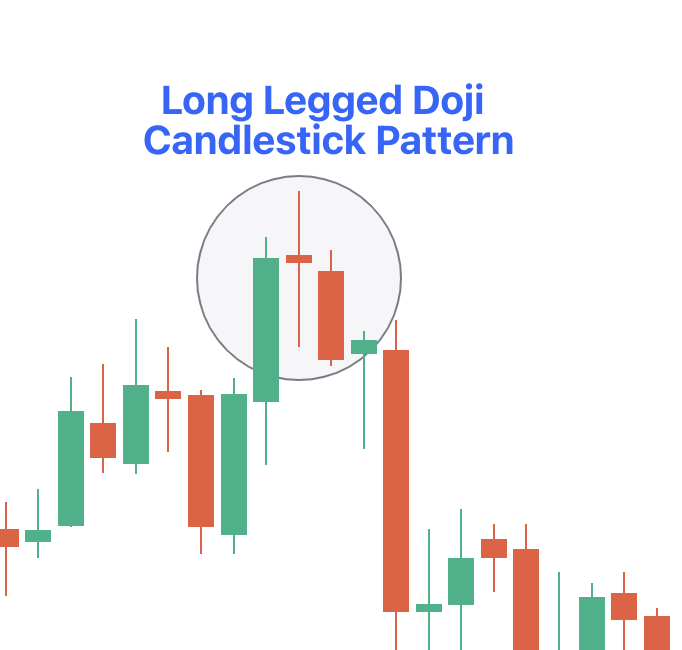
The Long-Legged Doji trading pattern tells us when the opening and closing prices closely match, forming a real body placed in the middle of the candlestick. This formation is different because of the elongated upper and lower shadows, denoting greater price movements in the timeframe, which is not like the typical Doji shapes.
Simply put, a long-legged Doji candlestick pattern mirrors a cross, characterised by a minute or non-existent body and closing and opening prices placed in the candle's centre point.
The long-legged Doji candlestick pattern has four essential elements:
- Elongated Shadows: A brilliant feature of the long-legged Doji is its extended upper and lower shadows, portraying one of the widest ranges observable on the chart. These lengthy wicks vividly show us the substantial volatility seen in prices throughout the trading cycle.
- Compact Body: The central body of the long-legged Doji tends to be smallish, nestled in the broader chart pattern. This indicates minimal difference with the opening and closing prices, indicating market indecision.
- Colourless Presentation: In discerning long-legged Dojis, the hue of the candle (filled or hollow) holds lesser importance. The focus is more on observing a small-sized candle body.
- Contextual Consideration: For greater precision in identification, traders should consider the long-legged Doji within specific market contexts. It commonly follows prolonged uptrends or downtrends, hinting at potential reversals or substantial retracements.
Advantages and Disadvantages of Long-Legged Doji Candlestick Pattern
The pros and cons of this pattern are:
|
Advantages |
Disadvantages |
|
It is Compatible with Diverse Timeframes: Effective across different trading periods, it allows flexibility in strategy implementation. |
It May Occasionally Give False Signals: There could be false trading signals. Traders need to exercise caution and look out for additional confirmation. |
|
Tells Traders About Entry and Exit Points: It helps to pinpoint entry and exit levels, enhancing trade precision. |
Requires Experience and Expertise: Skill in interpreting the pattern is necessary, making it more suitable for experienced traders. |
|
Assists in Confirming Other Technical Indicators: Offers additional validation for signals from other technical analysis tools, strengthening decision-making. |
Not Suitable for All Securities: Sometimes this may not work well for all types of assets. It needs careful consideration of market conditions. |
|
Offers Insights into Market Sentiment: Offers a good understanding of market sentiments, and helps in more informed trading decisions. |
Can Sometimes Cause Confusion: This can be perplexing for traders, especially beginners. |
|
Indicates Potential Reversals: Signals possible changes in market direction, providing valuable insights for trend traders. |
Complexity for Novice Traders: Novice traders may find it challenging to interpret accurately, necessitating comprehensive education and practice. |
How to Trade Using a Long-Legged Doji Candlestick Pattern
To effectively trade the long-legged Doji:
- Adopt the wait-and-watch strategy, recognising that the pattern indicates market indecision. Monitor the price movement. See whether it goes beyond the high or low of the Doji, and accordingly consider entry into long or short positions.
- Incorporate moving averages into your analysis. A long-legged Doji penetrating a moving average could signify a potential breakout or rebound. Wait for confirmation from the subsequent session's close to validate the signal.
- Combine the long-legged Doji with other technical indicators, such as volume analysis or oscillators. Make sure you do not use it alone. Confirmatory signals from different indicators can strengthen your trading strategy and push up the probability of success.
- Practice risk management techniques to safeguard your capital invested. Set stop-loss orders to limit potential losses and get along with your trading plan to avoid impulsive decisions.
How Reliable is the Long Legged Doji Candlestick Pattern?
The Long-Legged Doji Candlestick Pattern can provide a moderate level of reliability, particularly in liquid stocks, where the appearance of a Doji indicates market indecision. However, its reliability is subject to fluctuations, necessitating careful consideration and prudent trading practices.
The Long-Legged Doji Candlestick Pattern provides traders with valuable insights into market dynamics. The pattern can indicate potential trend reversals or significant retracements. While exhibiting a moderate level of reliability, especially in liquid stocks, traders must exercise caution and complement their analysis with other technical indicators and fundamental attributes to make informed trading decisions.