Double Top Pattern
Technical analysis is an important tool for any trader in the stock market. From several chart patterns, the Double Top Pattern plays a vital role. This post discusses the definition, methods to identify the pattern, and its advantages & disadvantages. Keep reading to get a good grip on using this pattern for your trading practices.
What is the Double Top Pattern?
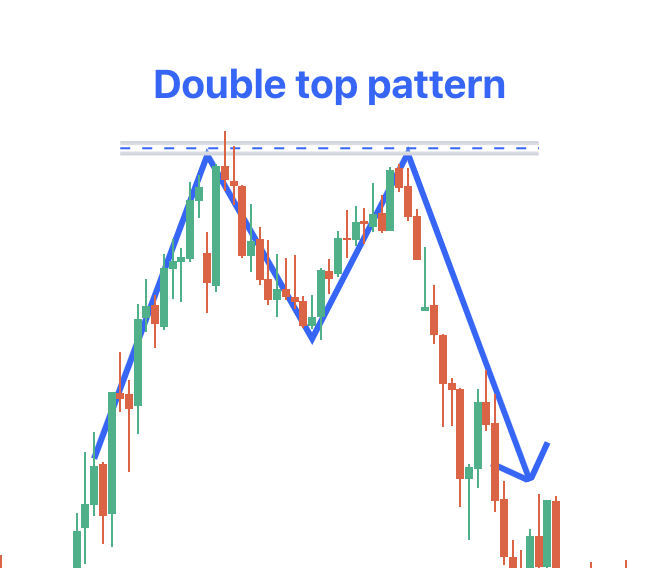
The Double Top Pattern Chart is a bearish technical reversal pattern formed after a particular asset attains a high price twice, as the name suggests, with a moderate decline between the two highs. The pattern is confirmed when the asset's price drops below a support level (support level means the price level that an asset does not drop below for a time span) equal to the low between the previous two highs.
Also Read : What is Double Bottom Pattern?
How to Understand the Double Top Chart Pattern?
A double top tells you about medium- or long-term trend changes in an asset class. As previously said, it has two peaks at nearly the same price level, separated by a trough.
Read on to understand how to make an entry into this pattern.
How to Identify the Double Top Stock Pattern
You can consider the double-top stock pattern through the steps mentioned below:
- The price movement needs to be clearly in an uptrend before the formation of a double top. This would indicate that the price has been witnessing higher highs and higher lows.
- Decide on the uptrend's first peak. The price will rise to its maximum level before it begins to fall.
- After the first peak, the price will briefly fall. You can see a valley or trough that develops after the peak.
- The price would then rise once again in an effort to hit a new high. The second rally will fall short of the first peak's height and start to collapse again.
- In order to verify a double-top pattern, ensure that the price drop follows the second peak and is lower than the trough that follows the first peak. This shows that the price could not overcome the older resistance level.
- Link the low points of the two troughs with a horizontal line and the neckline, which shows a level of support. It will serve as an essential pattern reference.
- In order to verify the double top pattern, you need to look for a price break below the neckline.
Points to Remember while Identifying a Double Top Pattern
- An uptrend in the price movement should clearly be an uptrend before the creation of a double top. This says that the price has been making continuous higher highs and higher lows.
- After the initial top, the price will fall for a brief time; you need to see a trough forming after this.
- The price will then rise again to hit a new high. The second rally will fall short of the height of the first top and begin to collapse again.
- In order to verify the double top pattern, look for a fall after the second top. This needs to be lower than the trough that follows the first top. You will see here that the price could not overcome the previous resistance level.
- Connect both the low points of the troughs with a line; this is known as the neckline. This portrays a level of support and serves as a reference to the pattern.
- In order to verify the double-top pattern, you need to look out for a price break below the neckline. Breaking lower than the neckline will signal a sell signal, as mentioned earlier.
Merits and Demerits of Double Top Pattern
The advantages and disadvantages of the pattern are as below:
|
Merits |
Demerits |
|
A double-top pattern portrays a cue for a possible change in trend from an uptrend to a downtrend. |
This pattern is not infallible. |
|
The two consecutive tops can be used by traders as a benchmark to establish stop-loss orders and profit motives. |
It can occasionally generate false signals. |
|
It provides a good entry point for traders to begin short positions at the breakpoint of the neckline. |
There could be subjectivity involved in recognising a double-top pattern. |
|
The height of the tops can be used to predict profit targets and give traders a distinct moment to exit. |
It can be hard to specify the entry and departure locations or establish the pattern's target level due to variability. |
|
In various ways, the double top could be more predictable and reliable than other strategies. |
|
|
By spotting a double-top pattern, traders can decide the profit goals and probable downside targets based on the pattern's height. |
|
|
Since the profit goal is higher than the original risk, it offers a good risk and reward ratio. |