Tweezer Bottom Candlestick Pattern
The Tweezer Bottom, also known as tweezers, is a reversal candlestick pattern that signals potential changes in the direction of the price. Both formations will have two candles that develop at the end of a trend.
This post details the Tweezer bottom candlestick pattern. Read on to understand it.
Check Here to know How to Read Candlestick Charts.
What is the Tweezer Bottom Candlestick?
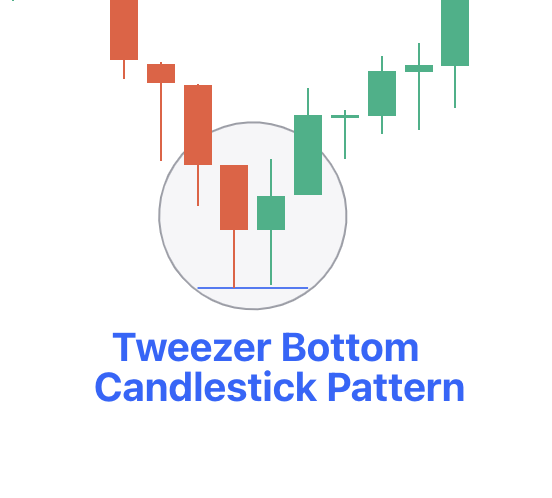
The tweezer bottom is a bullish reversal candlestick pattern created at the end of a downtrend. It has two candlesticks: one bearish and one bullish. Both would make almost the same lows.
How to Identify the Tweezer Bottom Candle Pattern
A tweezer bottom would have been formed at the end of the downtrend, and here, prices make lower lows. The first candlestick in this pattern would be bearish in nature, and it is formed according to market expectations. As the pattern is created close to the support level, the sentiments of the traders reverse, and the buyers will begin to buy.
Since this type of high-sensitivity bullish candlestick is formed, it shows that the bulls have taken control of the price.
A third bullish candle will provide confirmation and traders will initiate long positions when the higher high of the older two candles is crossed, keeping the second candle low as a stop loss.
The three main steps to spot this pattern are:
- The previous trend needs to be a downtrend.
- A bearish candle needs to be formed on the first day.
- On the next day, a bullish candle must be formed with a low similar to the previous day.
How to Trade Tweezer Bottom Candlestick Chart
The bullish tweezer will form at the end of a downtrend. Here, the first candle would be strong, bearish, and powerful, signalling the continuation of the downside move. The second candle would print a new short-term low before surging higher to erase all losses from the previous session.
Going forward, bulls will be able to build on the gains made during the second candlestick timeframe and finally push the price action higher, completely reversing the trend.
A strong bullish candle will further add to the overall bullishness of this candlestick chart pattern. This is one of the other reasons why a reversal would be extremely powerful.
Trading the bullish tweezer would not be very different from trading other bullish reversal candlestick patterns. For entry, you need to wait for the formation to be completed before you enter the trade.
The stop loss needs to be placed below the last low, as the new low will invalidate the pattern. Profit-taking orders, on the other hand, need to be calculated according to other technical analysis tools.
What Does the Tweezer Bottom Pattern Tell Us?
The pattern indicates that the market is bearish. The market sentiments are also bearish, and there is high supply and low demand, making the market pause further.
Check More Bullish Candlestick Patterns
|
Bullish Pattern |
Features |
|
A reversal pattern which consists of: - A small bearish candle followed by a - Larger bullish candle. |
|
|
A reversal pattern which consists of: - A small body candle, and - Long lower shadow/wick |
|
|
A reversal pattern which consists of: - It starts with a long bearish candle - Followed by a small-bodied candle (either bullish or bearish) - And ends with a long bullish candle. |
|
|
- A strong bearish candle followed by a bullish candle. - Second candle opens below the previous candle's close but closes above the midpoint (50%) of the previous bearish candle. |
|
|
- It is is a two-candlestick pattern that signals a possible upward trend reversal. - Small bullish candle is completely contained within the body of the previous large bearish candle. |
|
|
- It consists of three long bullish candles with small wicks that appear consecutively one after another. - Each new candle opens inside the previous one’s body and closes higher than the last. |
|
|
A reversal pattern which: - Appears at the bottom of a downtrend - A small body with a long upper shadow and little to no lower shadow. |
|
|
A reversal pattern which consists of: - A single candlestick pattern - A very small body and a long lower shadow that appears at the bottom of a downtrend |
|
|
- It consists of a long bearish candle - Followed by a doji candle that gaps down - And then a long bullish candle that gaps up. |
|
|
A three candlestick pattern with: - A large bearish candle, - A small bullish candle that closes above the 50% level of the first candle and - A third bullish candle that closes above the first candle's open. |
|
|
Starts with a bearish candle - Followed by a bullish candle that engulfs the first candle - Ends with another bullish candle that closes higher. |
|
|
- Starts with a long bearish candle - Followed by an even longer bullish candlestick. The candle opens higher than the previous day's closing price and rises even more. |
|
|
It consists of five candles in a continuation pattern - A long bullish candle - Three small bearish candles that trade above the low and below the high of the first candlestick - And another long bullish candle that closes above the high of the first candlestick. |
|
|
It is similar to the rising three methods pattern consisting of five candles - It starts with a long bullish candle - Followed by three small bearish candles (a smaller bearish candles that move lower) that stay within the range of the first candle - And end with another long bullish candle that closes above the high of the first candle. |