Tweezer Top Candlestick Pattern
The tweezer top candlestick pattern assists day swing traders in analysing stock performances. These famous patterns establish trend reversals. This top tweezer candlestick pattern is typically seen when the high points of two candlesticks stay the same after an uptrend.
Here, we will discuss the details of the pattern and how to trade it.
Check Here to know How to Read Candlestick Charts.
What is the Tweezer Top Candlestick?
The tweezer top candlestick pattern is a two-line pattern, though it is composed of more than two candles. It is, by nature, a bearish reversal pattern. The first line could be any candle in an uptrend or any colour. The subsequent candles could be of any colour or type, but all the prices will have to be of the same size.
Significance of Tweezer Patterns
It can act as a leading indicator to suggest a short-term price swing or trend reversal. Similar to a pair of tweezers used for plucking, these patterns can pluck out prices on a chart.
- A fully formed tweezer can help confirm the market.
- It can also help confirm other reversal indicators.
- A failed tweezer pattern could suggest a continuation of the move in progress, and it could be helpful in stop loss placement.
- A tweezer top fails when a new high is achieved instantly after completion, and it fails when the next candle attains a new low.
Indication of the Tweezer Top Candlestick Pattern
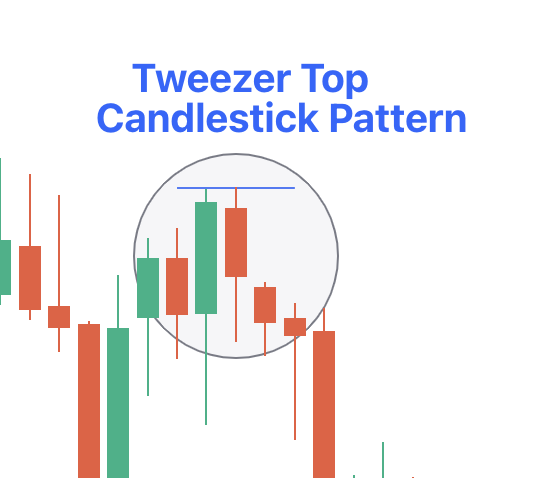
There are two candlesticks in a tweezer top: the first one is bullish, followed by a bearish one. Markets will experience a rising trend on the first day, and the second day also opens on a high note, attaining highs witnessed the day earlier.
However, the stocks will close on a weak note, represented by a large red or black candlestick. This pattern, however, is quite frequent, and you could encounter it quite often.
How is the Tweezer Top Candlestick Formed?
The following are some of the criteria that need to be satisfied for the successful formation of the pattern:
- The stock market needs to be on a rising trend.
- A green candlestick needs to form on the first day.
- A red candlestick needs to form on the next day, which should exhibit the same highs as the previous day.
Interpretation of the Tweezer Top Candlestick Pattern
These candlestick patterns form when there is a rising trend in the entire market or a specific asset. As mentioned earlier, a green bullish candlestick will form on the first day. This candlestick represents a rise in the price of a stock.
The next day's high of a bearish candlestick will mean a particular resistance level in that stock. This will show that the market has bulls in increasing numbers, and these numbers are significant. They are not inclined to purchase more stocks at the respective price points.
Both top candles will have similar highs, representing some degree of resistance. The resistance will tell us that there is a trend reversal, and the stocks will start moving down in the second day's trading session.
Traders could get confirmation about the bearish reversal when they find the formation of a red candlestick.
How to Trade with the Tweezer Top Candlestick Pattern?
The formation of this candlestick will indicate that bulls operating in the market are not inclined to purchase the stock. You could use market orders to trade these patterns. Moreover, you could also choose to sell-stop trade beneath the first shadow.
You could also opt for a loss higher than the candlestick. In the case of a bearish breakout, you could also execute the sell-stop trade. The markets would execute stop-loss on the initiation of this pattern.
Benefits and Drawbacks of the Tweezer Top Candlestick Pattern
The pros and cons of this pattern are listed in the table below:
|
Benefits |
Drawbacks |
|
This pattern can be identified easily, just by a glance. |
As the stock market is volatile, it could sometimes be inaccurate. |
|
It can form frequently in different time frames of the market, and it is available at regular time intervals. |
It is an expensive source of time when dealing with longer time periods. |
|
It is highly reliable for current and impending price movements. |
It has limited applicability when used in isolation. |
|
It is a very useful tool when integrated with other tools. |
Check More Bearish Chart Patterns
|
Bearish Pattern |
Features |
|
It forms when a small bullish candle is followed by a large bearish candle that completely engulfs the previous green candle |
|
|
It is formed when three consecutive long-red candles with small wicks are visible |
|
|
It appears at the top of the uptrend as a single candle with a small body and a long lower shadow |
|
|
It is a three-candlestick pattern that - Starts with a long bullish candle - Followed by a small-bodied candle that gaps up - And ends with a long bearish candle that closes well into the body of the first candle |
|
|
It is a reversal strategy which: - Is a single candlestick pattern with a small body, a long upper shadow, and little to no lower shadow |
|
|
It is a two-candlestick pattern that: - Starts with a long bullish candle followed by a Doji (a candle with a very small body) |
|
|
It is a two-candlestick pattern where: - A small bearish candle is completely engulfed within the body of the previous large bullish candle |
|
|
- It starts with a long bullish candle - Followed by a long bearish candle that opens below the previous candle’s opening price and closes lower |
|
|
It is a three-candlestick pattern that: - Starts with a bullish candle - Followed by a smaller bearish candle that is completely within the first candle - And ends with another bearish candle that closes lower |
|
|
It is a three-candlestick pattern that - Starts with a bullish candle - Followed by a bearish candle that engulfs the first candle - And ends with another bearish candle that closes lower |
|
|
it is a five-candlestick pattern that: - Starts with a long bearish candle - Followed by three smaller bullish candles that stay within the range of the first candle - And ends with another long bearish candle that closes below the first candle |
|
|
It forms a long green candle followed by a red candle that opens above the previous high but closes below the midpoint of the green candle. |
|
|
It is a three-candlestick pattern that - Starts with a long bullish candle - Followed by a Doji that gaps up from the previous candle - And ends with a long bearish candle that gaps down from the Doji. |