Multiple Candlestick Patterns - Bullish and Bearish Patterns
Multi-candle patterns are essential candlestick patterns in technical analysis, helping traders identify trend reversals or continuations. Single-candle patterns, such as Reversal Doji or Hammer, can provide traders with signals, but two- or three-candle patterns deliver a stronger, more reliable signal. They provide a price-behaviour signal, unlike single-candle patterns over multiple trading sessions. They encapsulate price changes and price behaviours over multiple trading sessions and therefore provide a more comprehensive view of market psychology.
Let us review what multi-candle patterns are, how multi-candle patterns work, and how to apply your knowledge of multi-candle patterns in actual trades.
What Are Multiple Candle Patterns?
Multi-candle patterns are candlestick patterns made up of two or more consecutive candles that work together to indicate a change in market sentiment. They can provide more detailed information about how prices behaved, as they tell a story across multiple candles rather than just a single candle. Multi-candle patterns are more reliable in confirming an existing trend or establishing potential reversal trading opportunities.
Multi-candle patterns fall into two main categories:
- Reversal patterns: Indicate a possible change in trend direction (Bullish and Bearish).
- Continuation patterns: Suggest the trend will likely continue.
Also check : Scalper Mode on 915 | Straddle Chart
Key Patterns
Here are some key patterns worth understanding.
Engulfing Pattern
- Needs at least two trading sessions to evolve completely.
- A small candle on day 1 and a relatively longer candle on day 2, which appears to engulf the candle on day 1
- Either Bullish or Bearish (appears at the bottom of the trend or at the top end of the trend)
Bullish Engulfing Pattern
- A two-candlestick pattern appears at the bottom of the downtrend.
- The prior trend should be a downtrend.
- The first day of the pattern should be the red candle that reconfirms the bearishness in the market.
- The candle on the second day should be blue and long enough to engulf the red candle.
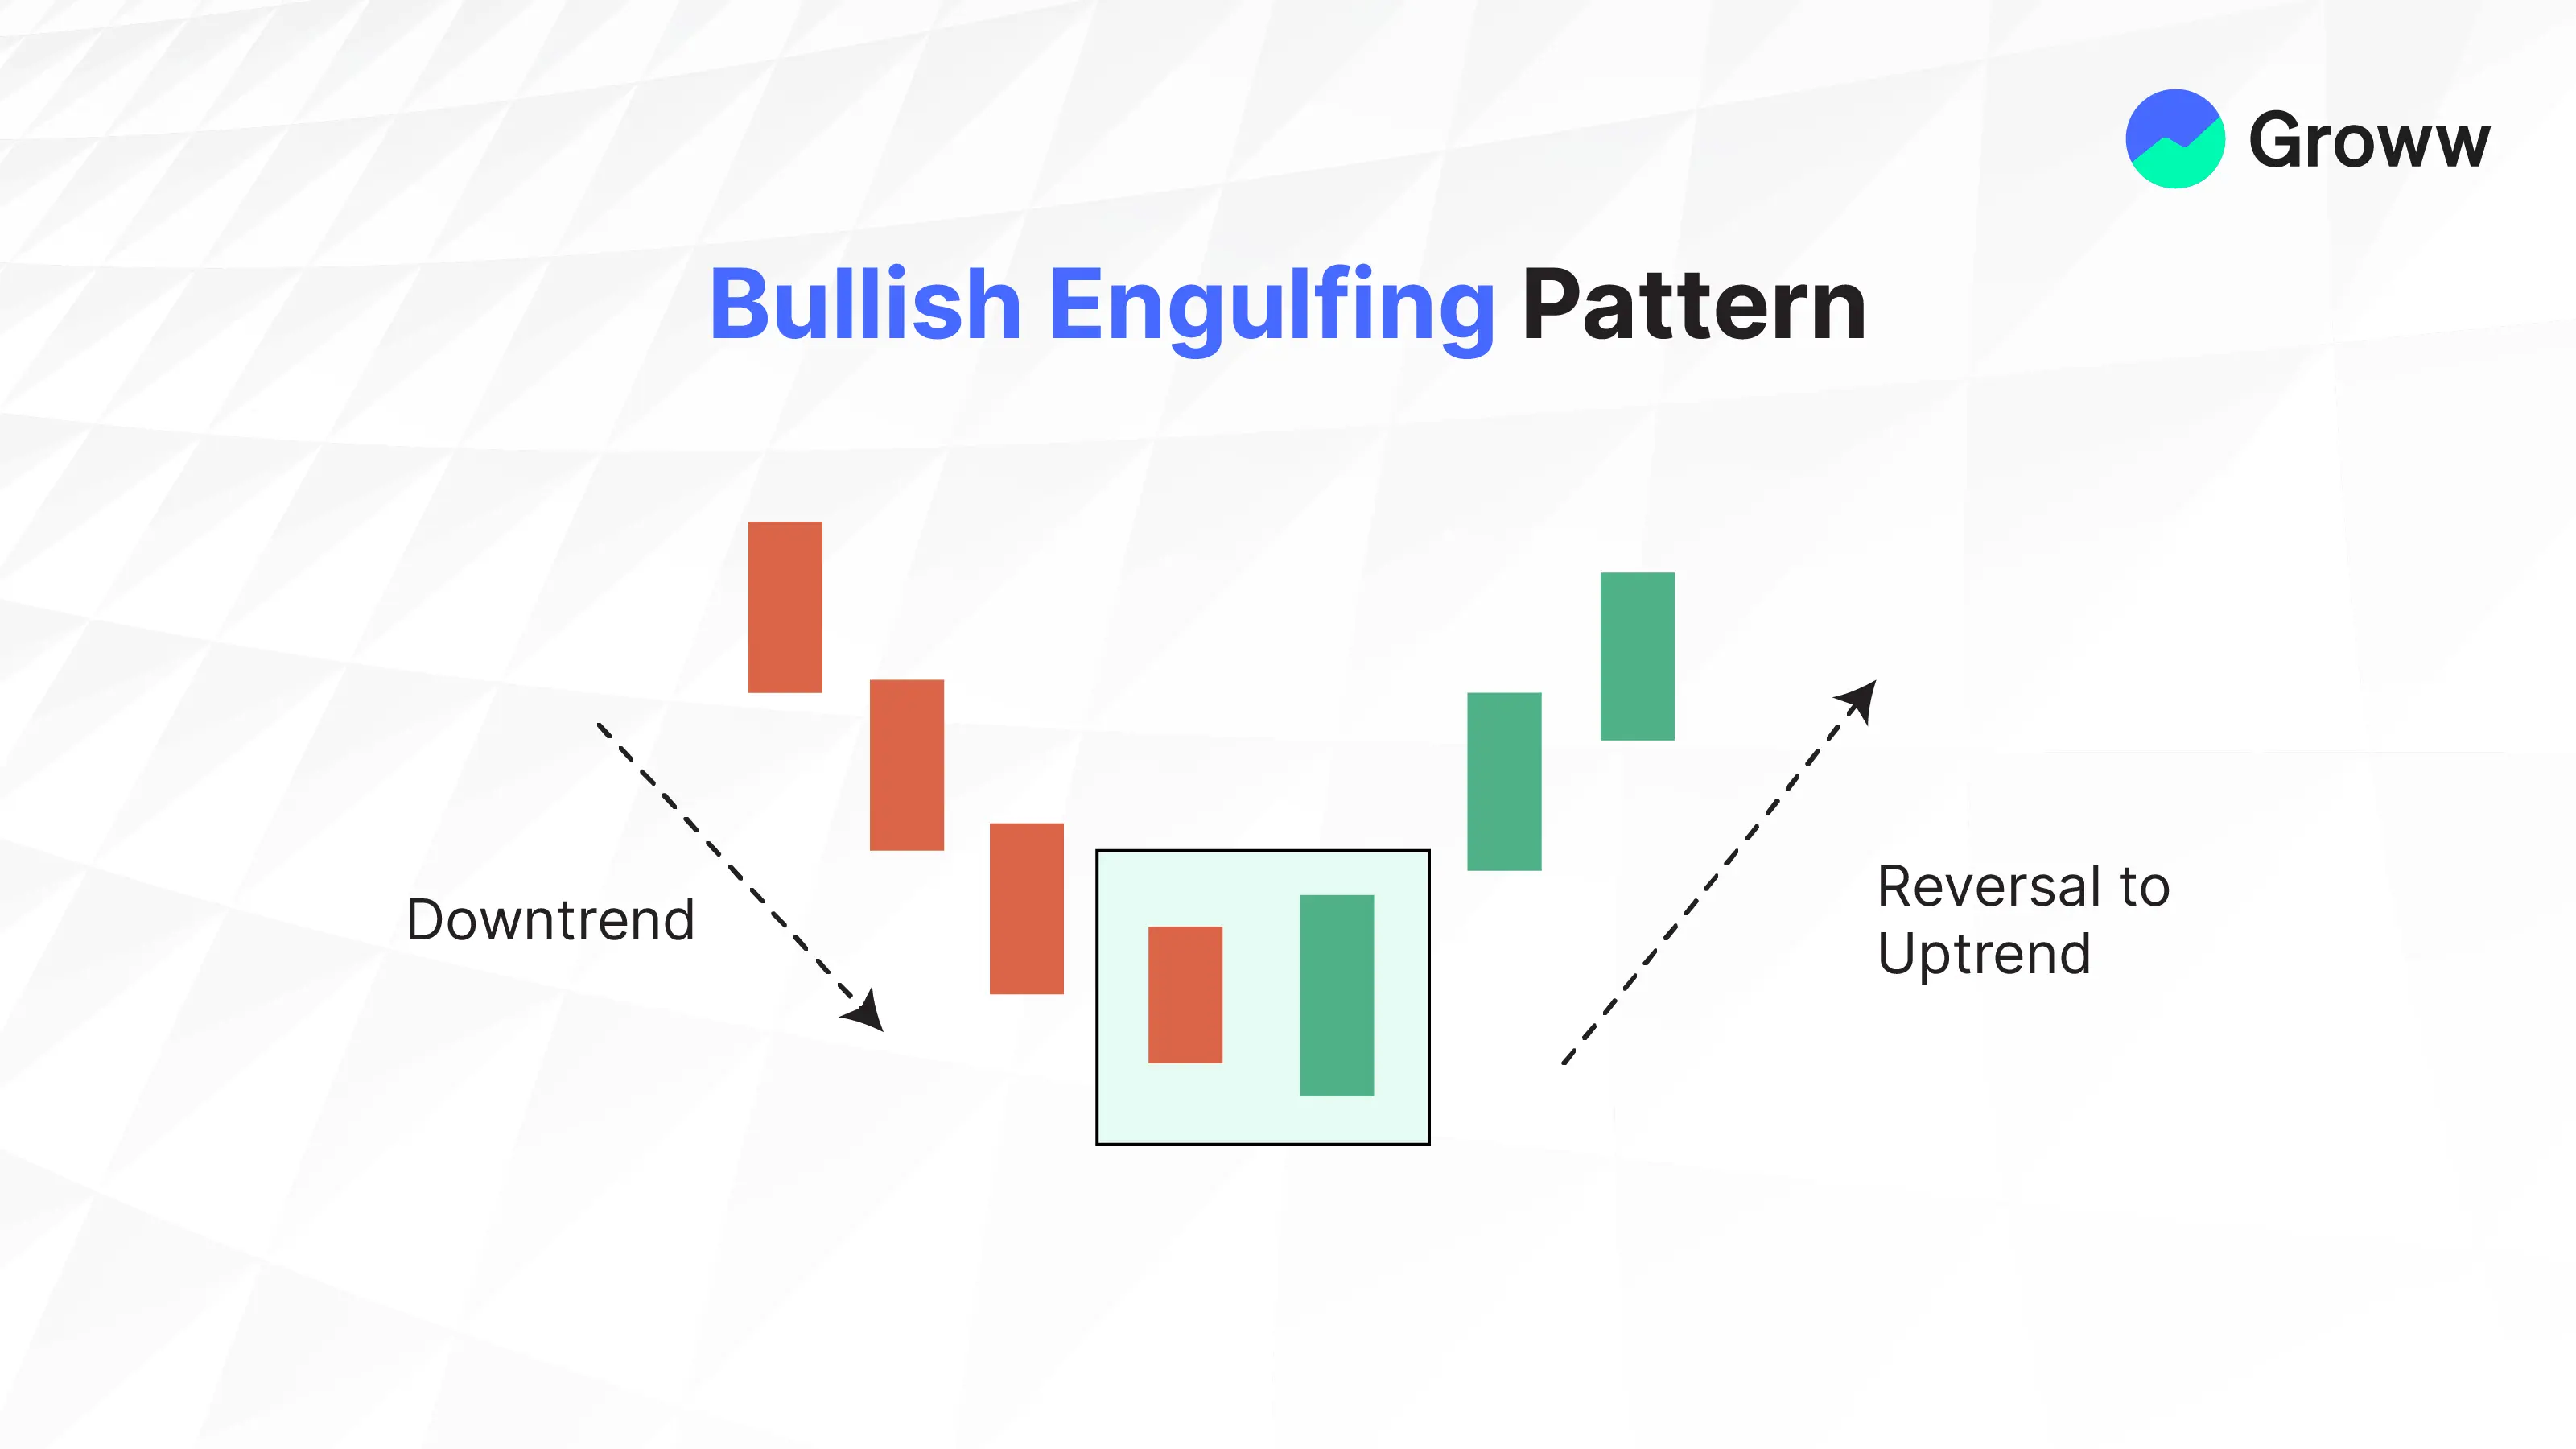
Alert: Indicates continued bullishness in the subsequent trading sessions, driving prices higher. Traders may look for buying opportunities.
Bearish Engulfing Pattern
- A two-candlestick pattern appears at the top end of the trend.
- The bulls are initially in total control, thereby driving prices higher.
- On the first day, the market rises to a new high, confirming the bullish trend.
- On the second day, the market attempts a new high, but selling pressure builds, displacing the bulls and pushing prices lower; the stock closes below its opening price the previous day.
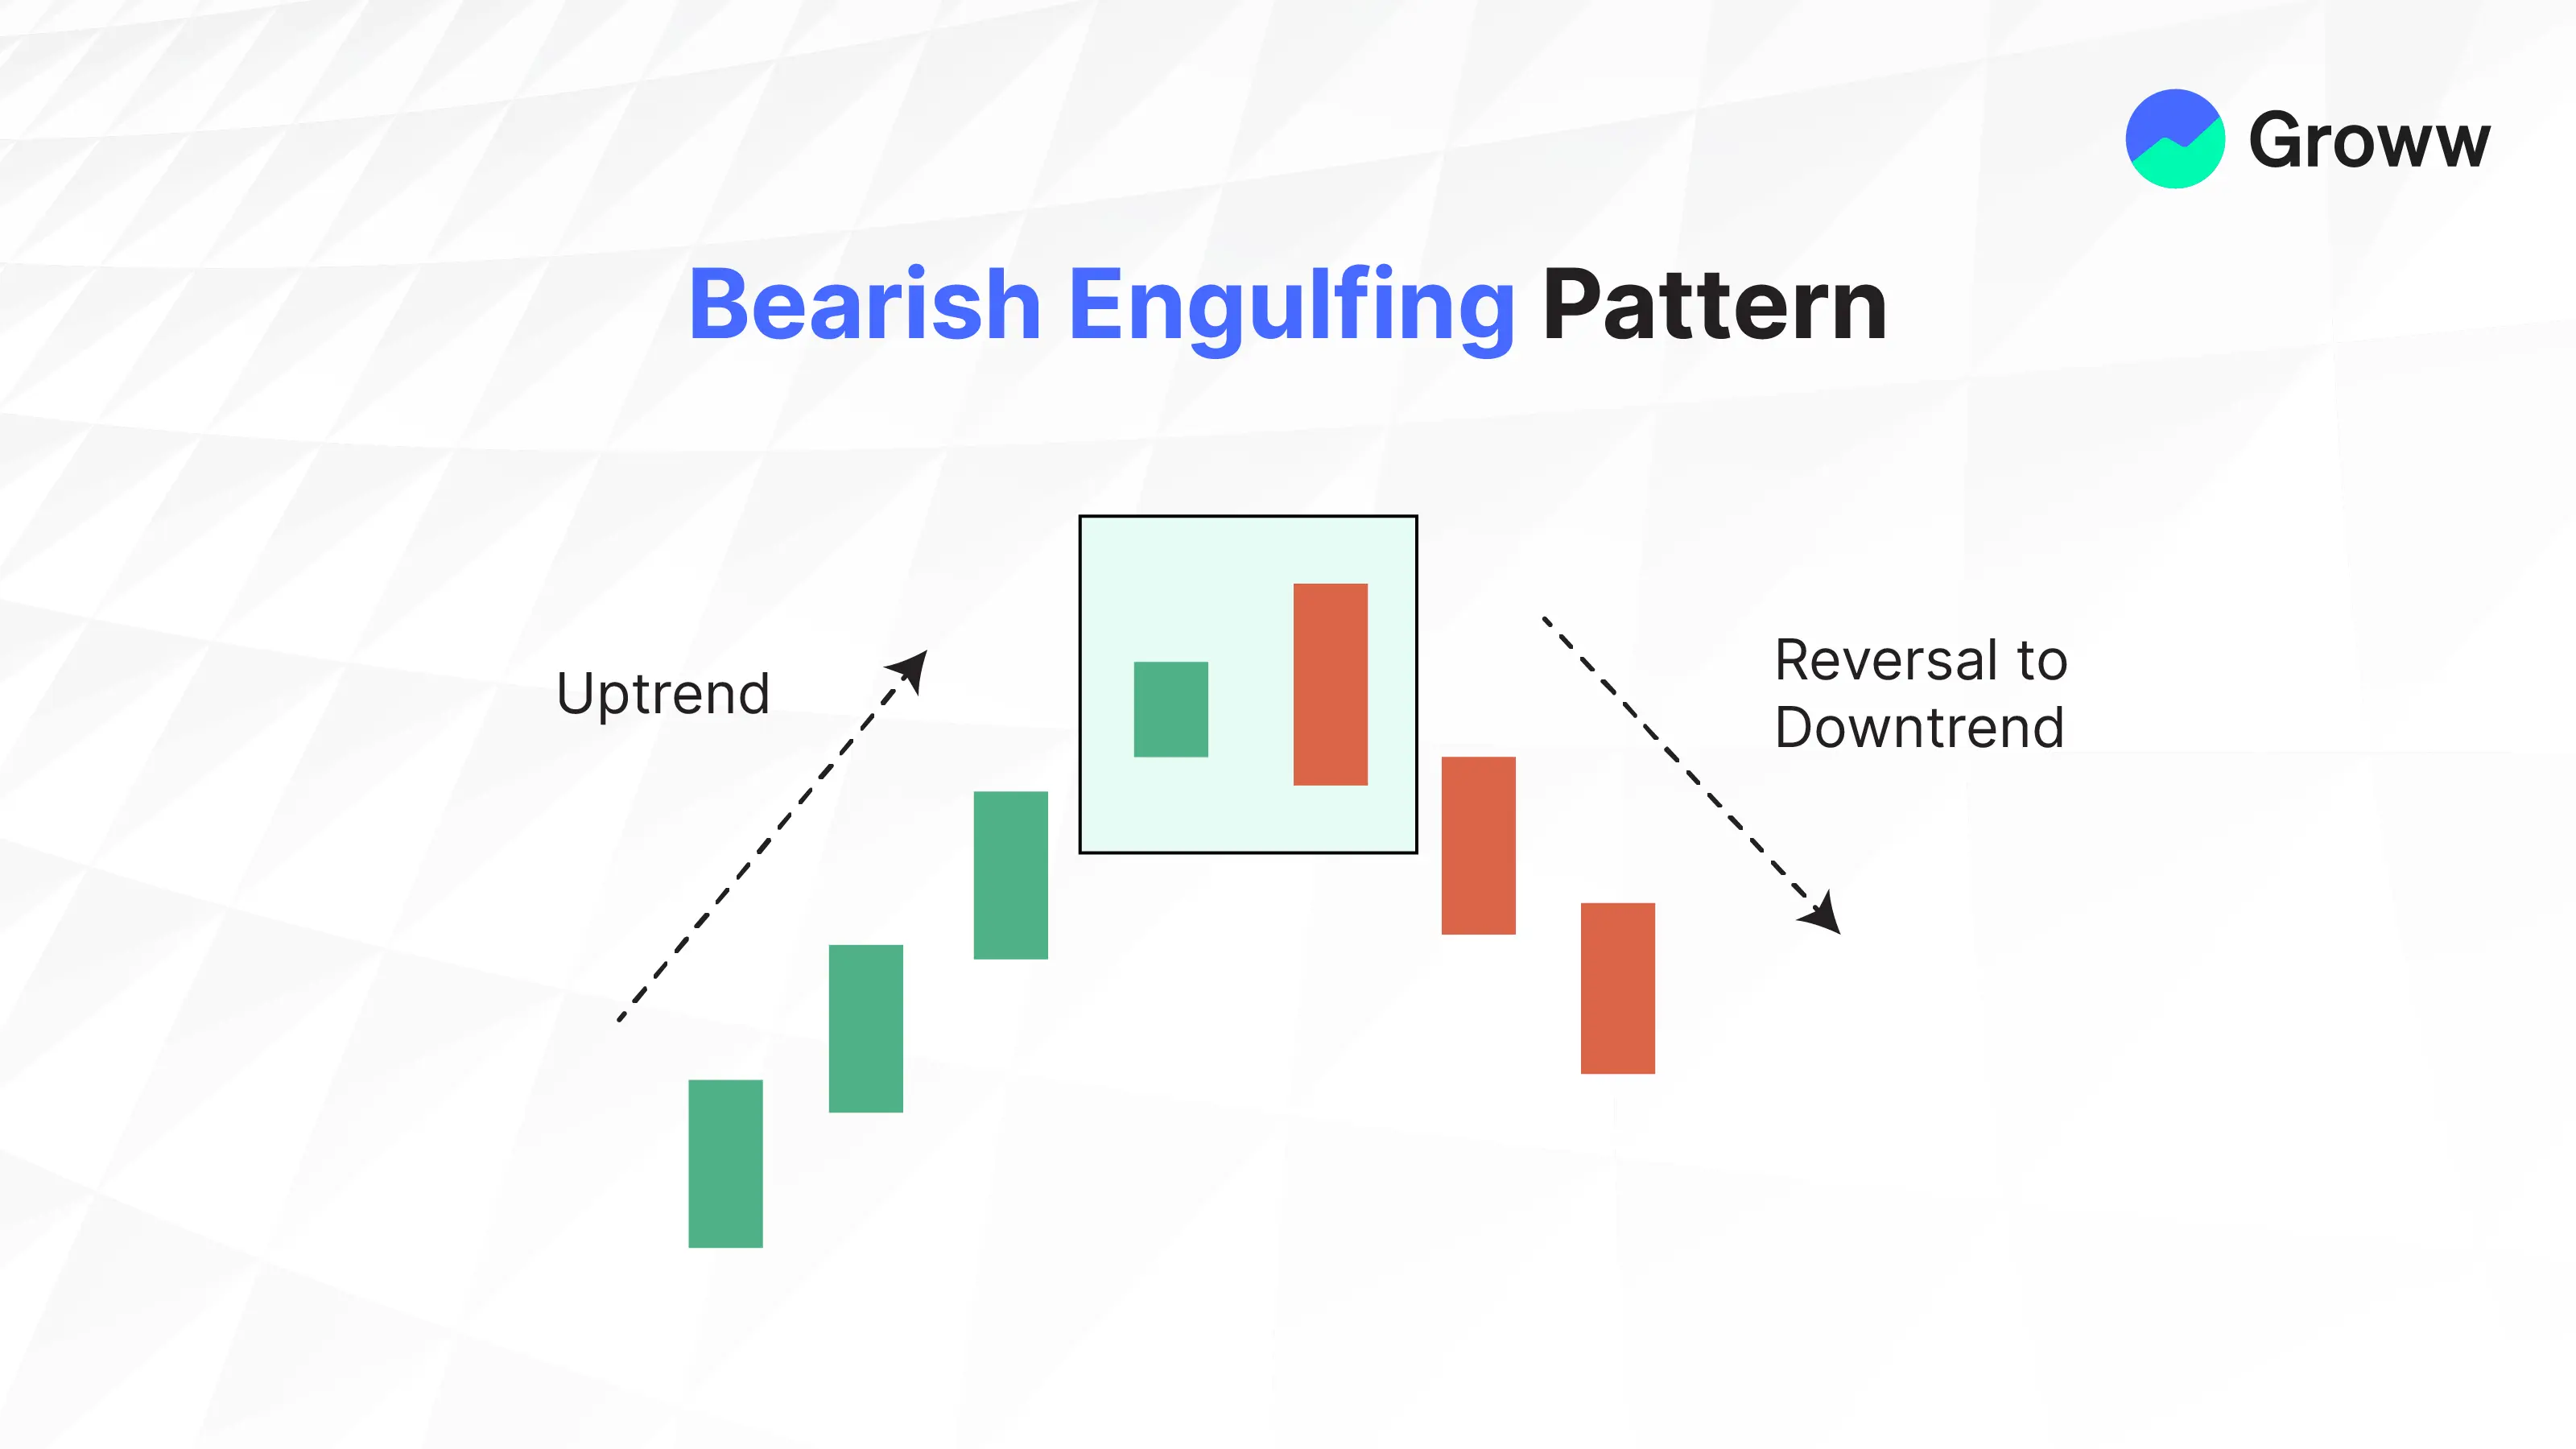
Alert: Indicates a short trade, with risk takers initiating trades on the same day after validating two aspects- whether the opening is higher than the close on the second day and whether the present market price is lower than the opening price on day one.
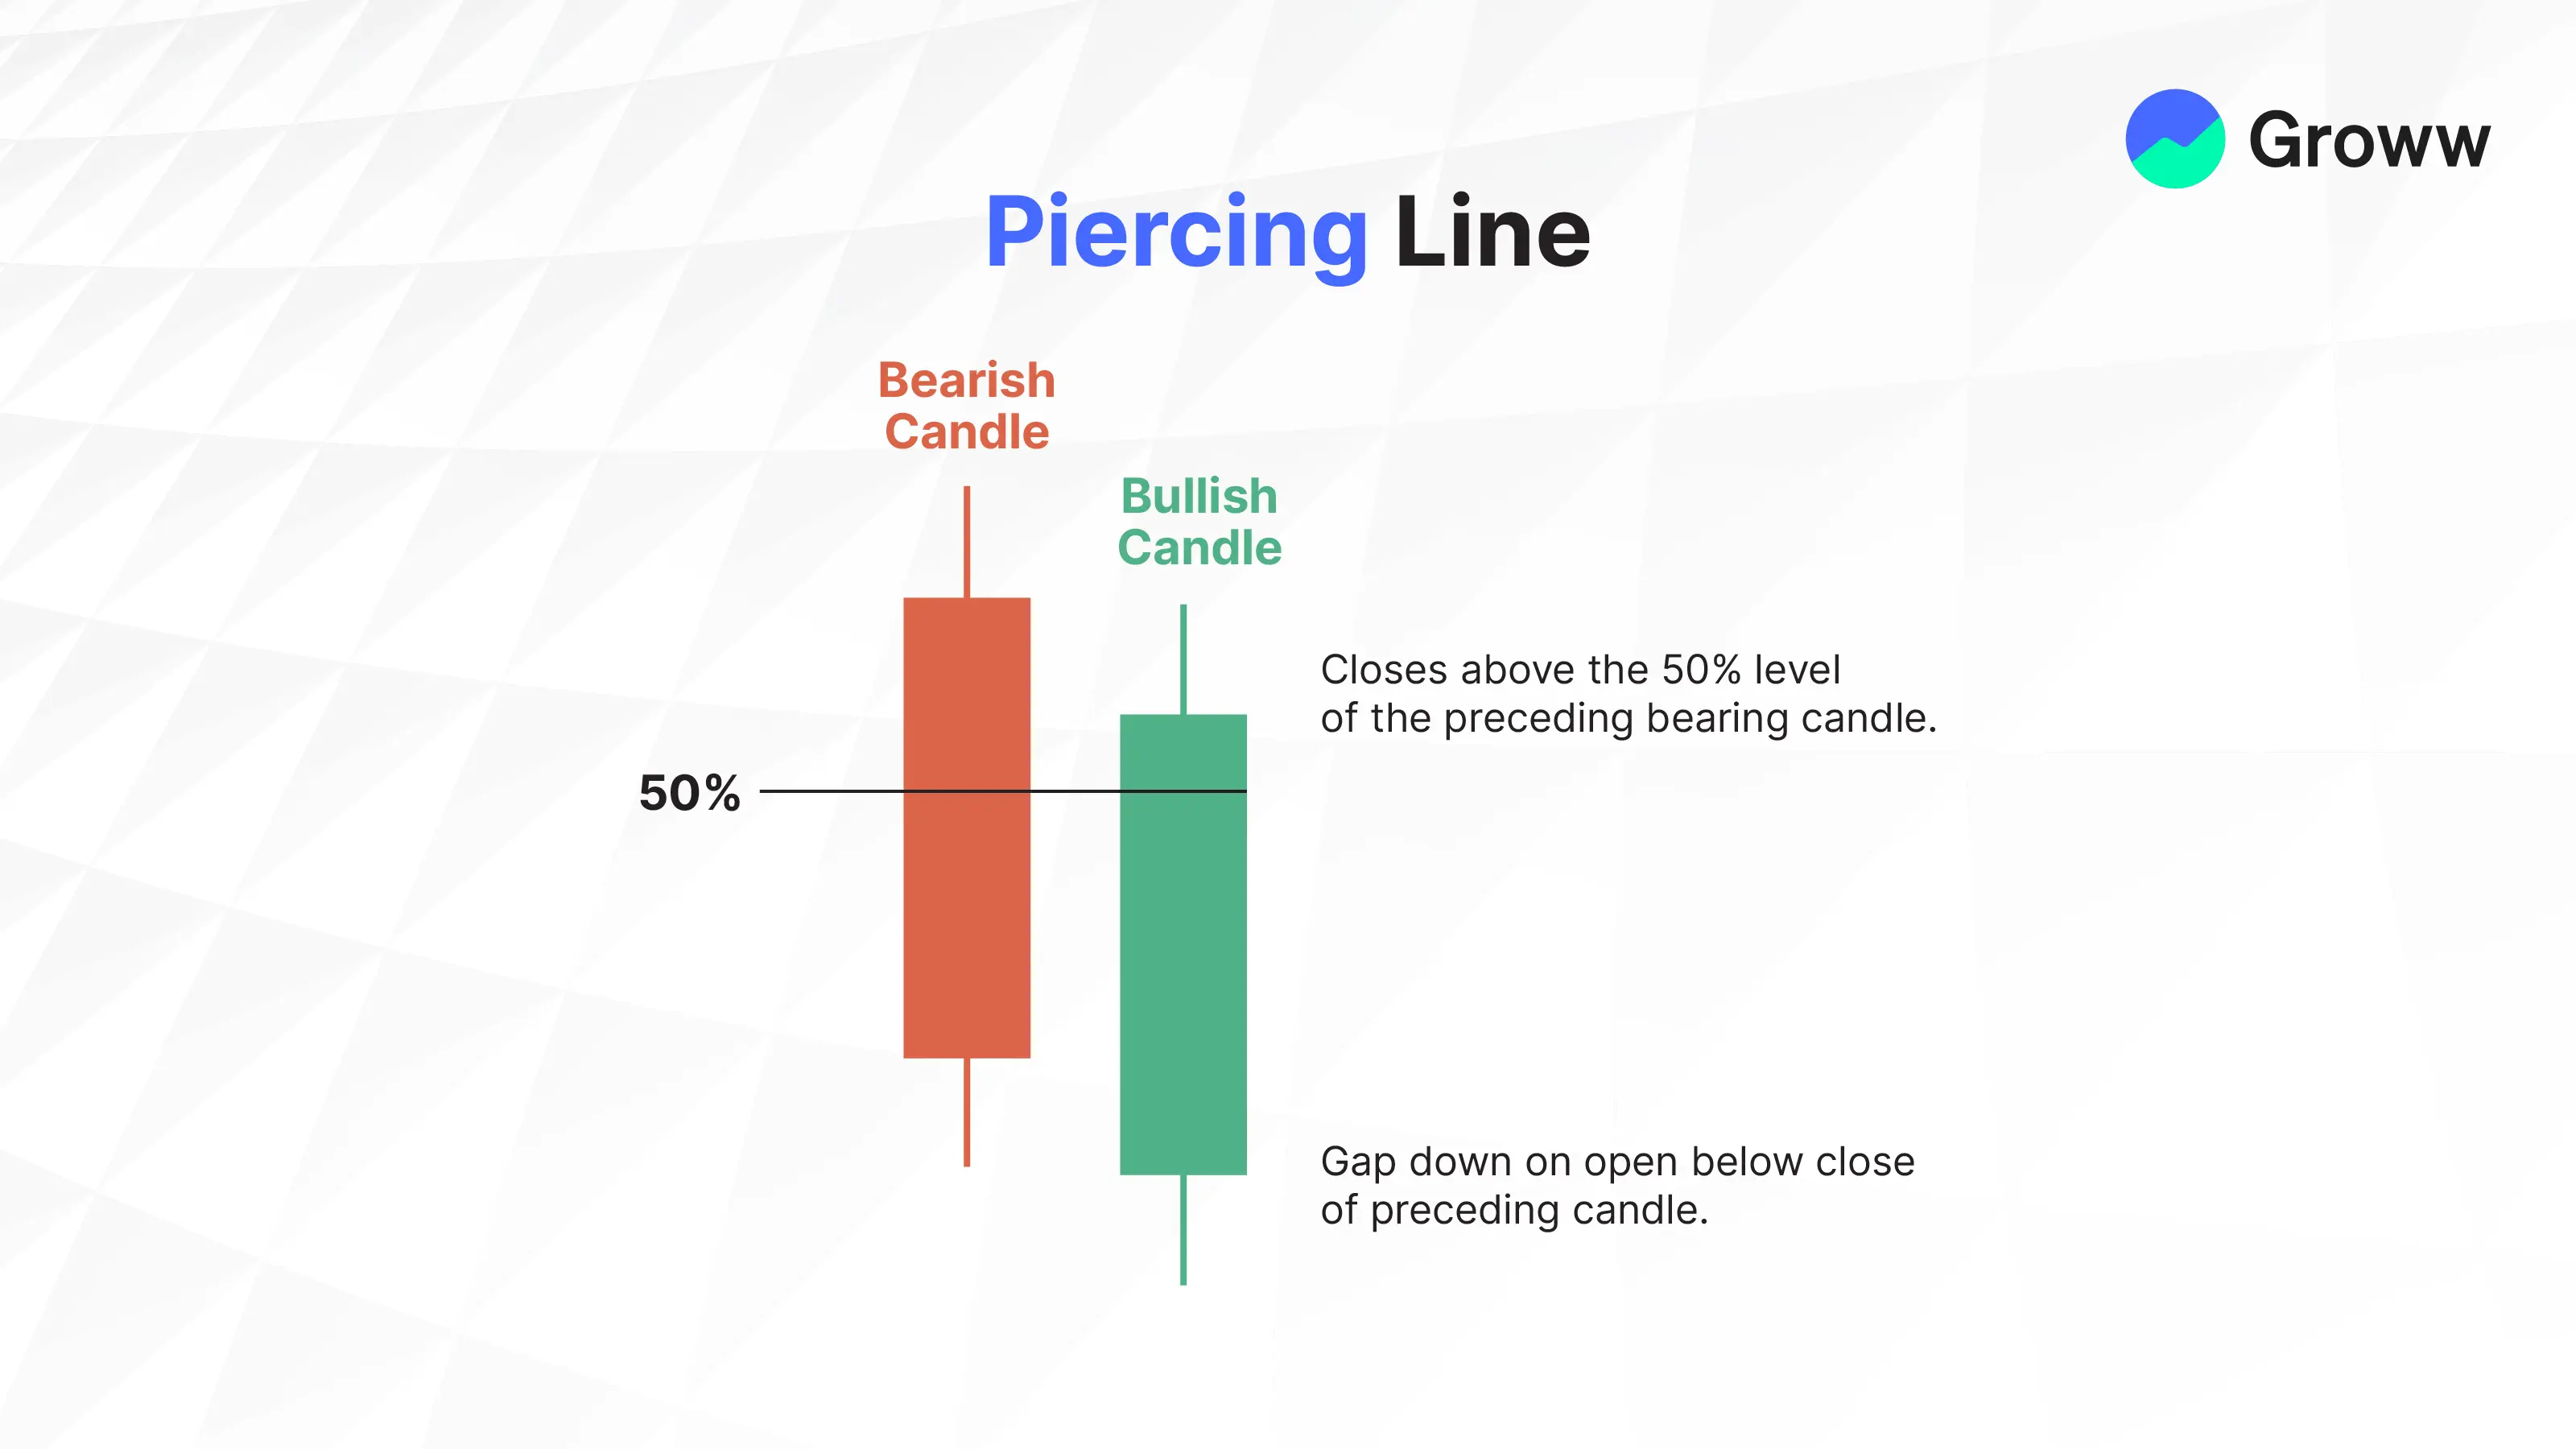
The Piercing Pattern
- Similar to bullish engulfing with some variations.
- The blue candle partially engulfs the red candle, with the engulfing being anywhere from 50% to less than 100%.
Alert: Risk takers may start trades on day two around the close, while low-risk traders may initiate trades the day after the second day (after the blue candle forms).
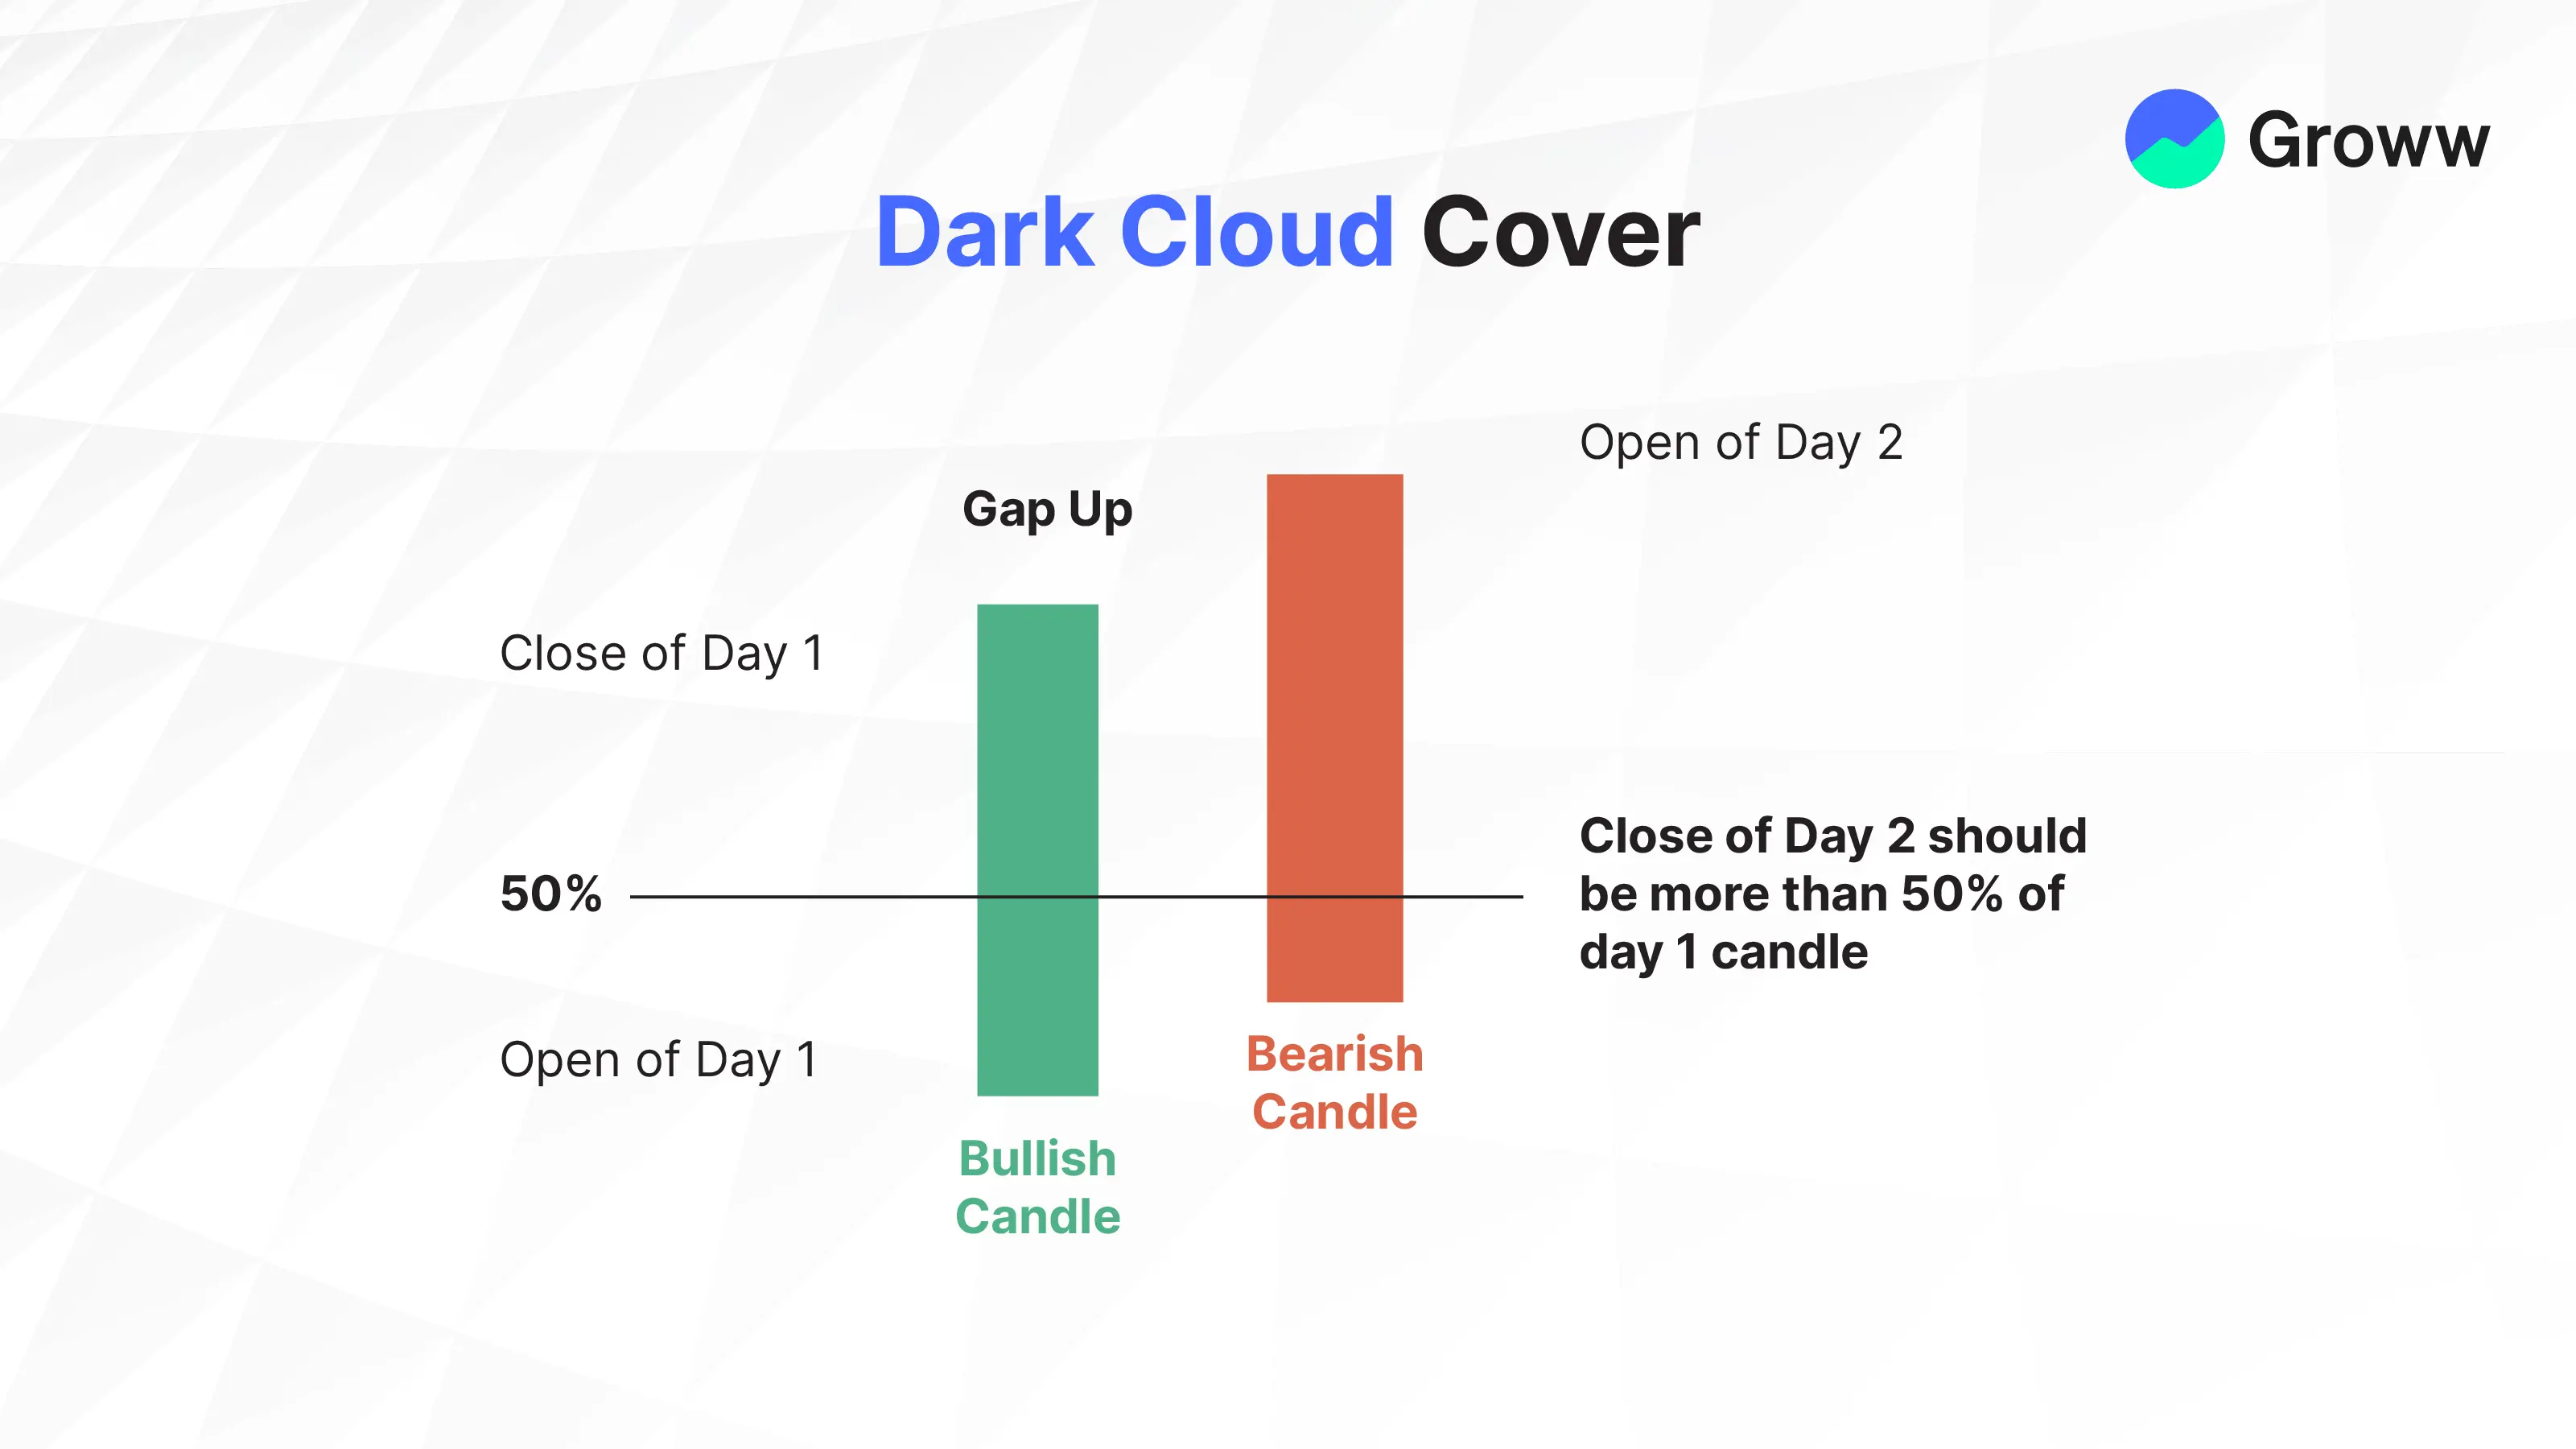
The Dark Cloud Cover
- Similar to bearish engulfing patterns with some twists.
- In this case, the red candle will engulf about 50-100% of the blue candle.
- The trade setup is similar to the bearish engulfing pattern.
Alert: It is the inverse of a piercing pattern, and traders should plan accordingly.
Morning Star & Evening Star
Morning Star Pattern
- Happens at the bottom of a downtrend.
- Consists of three candles:
- Long bearish candle
- Small body candle (indecisive)
- A strong bullish candle that closes near or above the open of the first candle.
- It is thus a bullish reversal pattern, indicating a shift from selling pressure to buying momentum. The ideal pattern will feature a gap down between the first and second candles, and a gap up between the second and third candles.
- Trading volumes will ideally increase over the three days, especially on the third day, thereby helping confirm a strong reversal.
- The entry point is mainly after the third bullish candle closes, or even at the open of the next candle, upon the confirmation of the reversal.
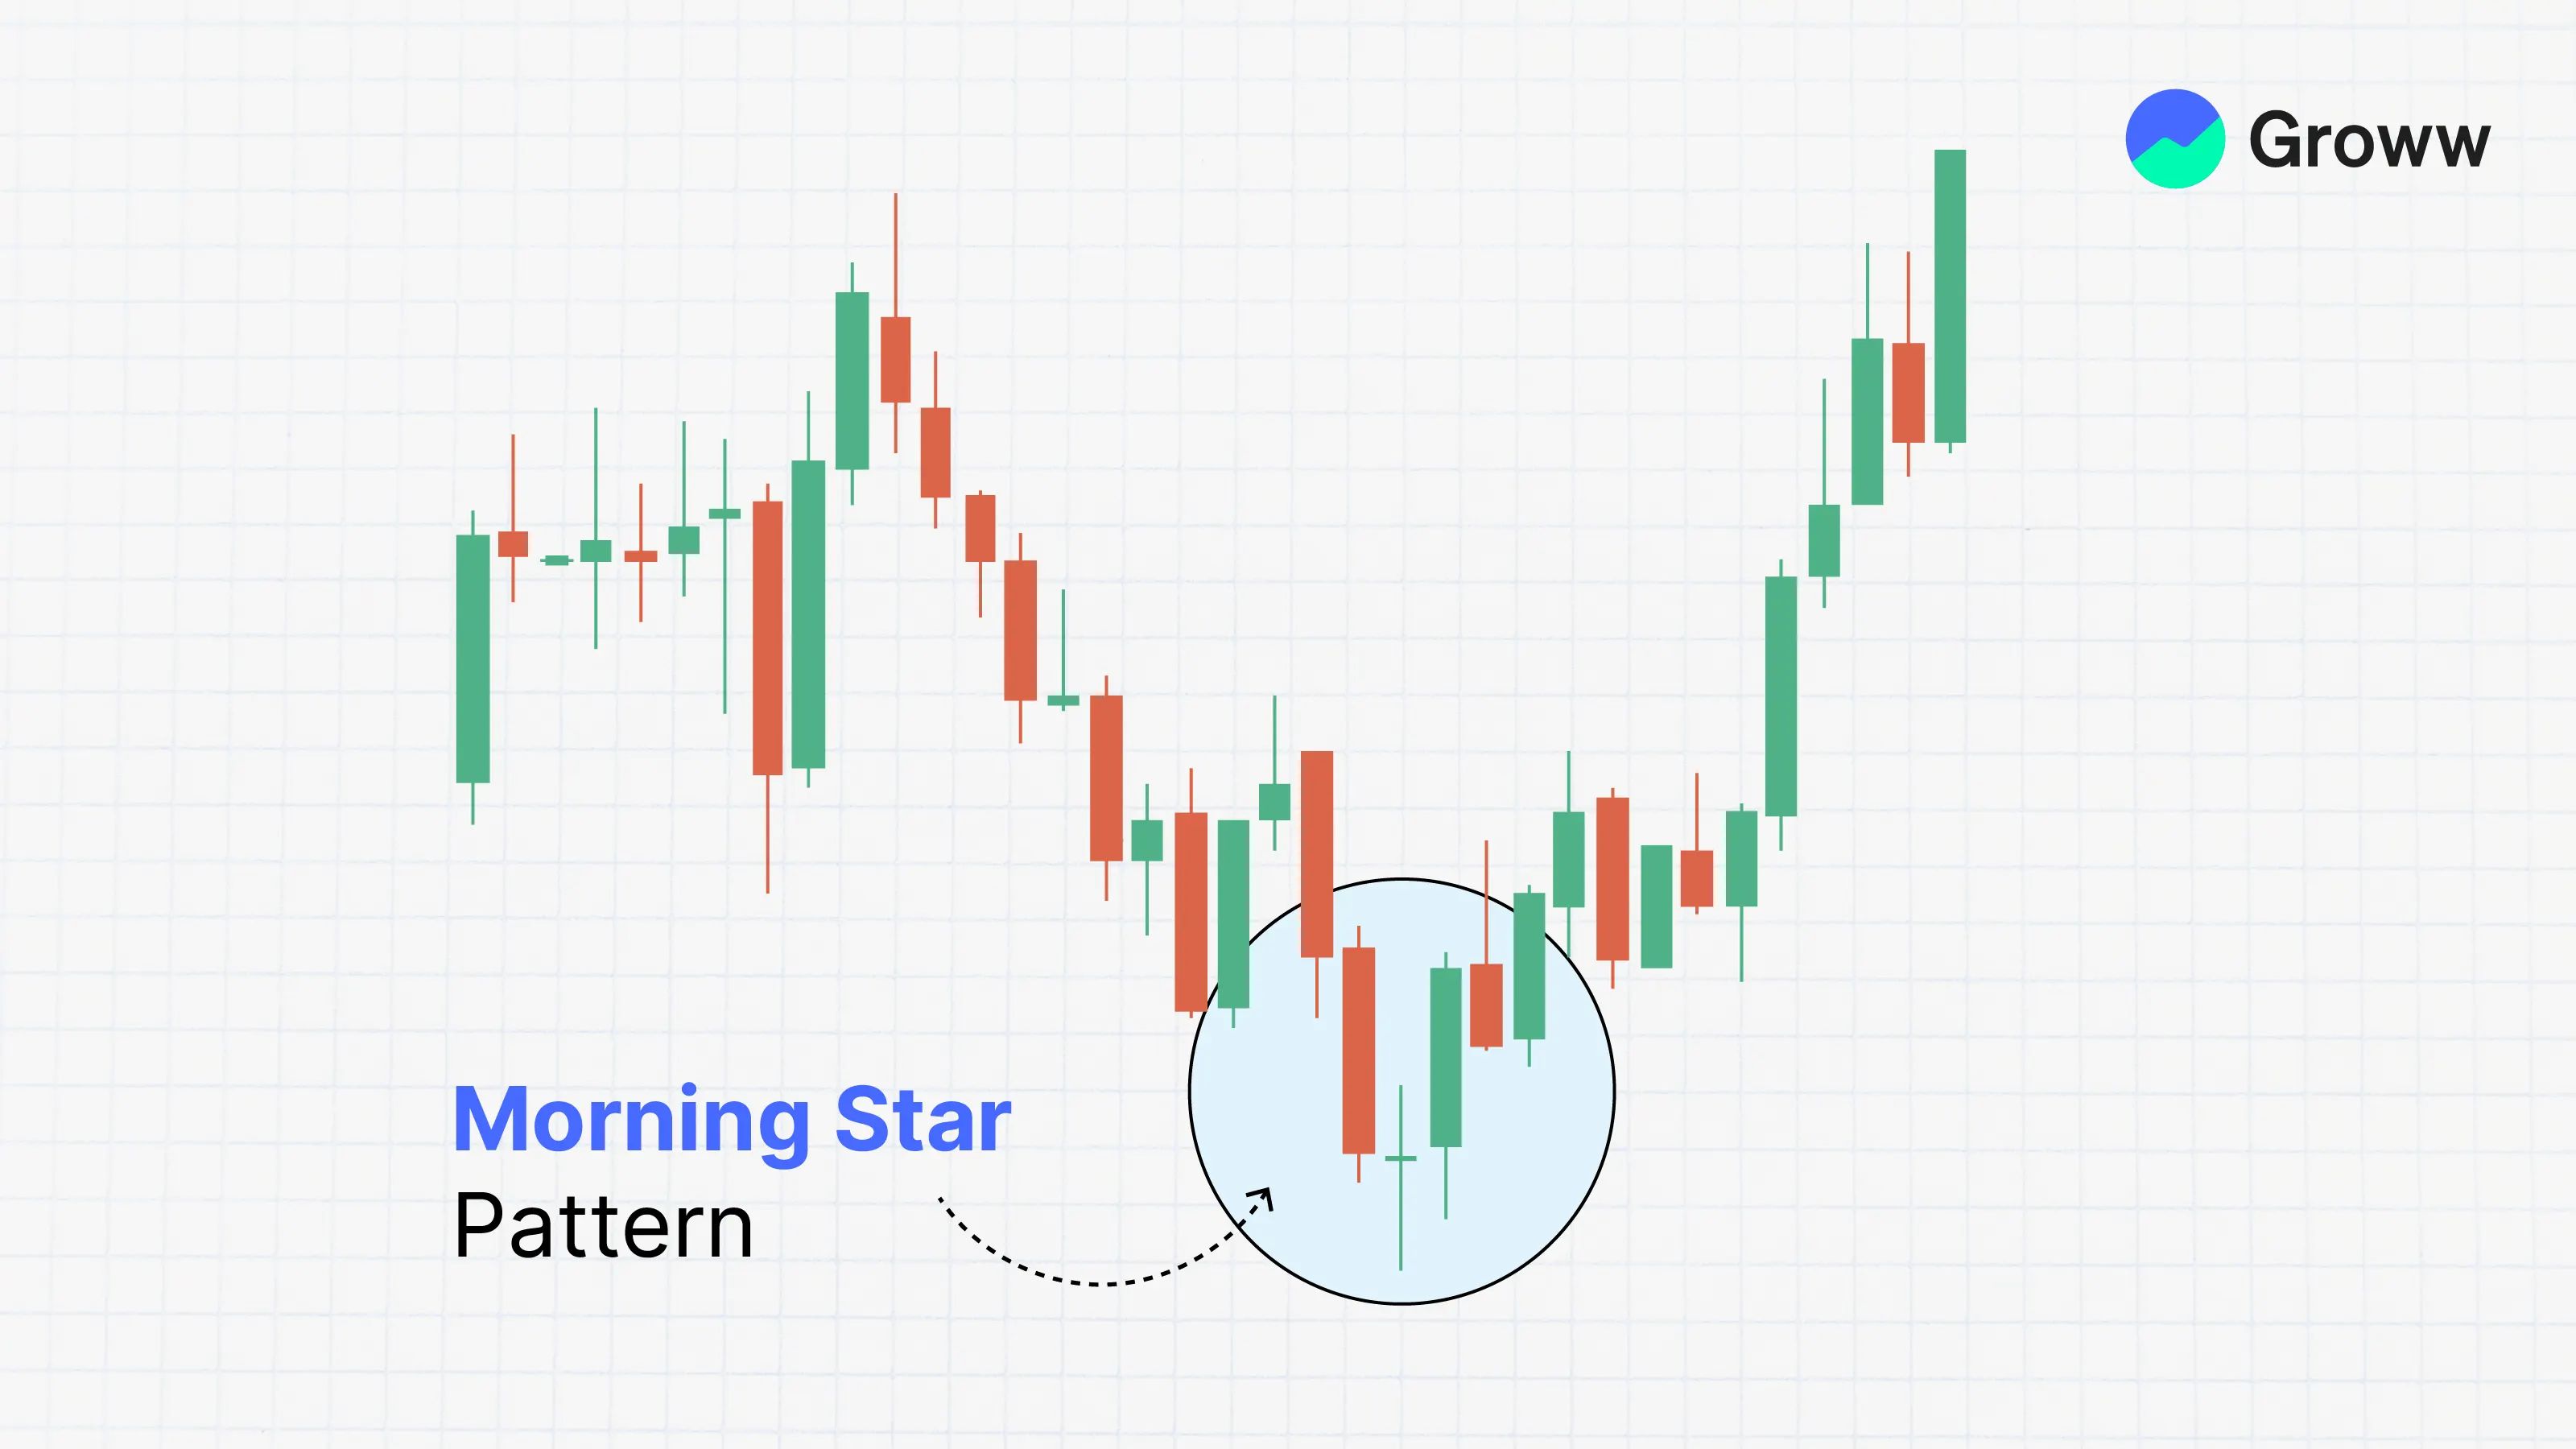
Alert: Signal of the beginning of an uptrend.
The Evening Star Pattern (Bearish Reversal):
- This pattern occurs at the top of an uptrend and is the inverse of the Morning Star.
- It is a three-candlestick pattern of bearish reversal that comes with the following components:
- Day 1 - Bullish Candle: A long candle indicating robust buying power and the current uptrend’s extension
- Day 2 - Indecision Candle: This is a candle with a small body (like a spinning top or Doji) that may gap up, signalling hesitation among buyers and a potential momentum loss.
- Day 3 - Bearish Candle: There is a strong candle gapping lower and closing into the first candle’s body, thereby indicating higher selling pressure and a possible reversal of the trend.
- The pattern shows a fading bullish momentum on day one, to sellers steadily outstripping buyers on day two, and finally, on day three, an exhaustion of the uptrend and a possible start of the subsequent downtrend.
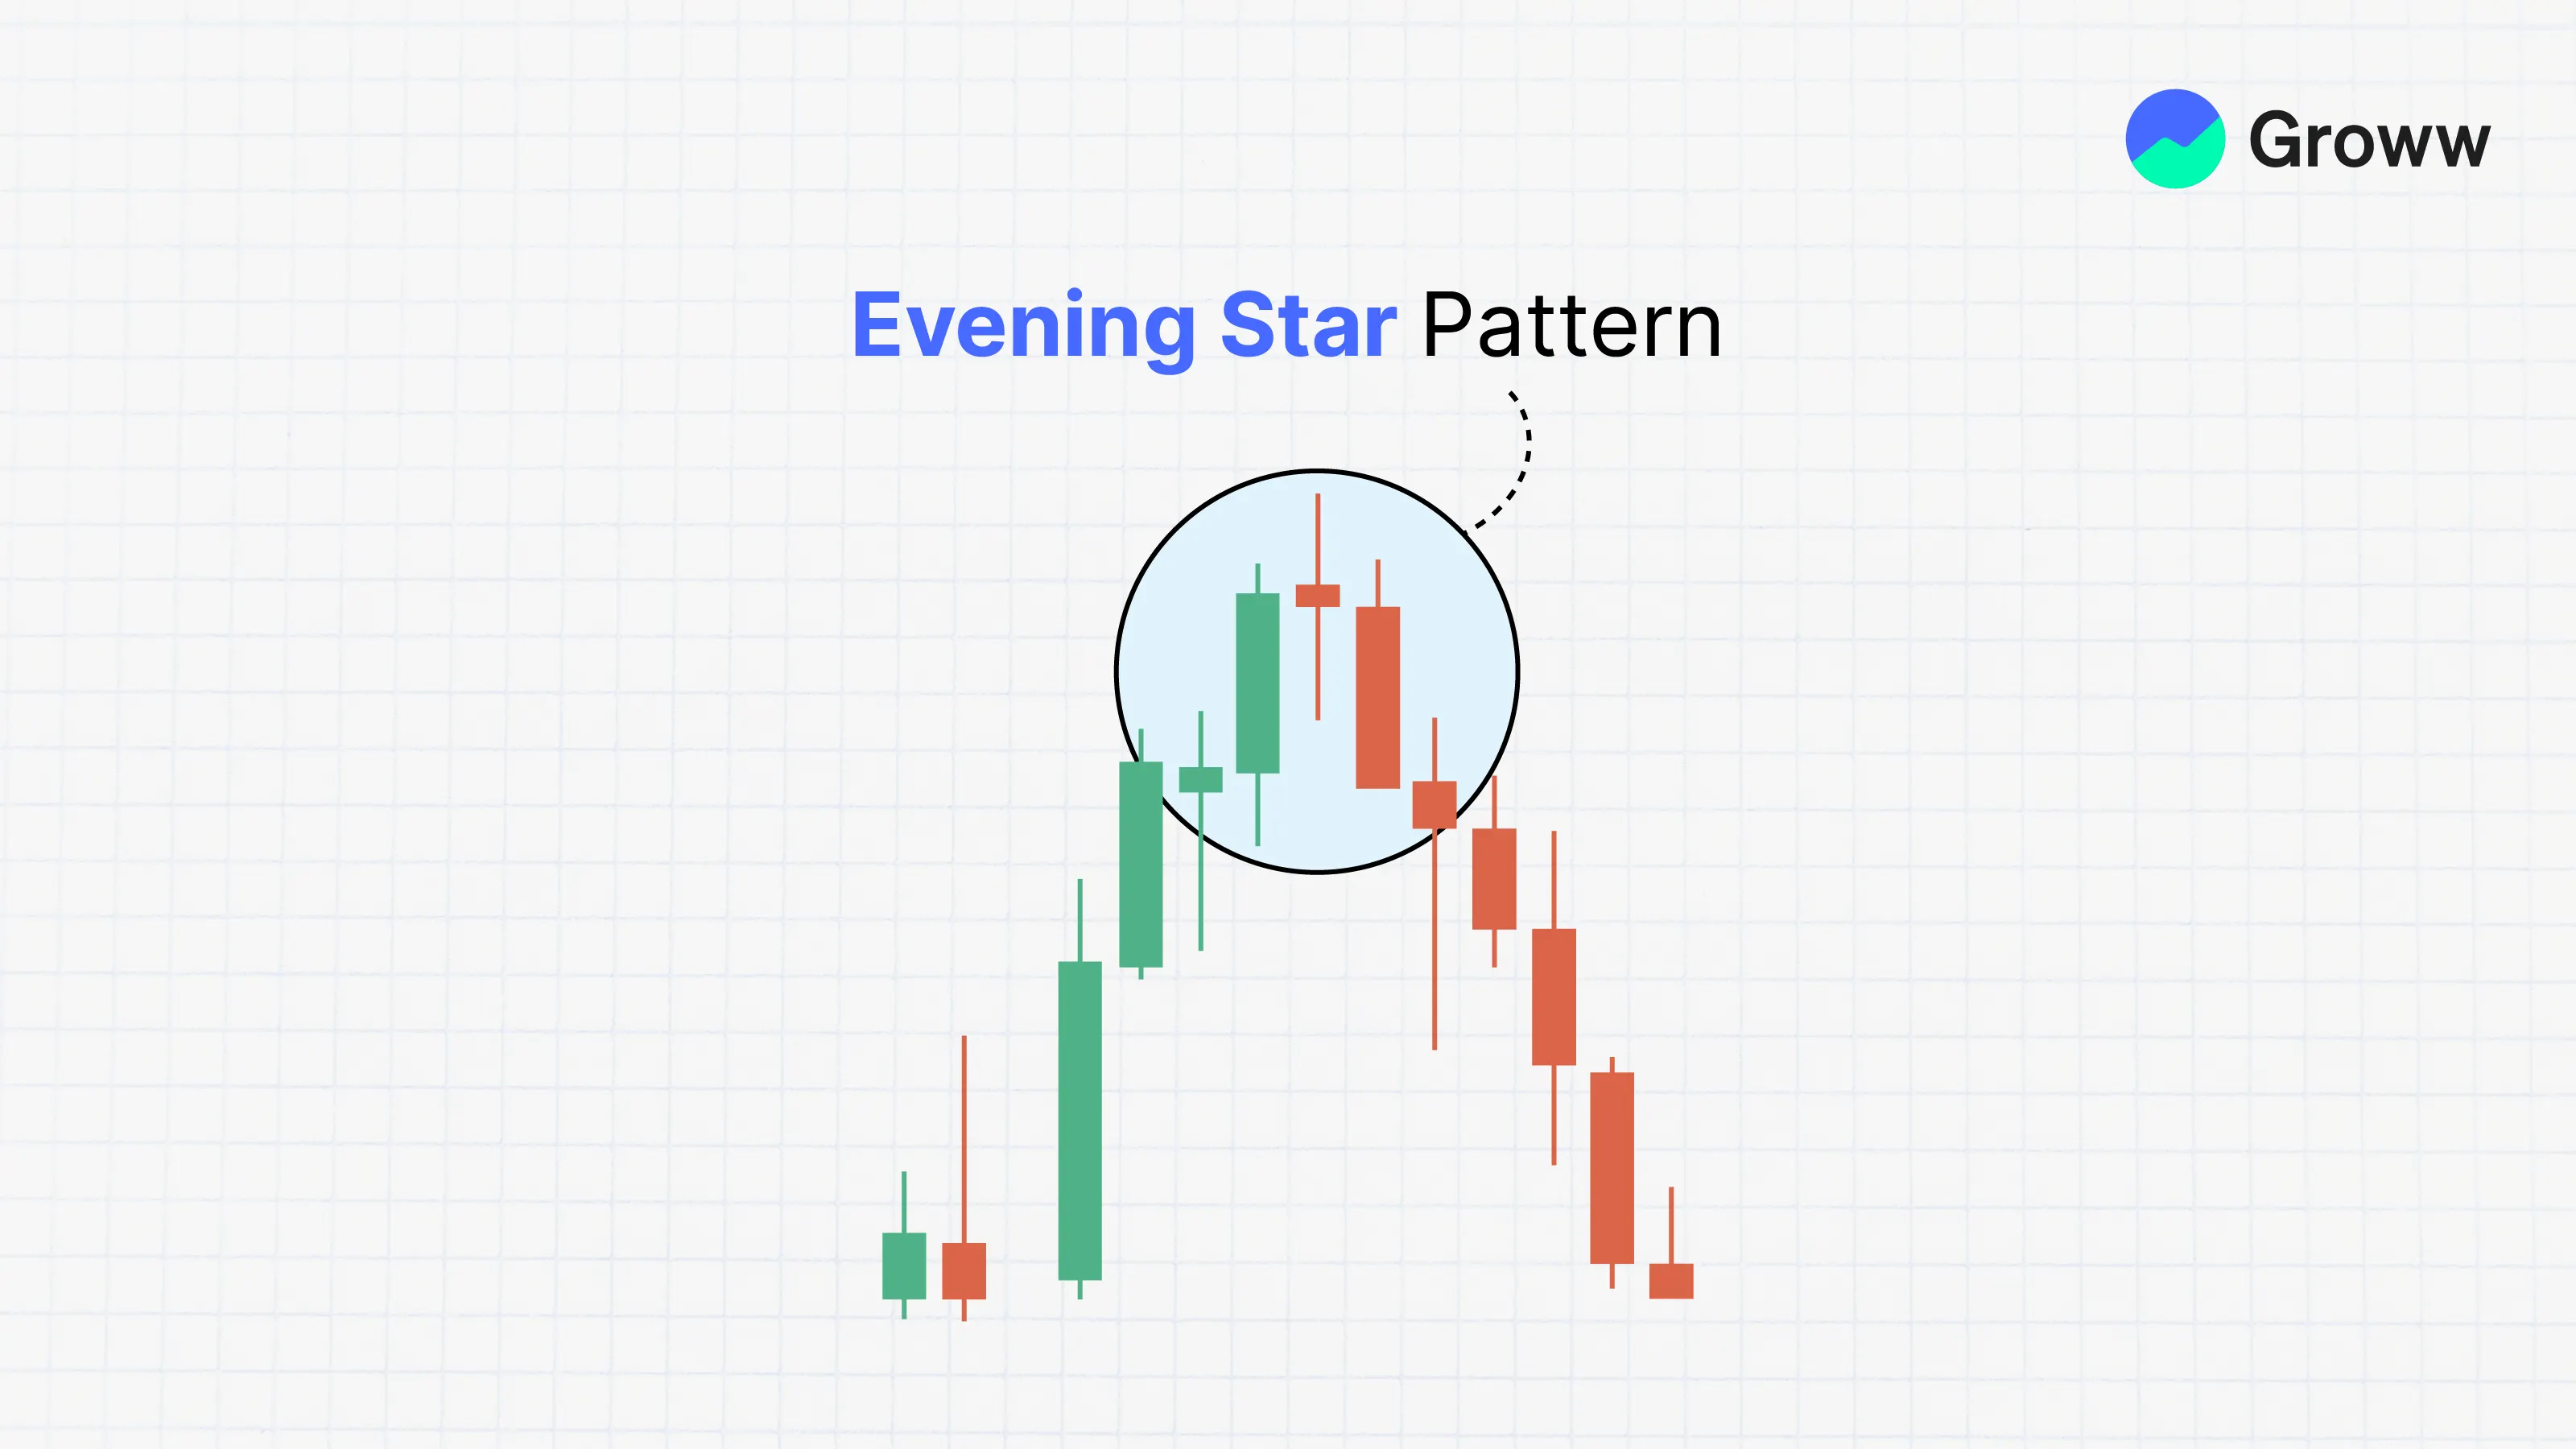
Alert: Signals the beginning of a downtrend and the takeover of control by sellers.
Three Inside Up/Down
Three Inside Up Pattern (Bullish Reversal):
- The Three Inside Up pattern is a bullish reversal multi-candlestick pattern. It signals the possible end of a downtrend and the likely start of an uptrend. The pattern may signal a shift in market sentiment as buyers begin to take control.
- Three consecutive candles appear at the close of a clear downtrend. Now, the key components are the following:
- First Bearish Candle: A long candle that supports the current downtrend and highlights robust selling pressure.
- Second Bullish Candle: A small candle which opens and then closes fully within the first candle’s body. This shows indecision in the market and a possible pause in the momentum for selling.
- Third Bullish Confirmation Candle: This is a large and strong candle closing above the first candle’s high. It confirms that buyers have definitively taken control and that the upcoming reversal is imminent.
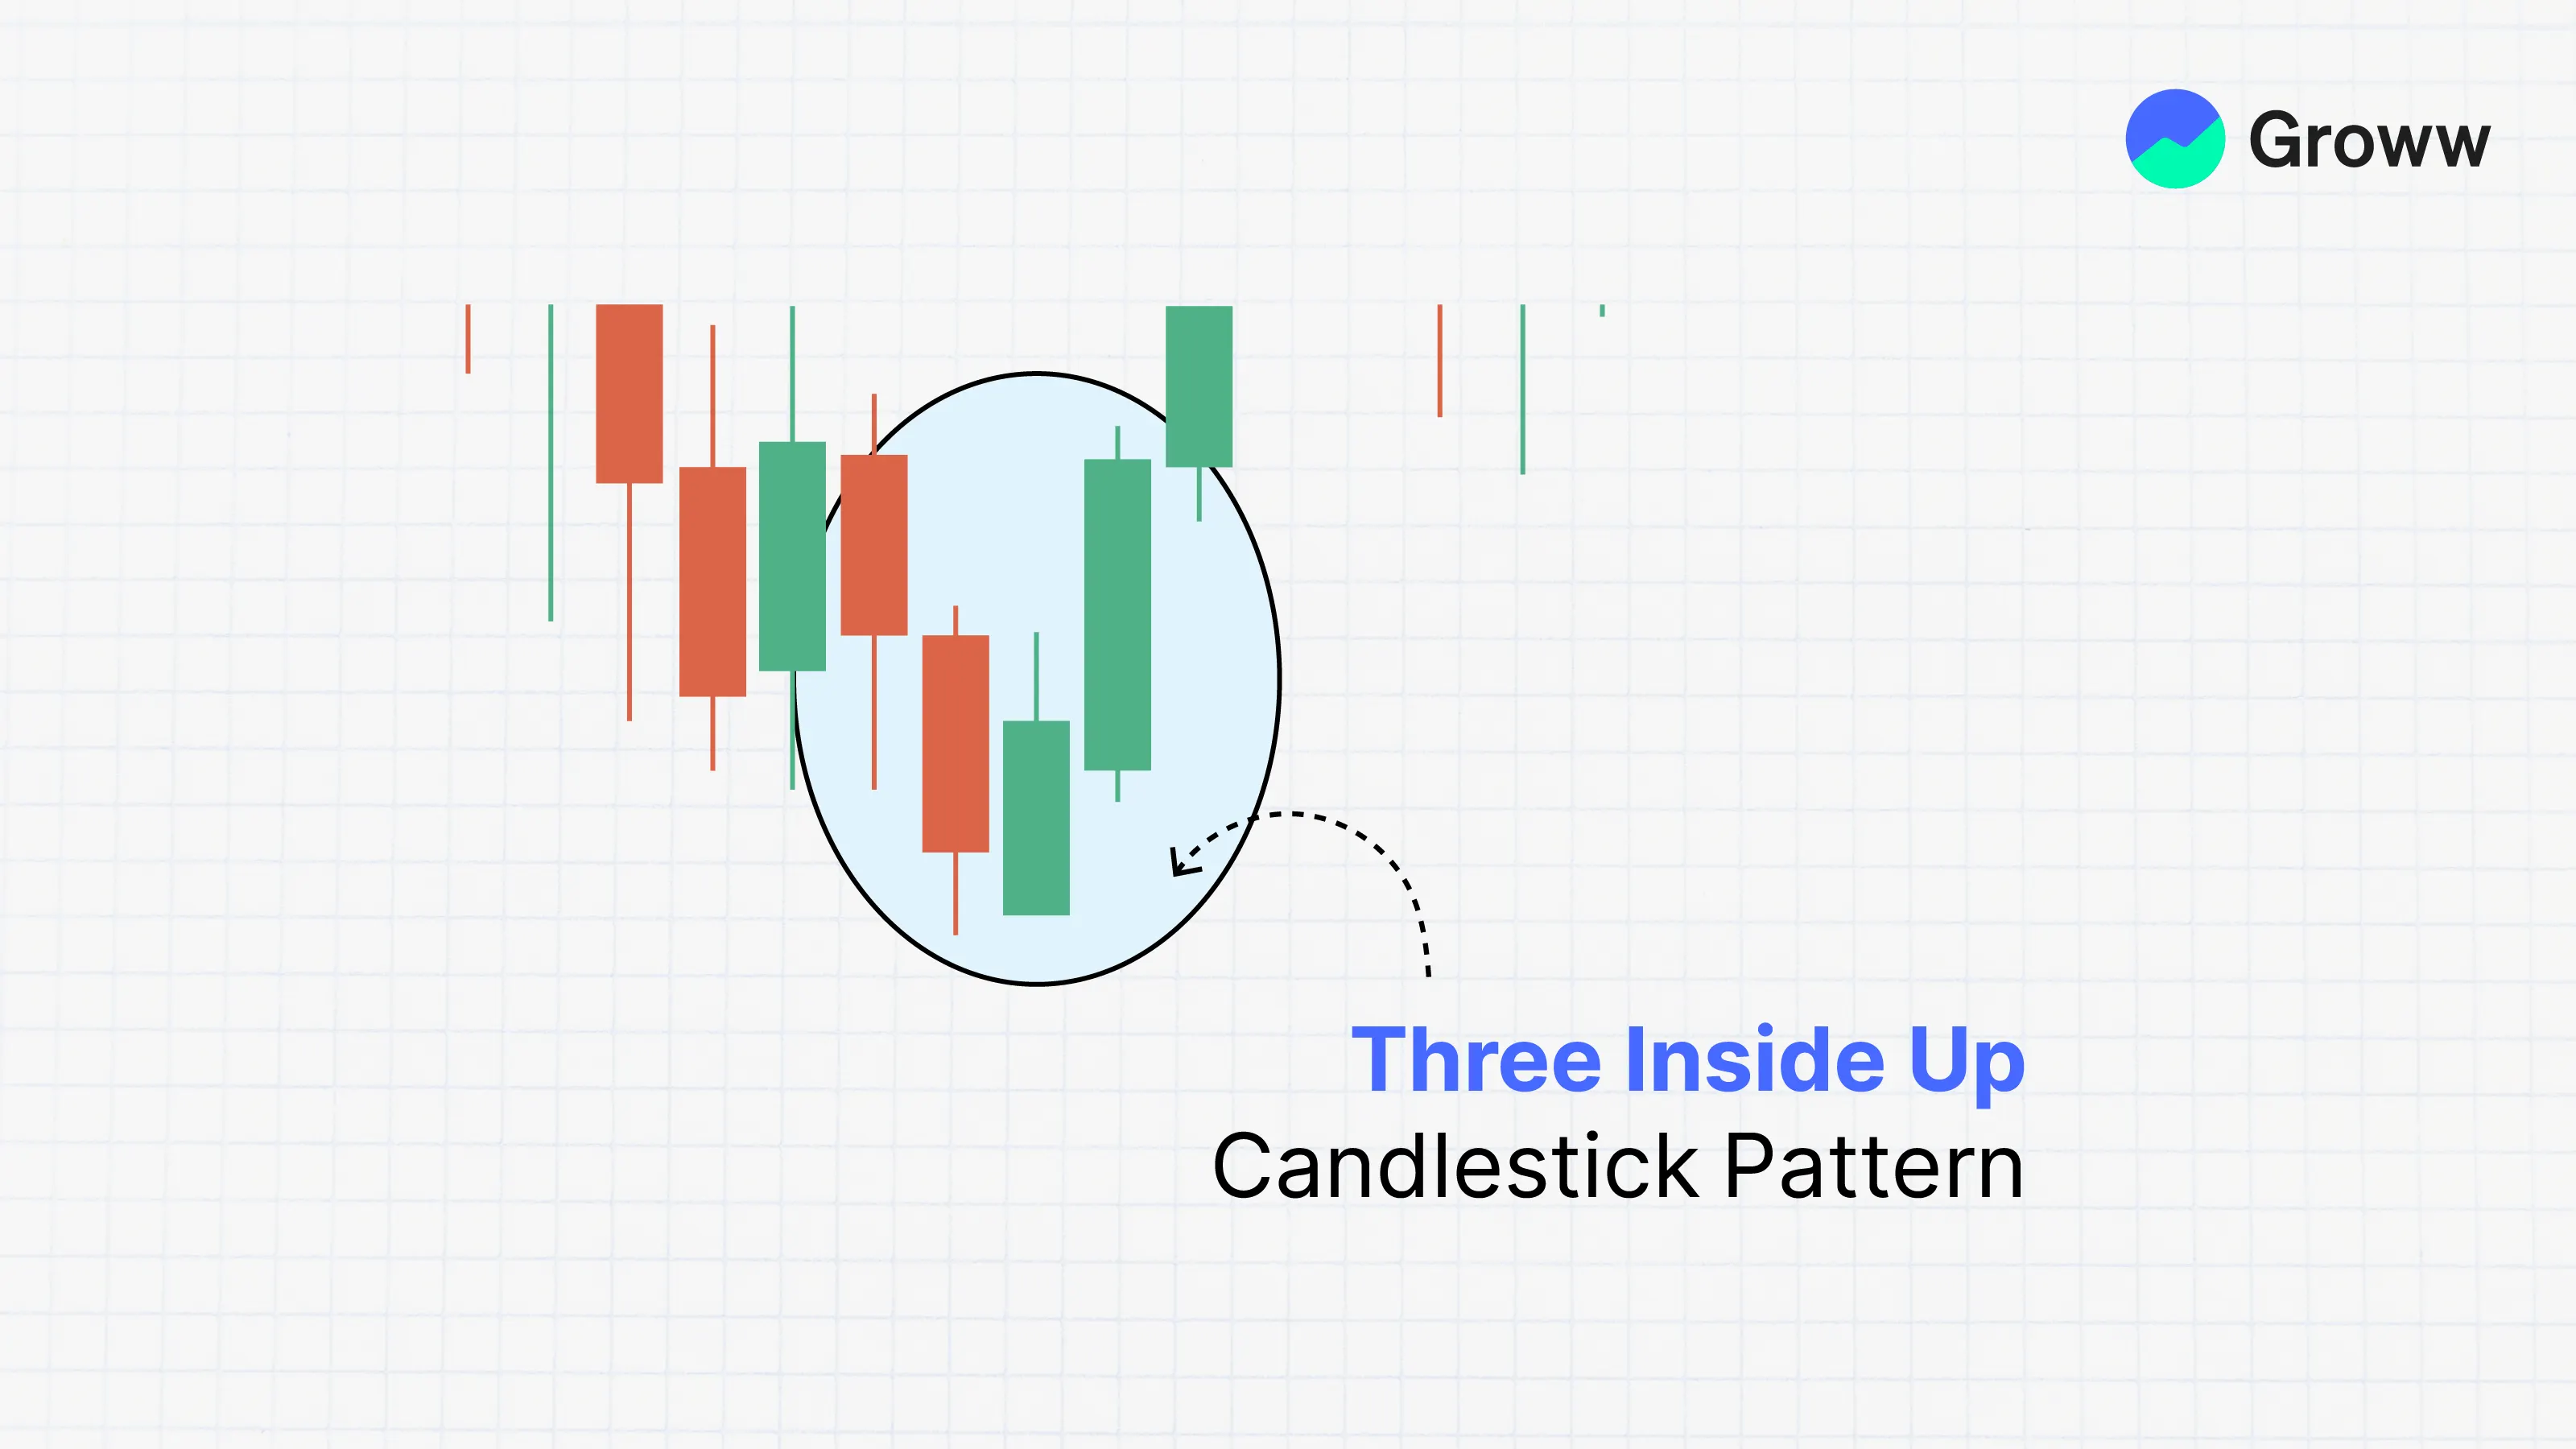
Alert: A long buy position may be entered after the third candle closes over the high of the first candle, thereby confirming the reversal in question.
Three Inside Down Pattern (Bearish Reversal):
- This is a robust bearish reversal signal that occurs at the top of an uptrend and signals a possible shift from bullish to bearish momentum.
- The three candles that define the pattern are the following:
- A long bullish candle that continues the current uptrend.
- A small bearish candle with the body entirely within the first candle’s body.
- A bearish candle that closes below the second candle’s close, thereby confirming the momentum reversal.
-
- So, there is first robust buying pressure to drive prices up, followed by a pause and weakening bullish momentum, while the third candle is the definitive confirmation of bears taking control.
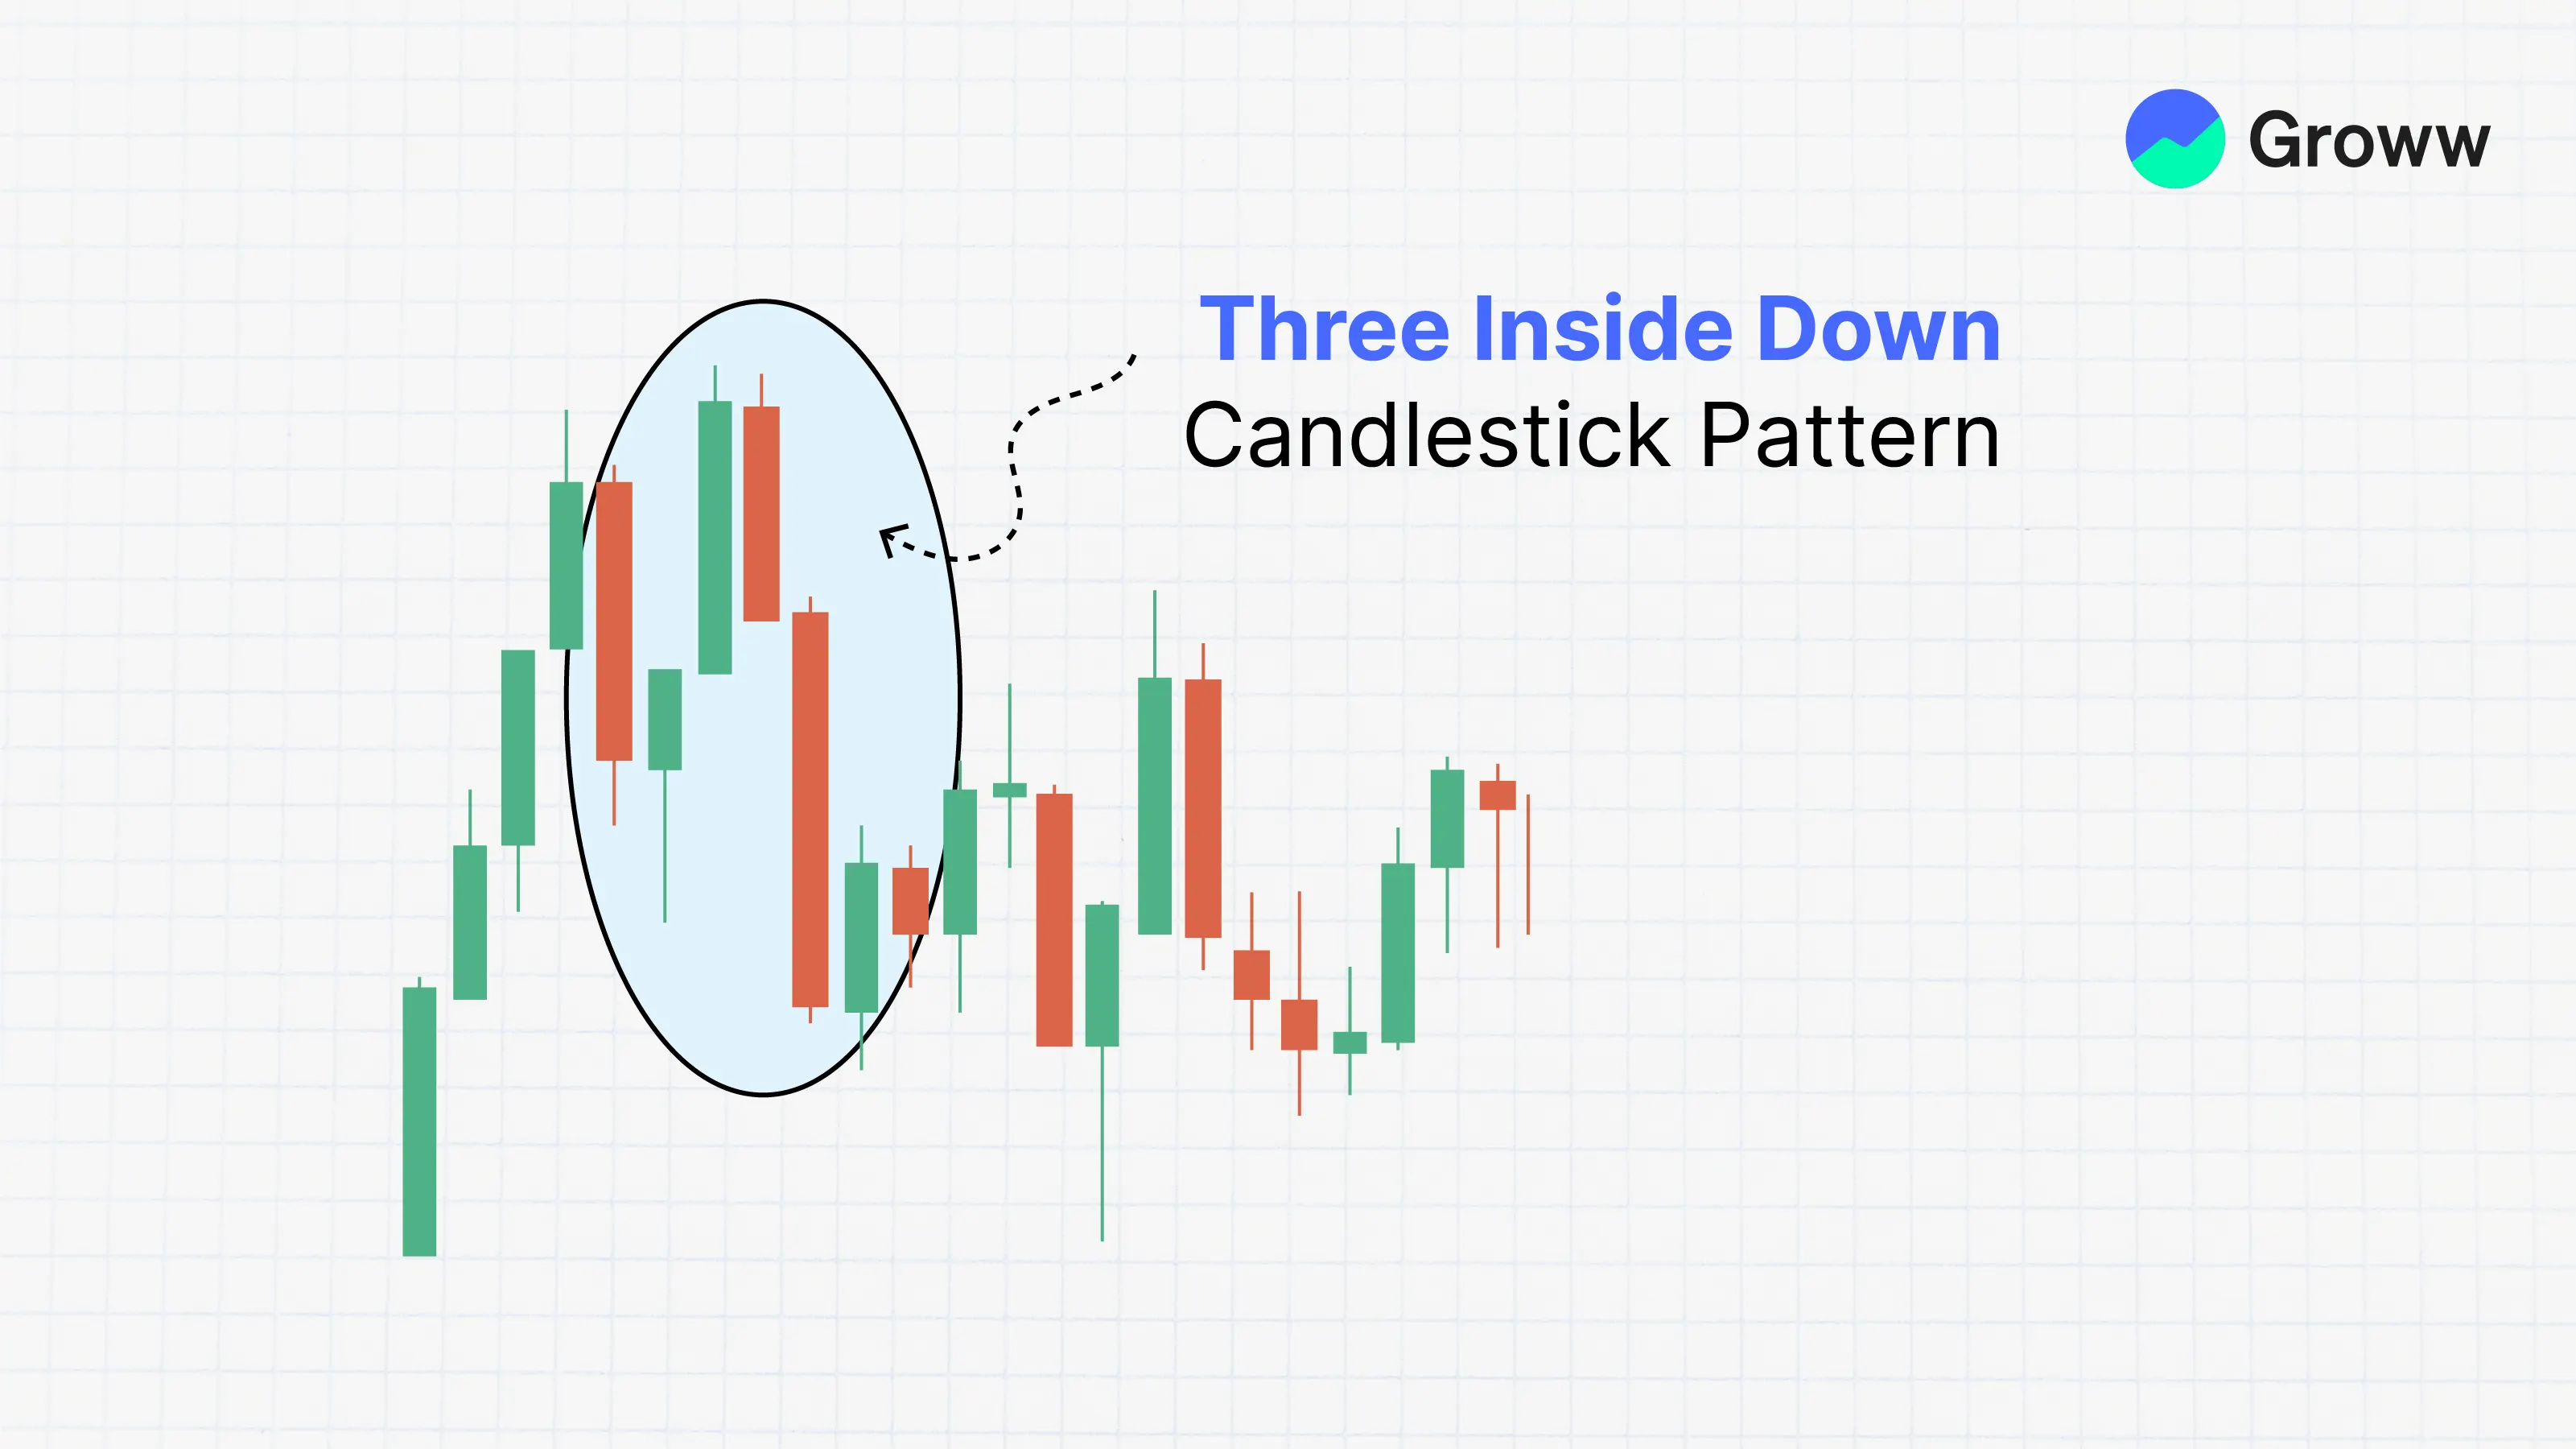
Alert: Traders often enter a short position after the close of the third candle. It is best confirmed by high trading volumes or other indicators, such as RSI.
Three White Soldiers & Three Black Crows
Three White Soldiers Pattern (Strong Bullish Reversal)
- The Three White Soldiers is a robust bullish reversal pattern that forms after a downtrend and signals a shift to an uptrend, characterised by three consecutive long candlesticks.
- Each of these candles opens within the body of the previous candle and closes progressively higher, indicating robust control of buyers and possible entry for longer positions.
- Each candle also closes higher than the previous one, forming an upward movement that resembles a staircase. They also have upper and lower shadows (wicks), which are small at times, indicating greater buyer control.

Alert: Indicates buyers taking over, making it a good time to take up long (buy) positions, especially at the start of the next session.
Three Black Crows Pattern (Strong Bearish Reversal)
- The Three Black Crows pattern indicates a robust bearish reversal, appearing as three consecutive long candles with small shadows. Each of them opens within the body of the previous candle and closes lower, indicating stronger seller control.
- There is a shift from bullish to bearish sentiment, indicating downward pressure after the initial rally.
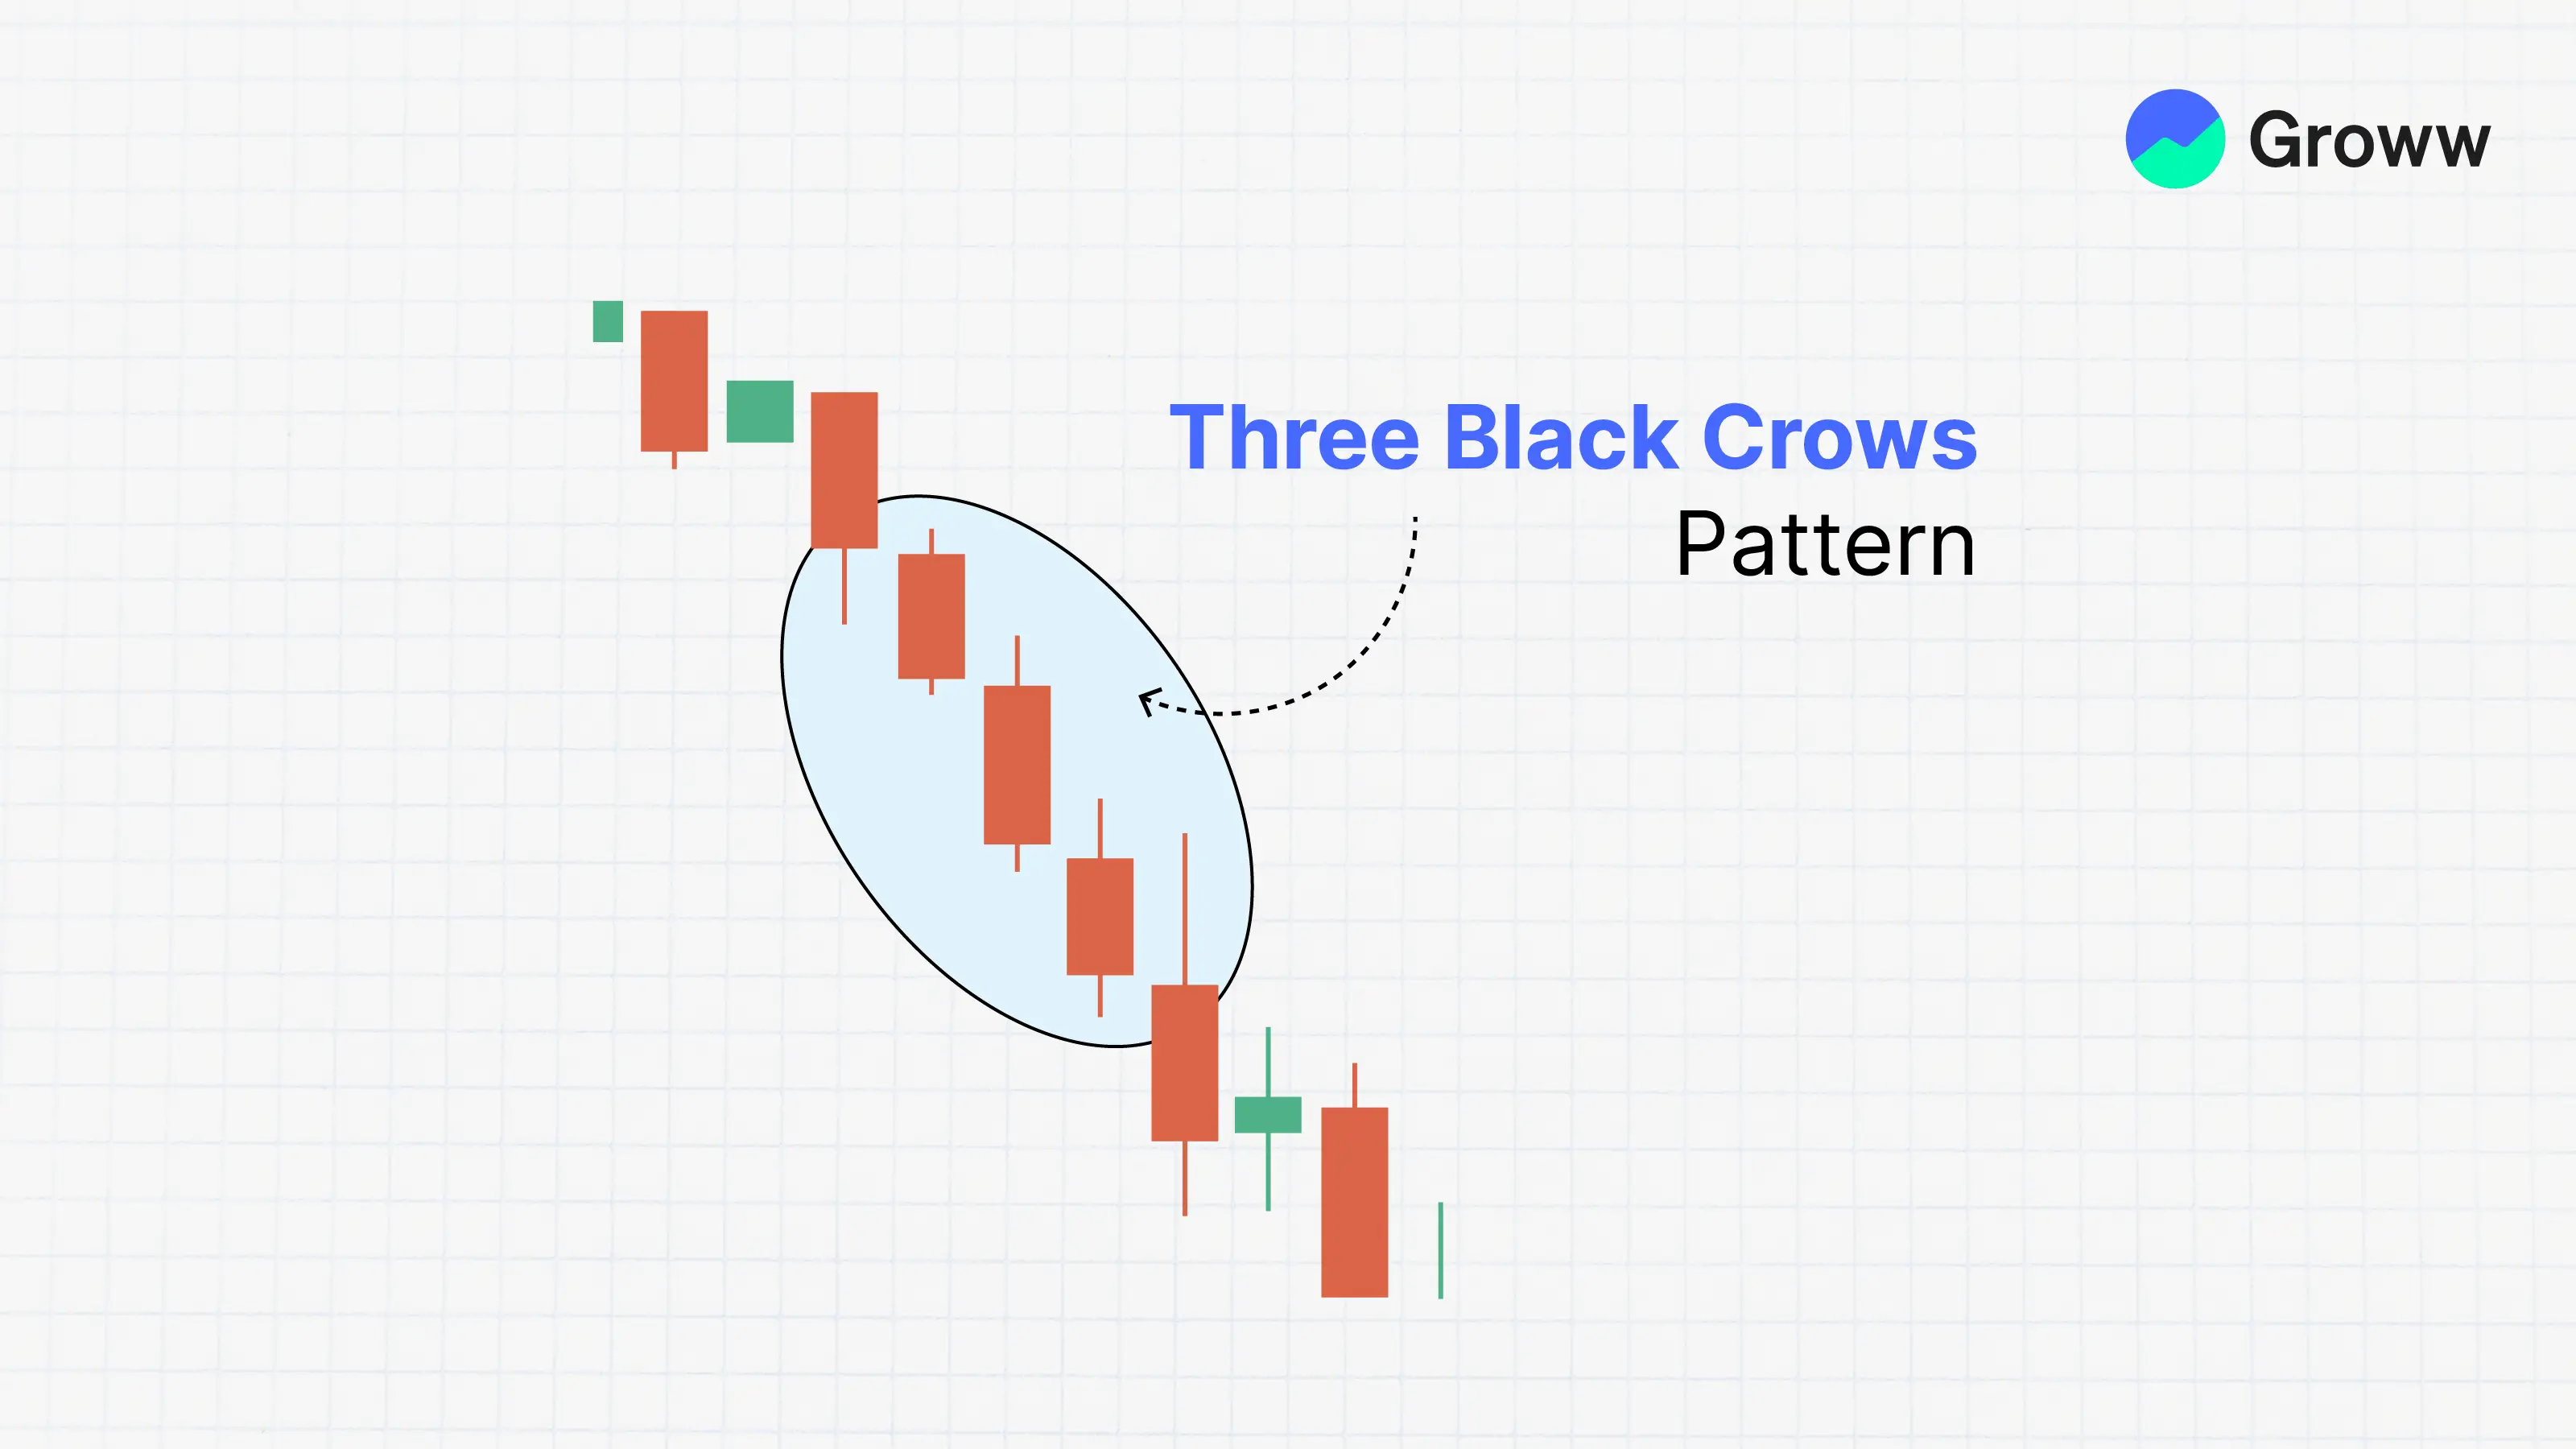
Alert: Sell orders are placed mostly below the third candle’s close. However, the pattern should be used in conjunction with other technical indicators, such as RSI or volume, to improve trading decisions.
Rising/Falling Three Methods
Rising Three Methods (Bullish Continuation)
- This is a bullish continuation pattern appearing during a well-established uptrend. This indicates a temporary momentum pause and a likely resumption of the upward price movement.
- This is a multi-candlestick pattern that has five candles. These are the following:
- A long and robust bullish candle confirming the uptrend.
- Three consecutive bearish candles with small bodies indicate a temporary correction or pause.
- A long and robust bullish candle closing above the first candle’s high, thereby indicating that buyers have retaken control and that the uptrend is starting again.
-
- Interestingly, this pattern shows a struggle between sellers and buyers, with the buyers ultimately emerging triumphant in maintaining dominance.
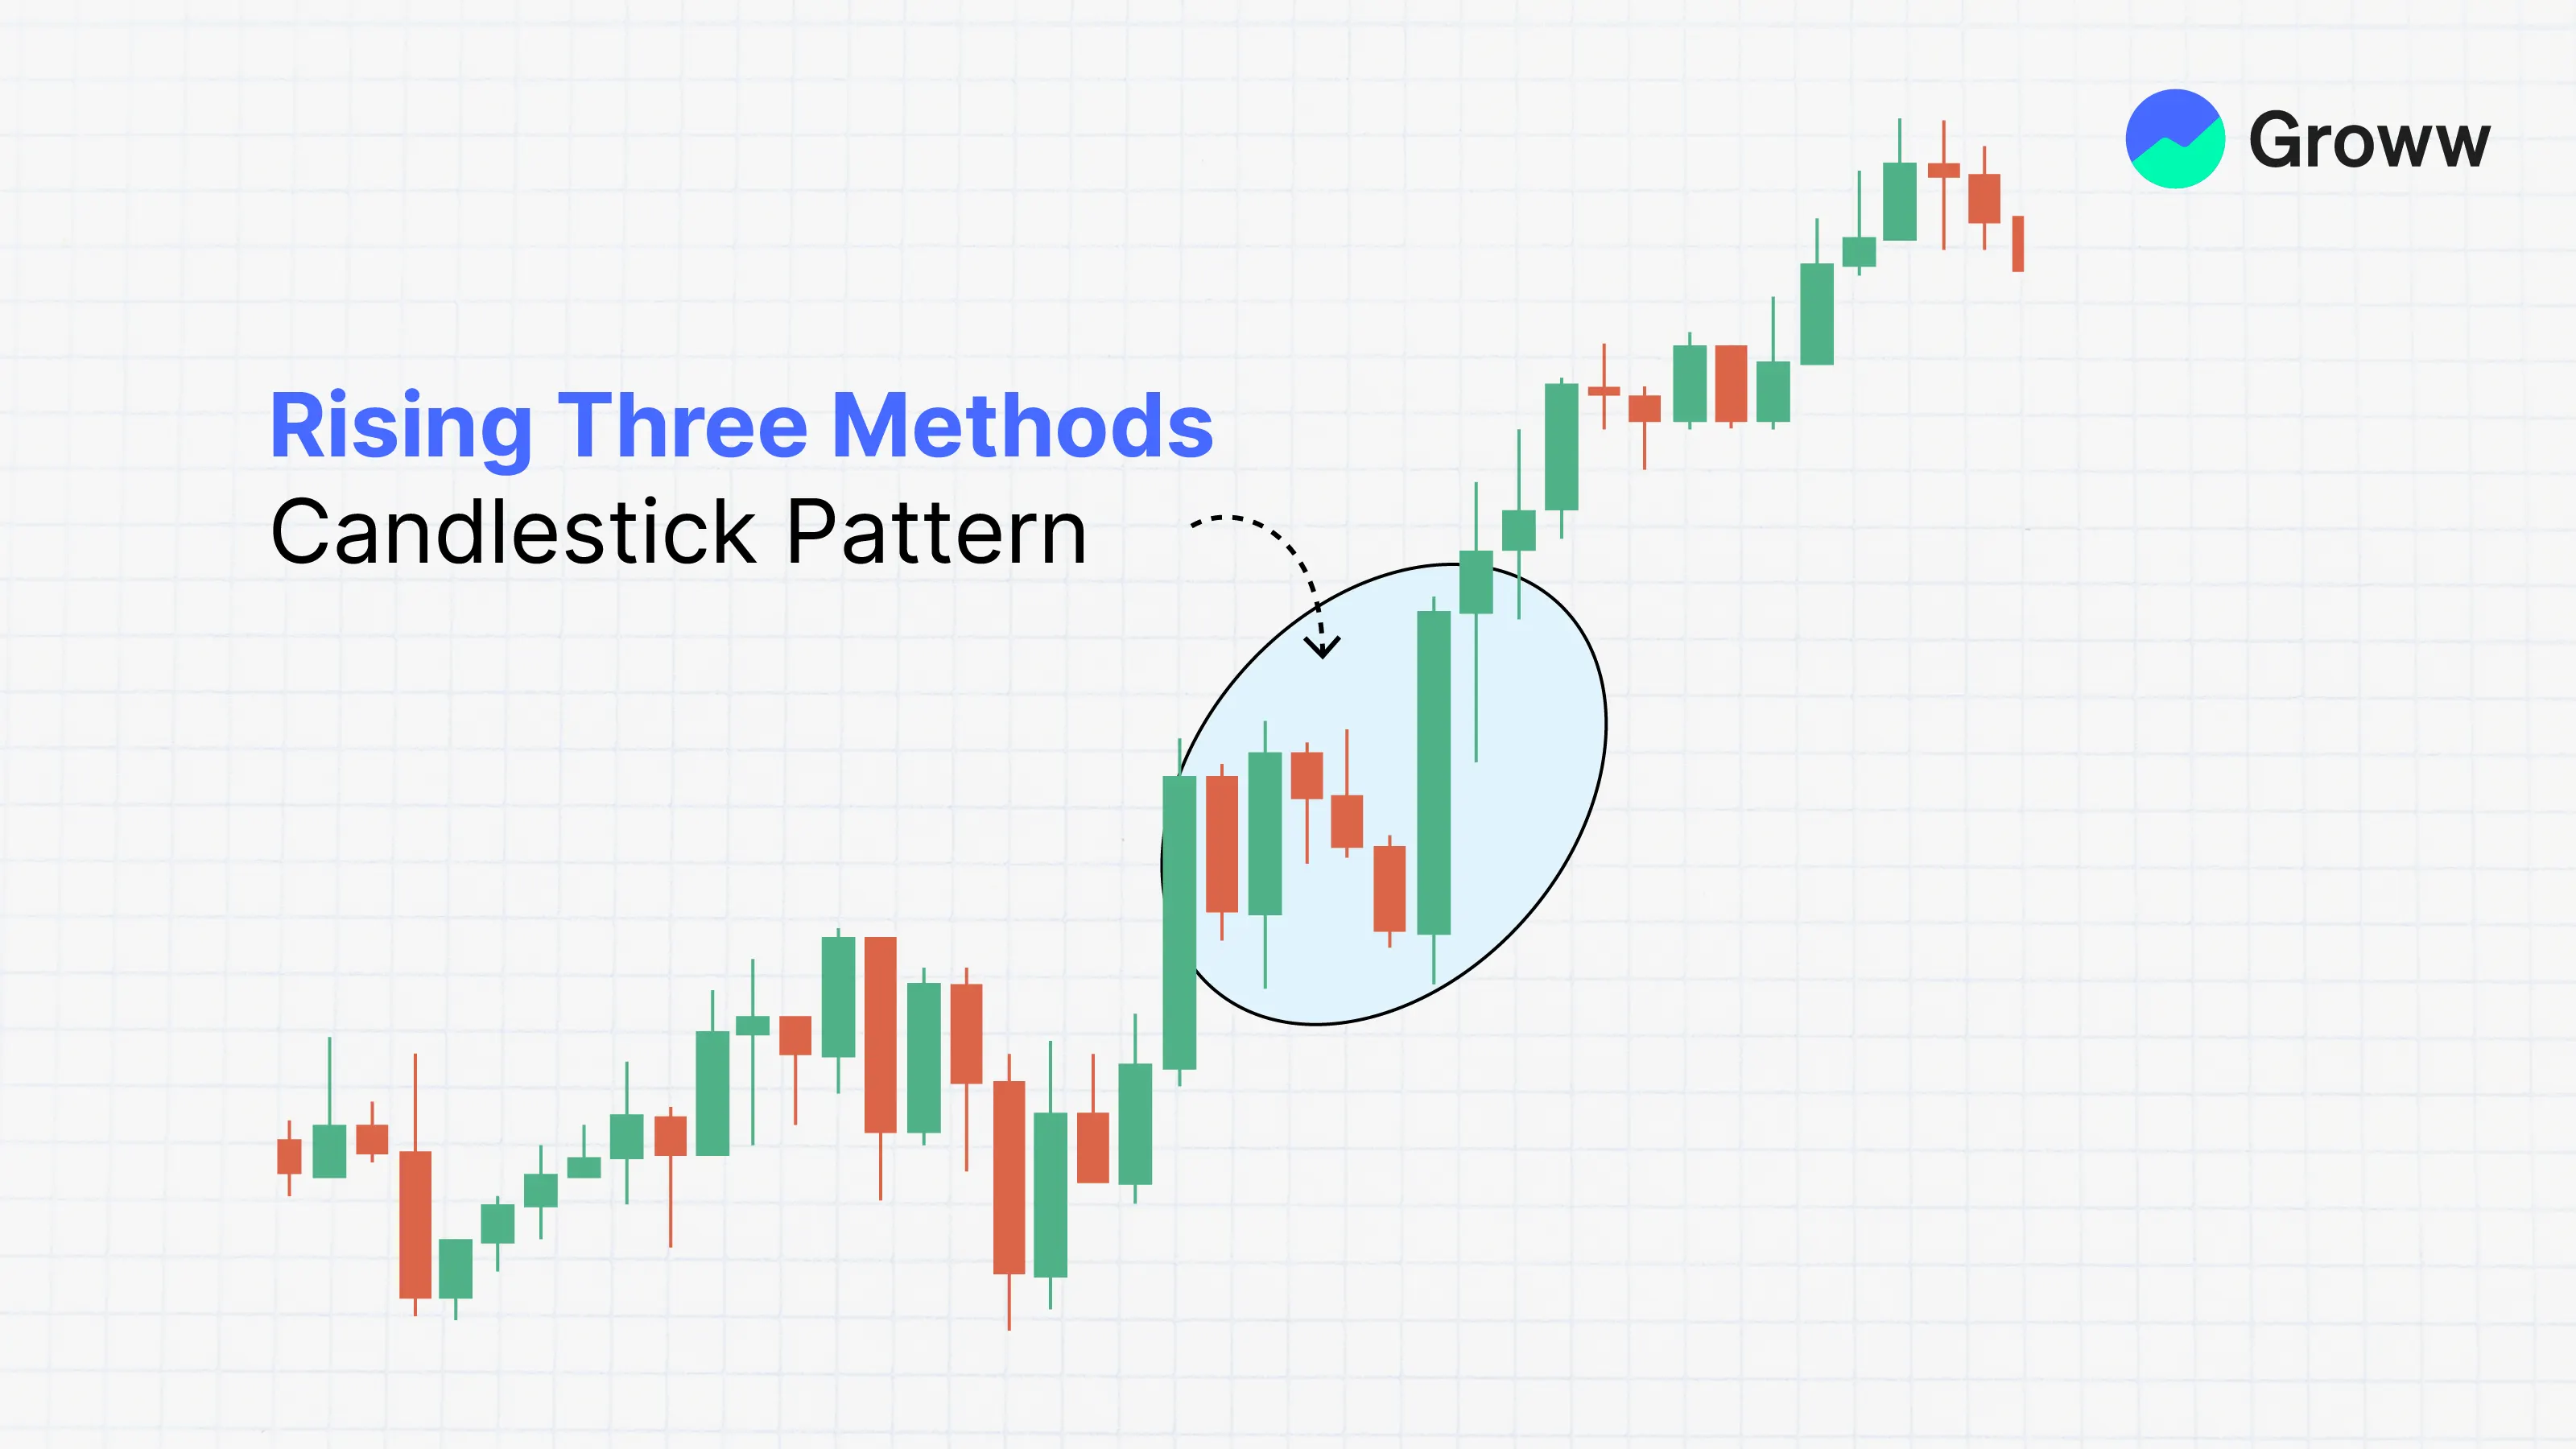
Alert: Traders usually take up long positions after the close of the fifth candle above the first candle’s high. Some take the risk of entering while the fifth candle is forming, although it is riskier.
Falling Three Methods (Bearish Continuation)
- This is a five-candle bearish continuation pattern that signals a downtrend pausing before resuming.
- There is a long bearish candle, followed by three small bullish candles within its range. The final candle is a long bearish candle closing below the low of the first candle.
- This indicates the bears remain in control and is a continuation, not a reversal.
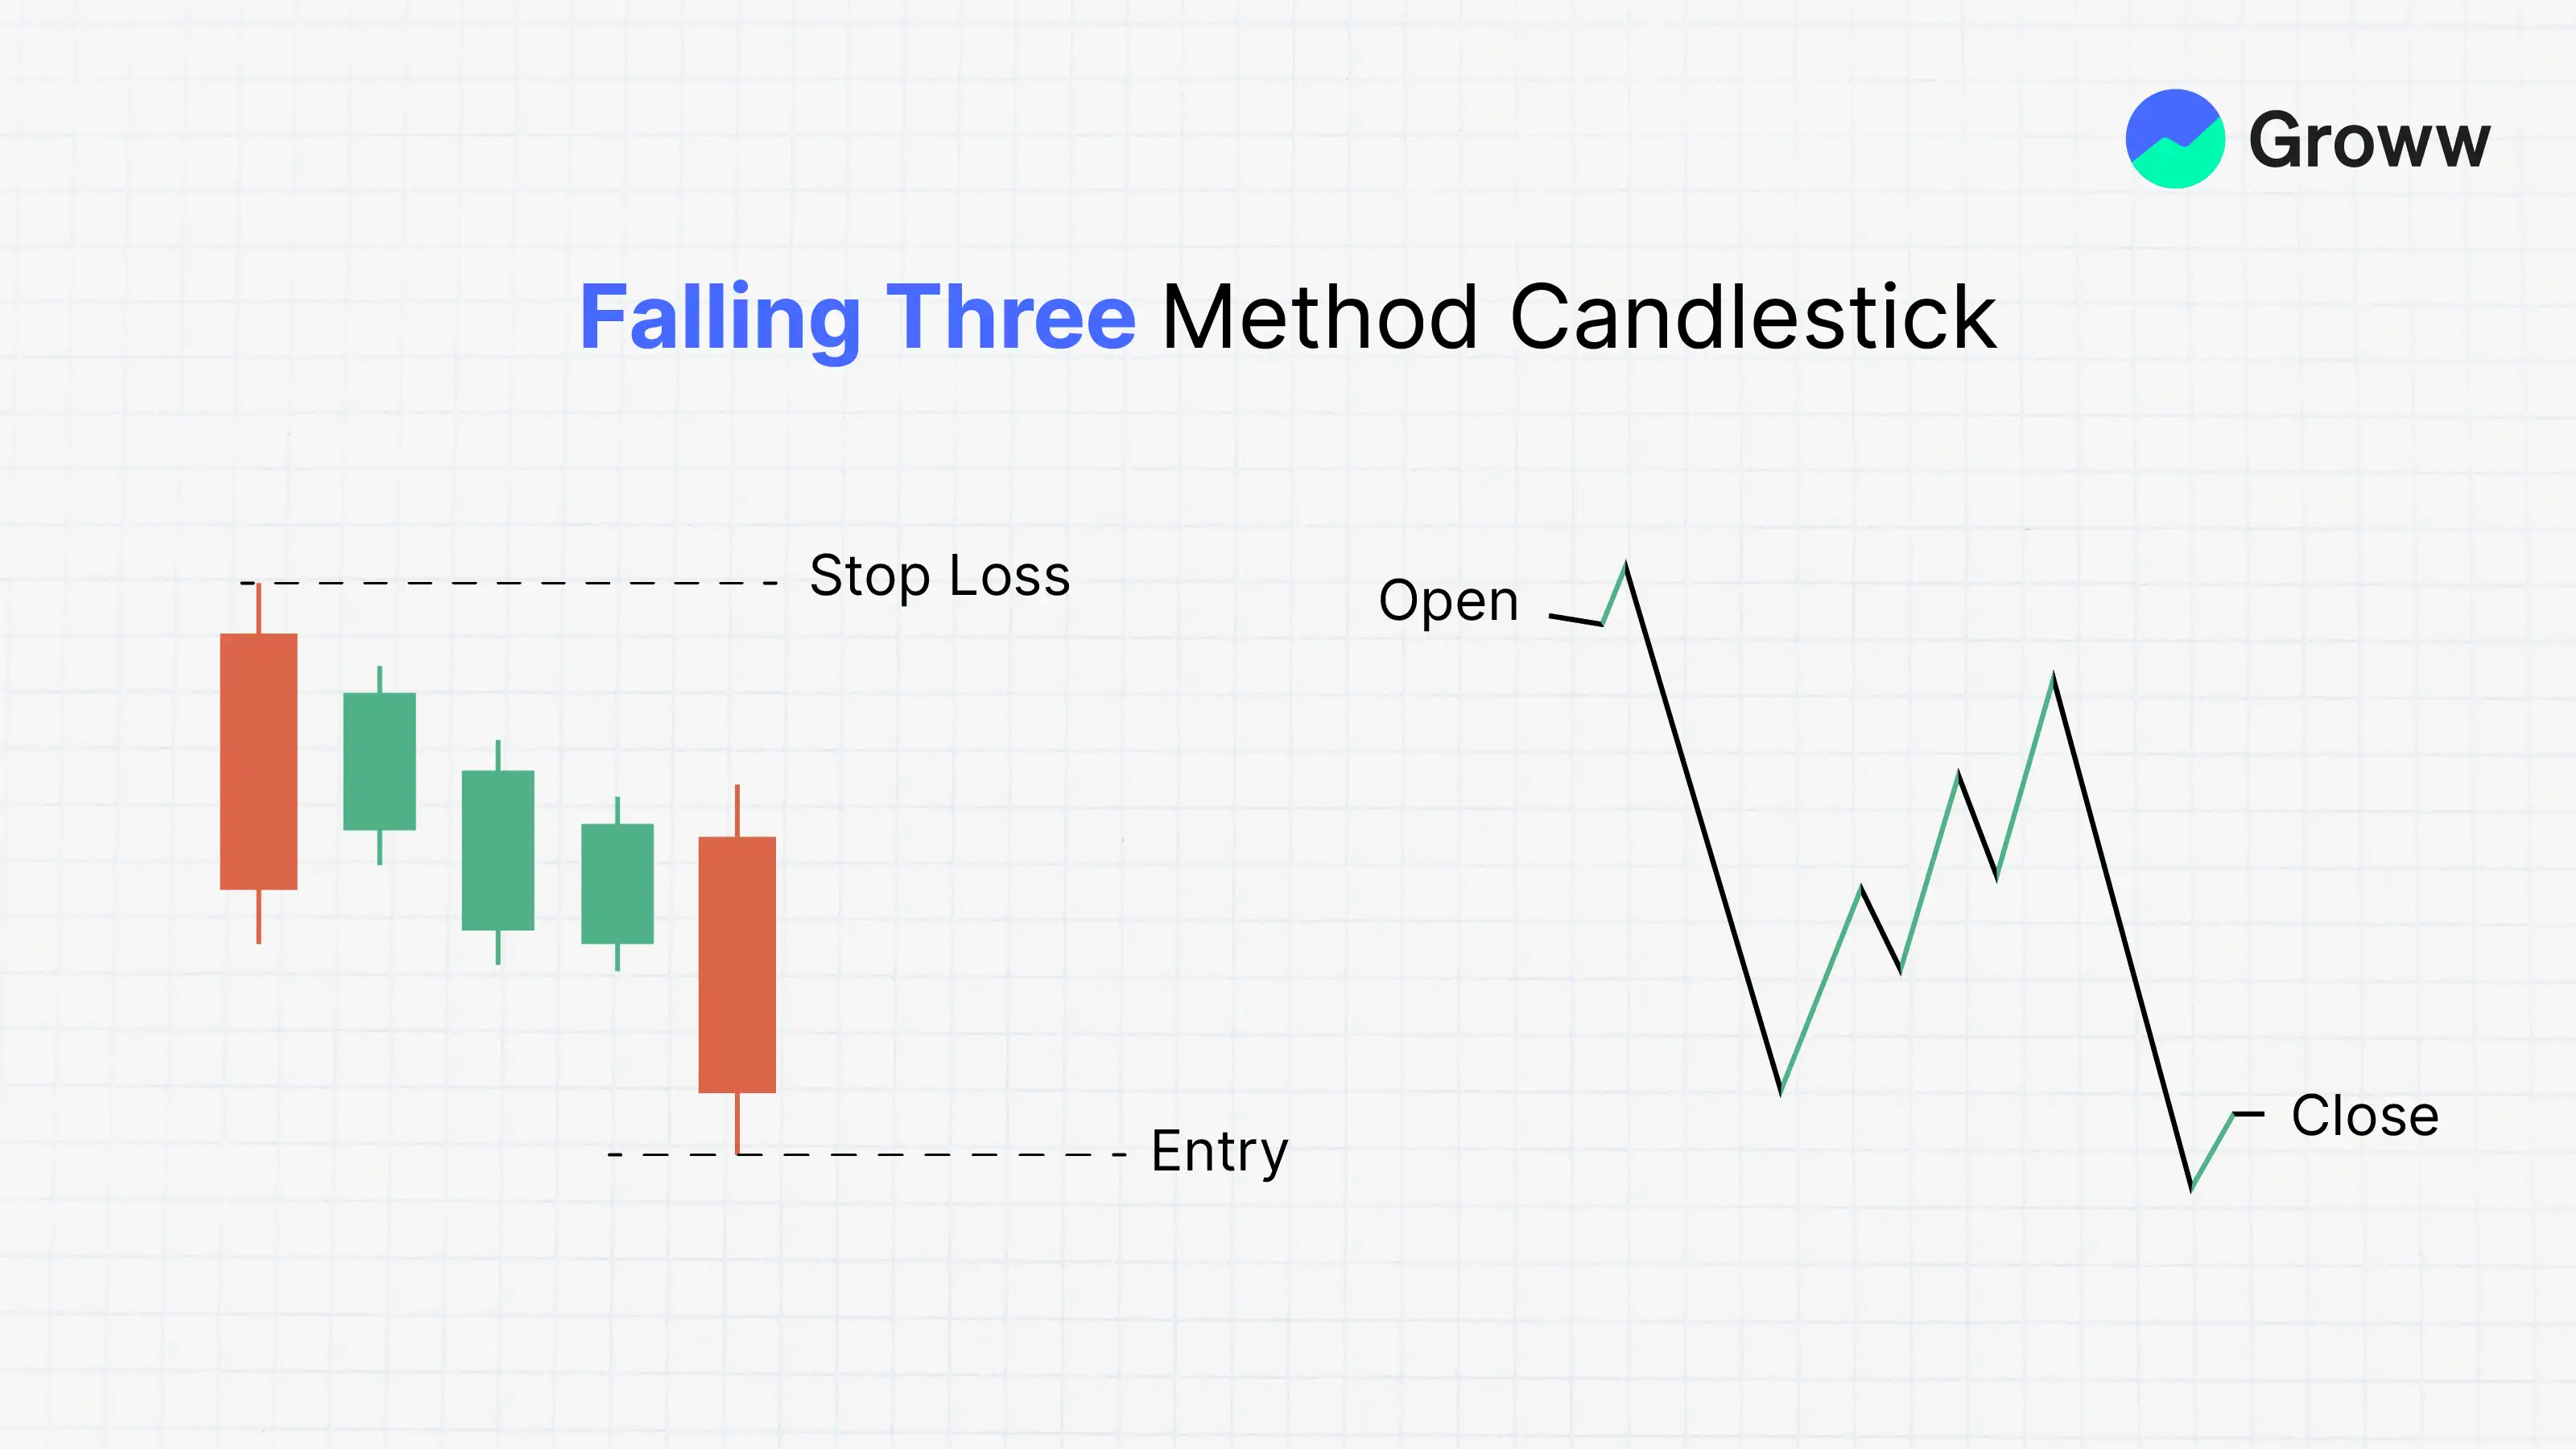
Alert: Trading is best done with the understanding that sellers quickly regain overall dominance, as confirmed when the fifth candle closes below the low of the first candle.
Interpreting Reversal and Continuation Patterns
Understanding the context is essential:
- Reversal patterns near support or resistance zones are more valid.
- Continuation patterns highlight trend strength and offer re-entry to the trend.
- Further, volume plays a vital role, particularly on the third candle.
Always ensure you measure trend strength and the candle body size to support and resistance levels.
How to Use Other Indicators
While multi-candle patterns are powerful on their own, combining them with other tools increases accuracy:
- RSI or Stochastic Oscillator: Overbought/oversold signals strengthen pattern reliability.
- Moving Averages: Use 50-day or 200-day MA as trend filters.
- Bollinger Bands: Patterns near outer bands often signal sharp reversals.
- Volume Indicators: Confirm breakouts or breakdowns with volume spikes.
For example, a Morning Star at a 200-day MA with RSI < 30 and rising volume is a high-probability reversal setup.
When They Fail: Risk Management
Even strong patterns can fail in volatile or news-driven markets. To manage this:
- Use stop-losses: Place below the pattern (for bullish setups) or above (for bearish).
- Wait for confirmation: Do not trade until the third candle closes.
- Size your position: Based on volatility and account risk tolerance.
- Avoid trading low-volume stocks, as patterns can be misleading.
Remember, no pattern guarantees success. Effective risk management is essential for long-term trading success.