Double Candlestick Pattern - Bullish and Bearish Signals
A double candlestick pattern is a technical analysis formation that uses two consecutive candlesticks to identify potential trend continuations or reversals. They are also called two- or dual-candle patterns and offer valuable insights into prevailing market sentiments. At the same time, you can use them to understand the shifts in control between buyers and sellers.
Key Patterns
So, as the concept goes, a double candlestick is made up of two consecutive candlesticks, and the patterns are identified based on the relationship between them. This can be the size of their bodies, the direction of their shadows, or even their placement relative to the support and resistance levels.
The first candlestick is the signal candle, and it indicates the market direction, while the second candlestick is the confirmation candle. The pattern in this case is a combination of two candlesticks that form together and is used throughout technical analysis to forecast the future direction of the asset price.
Every single pattern has its own specific attributes, enabling insights into price changes and market trends. Traders leverage these patterns, along with other technical indicators, to make more informed decisions.
In terms of structure, the second day is positioned close to the first day, and the open and close prices fall within the first day's price range. First, identify two adjacent candles at the start, then check the open, low, high, and close prices for each candle. This will help you work out which type of double candlestick pattern is forming. Then you can evaluate this pattern to determine whether it is a valid signal of an upcoming reversal.
Here are some key patterns observed in double candlestick patterns.
Also check : Scalper Mode on 915 | Straddle Chart
Bullish and Bearish Engulfing
Engulfing patterns usually contain two candlesticks, where the second candle fully engulfs the first candle’s body. Bullish engulfing is a bullish reversal pattern in which a small bearish candle is followed by a larger bullish candle that engulfs it. Conversely, a bearish engulfing pattern is a bearish reversal pattern. A smaller bullish candle forms, followed by a bigger bearish candle engulfing it.
Bearish Engulfing Pattern:
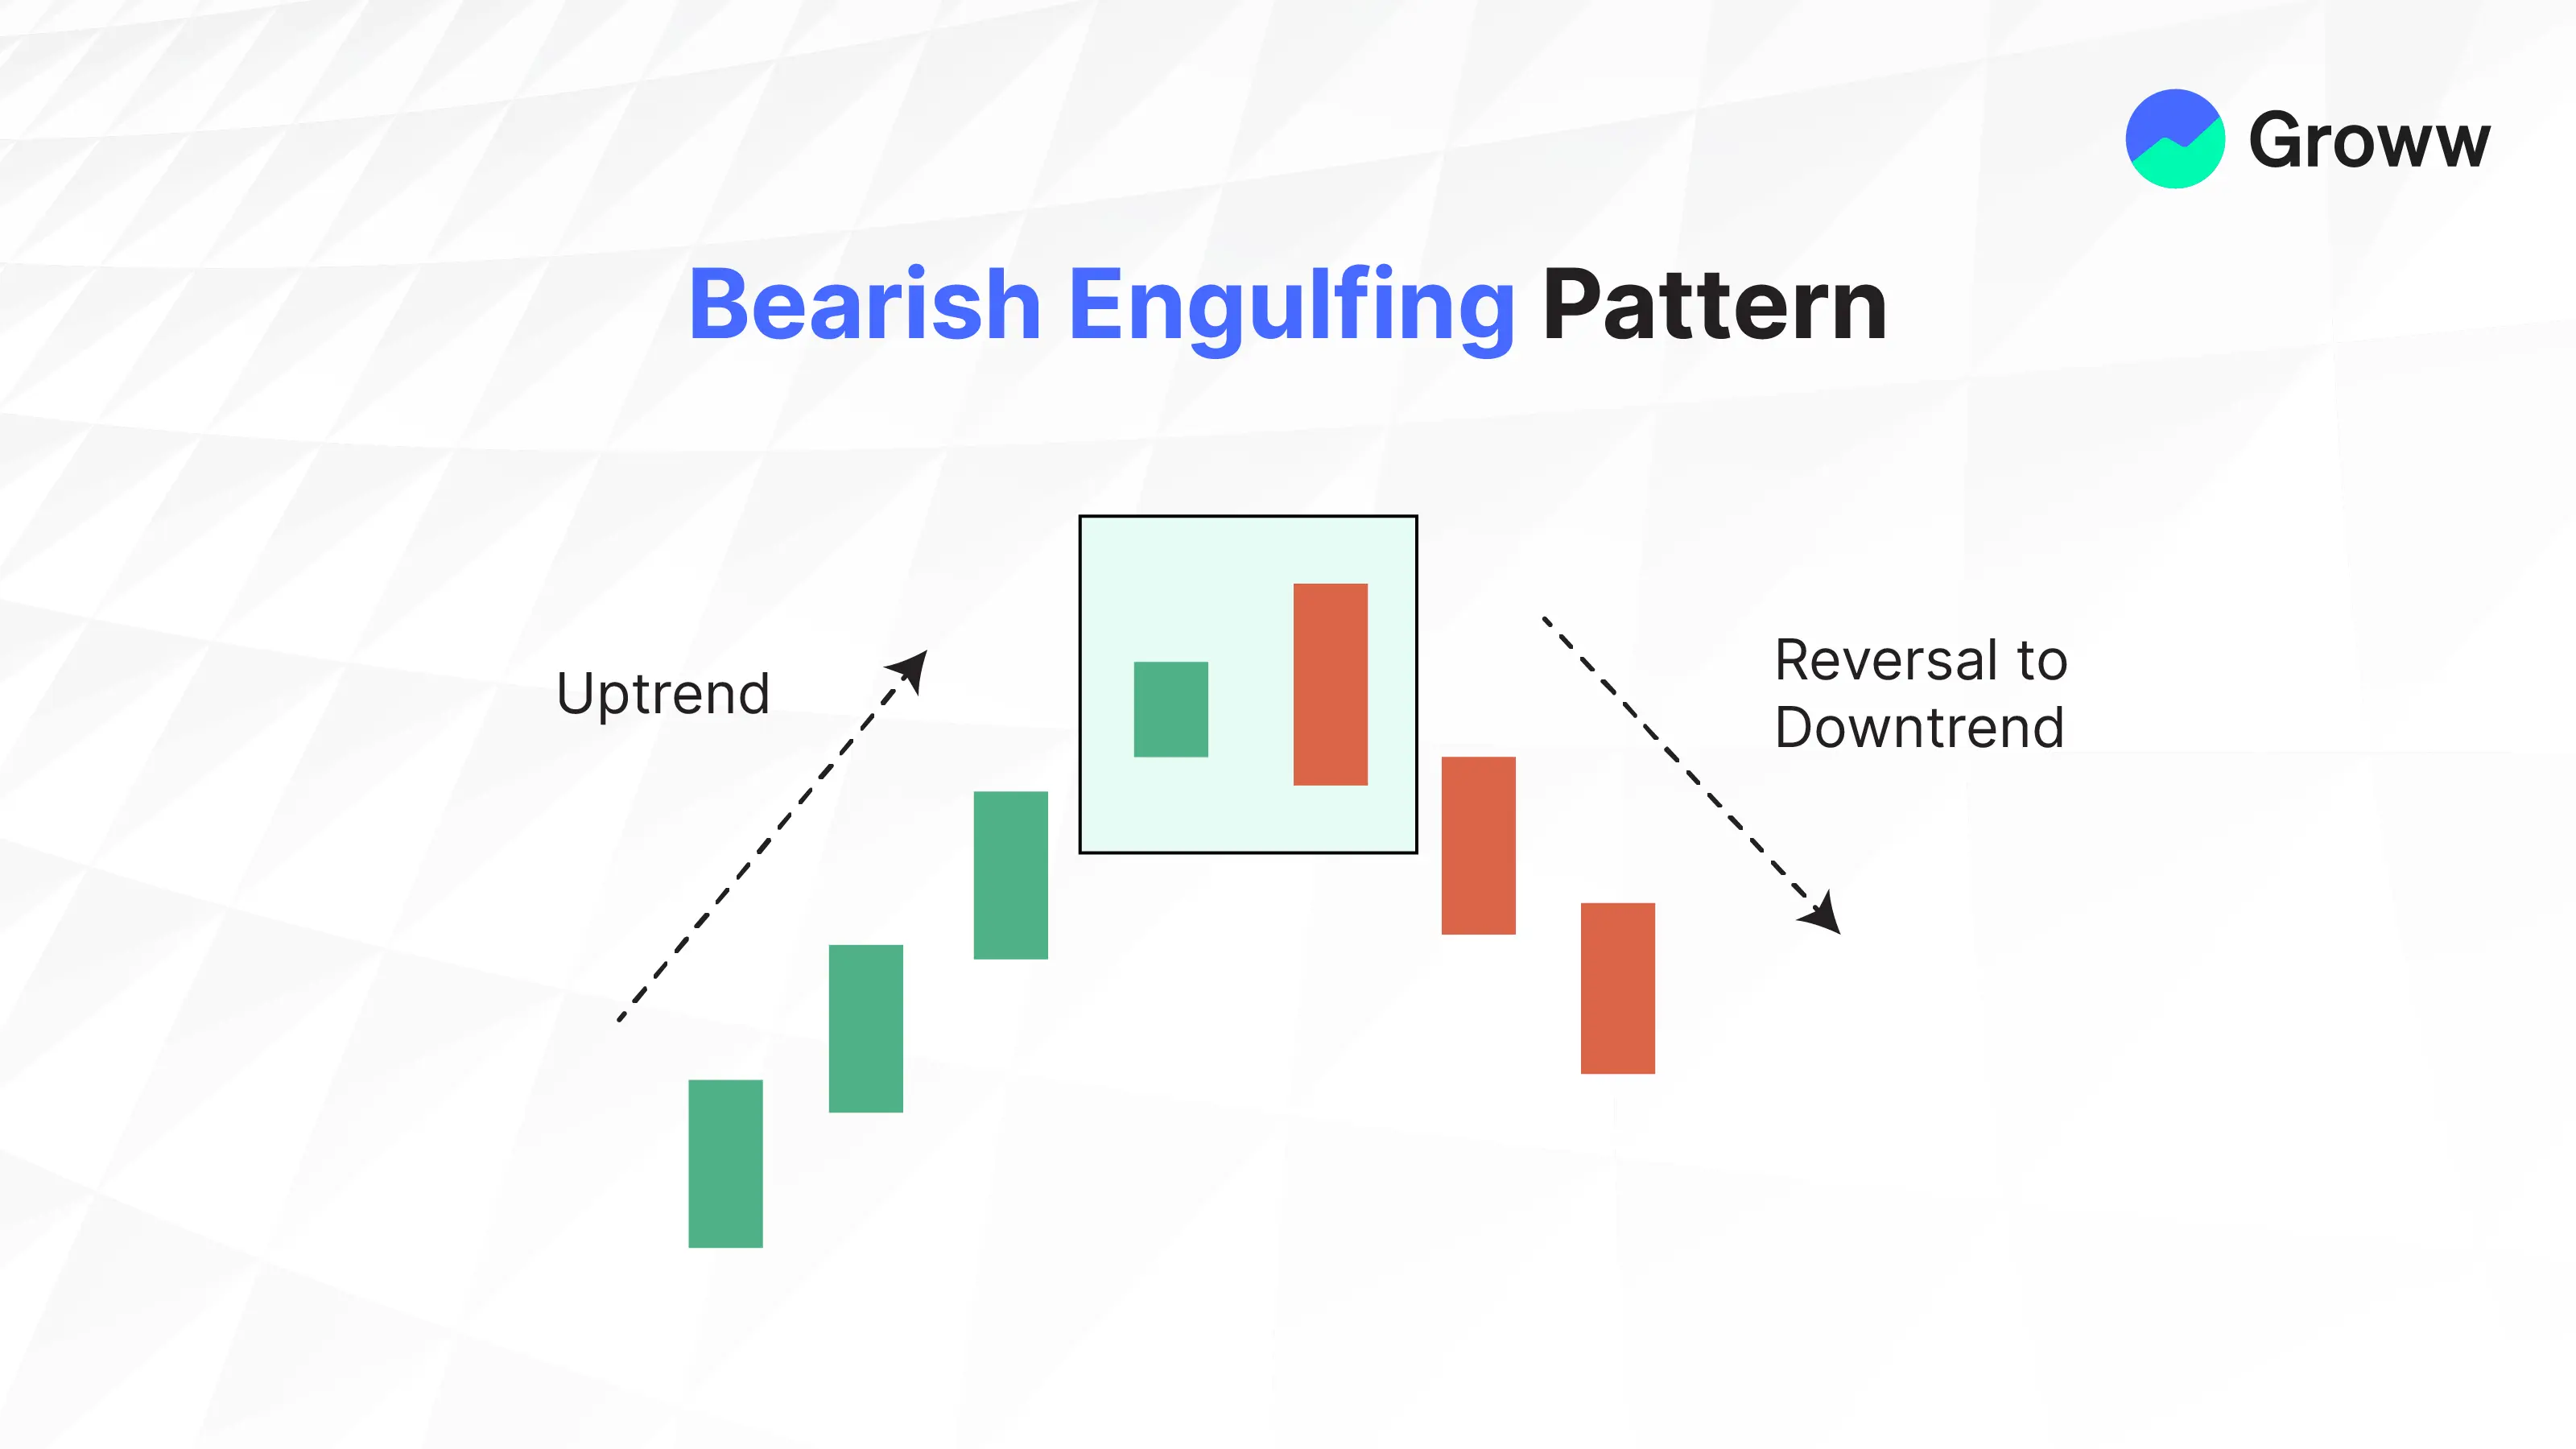
This happens whenever a bullish candle is followed by a larger bearish candle at the end of the uptrend. As an investor, it will alert you to a potential downward trend.
The pattern indicates lower prices to come in the charts. This pattern thus has an up candlestick with a larger down candlestick engulfing the former. If it occurs after a price advance, it is significant, whereas it is slightly less significant in markets that are choppier.
The pattern is more reliable whenever the open price of the engulfing candle is comfortably higher than the close of the first candle, and also when the engulfing candle’s close is well below the first candle’s open.
As a trader, you could wait for the second candle to close before you take action. This pattern is usually observed at the conclusion of price increases. It offers great shorting opportunities, as the trade will align with the longer-term downtrend.
Bullish Engulfing Pattern:
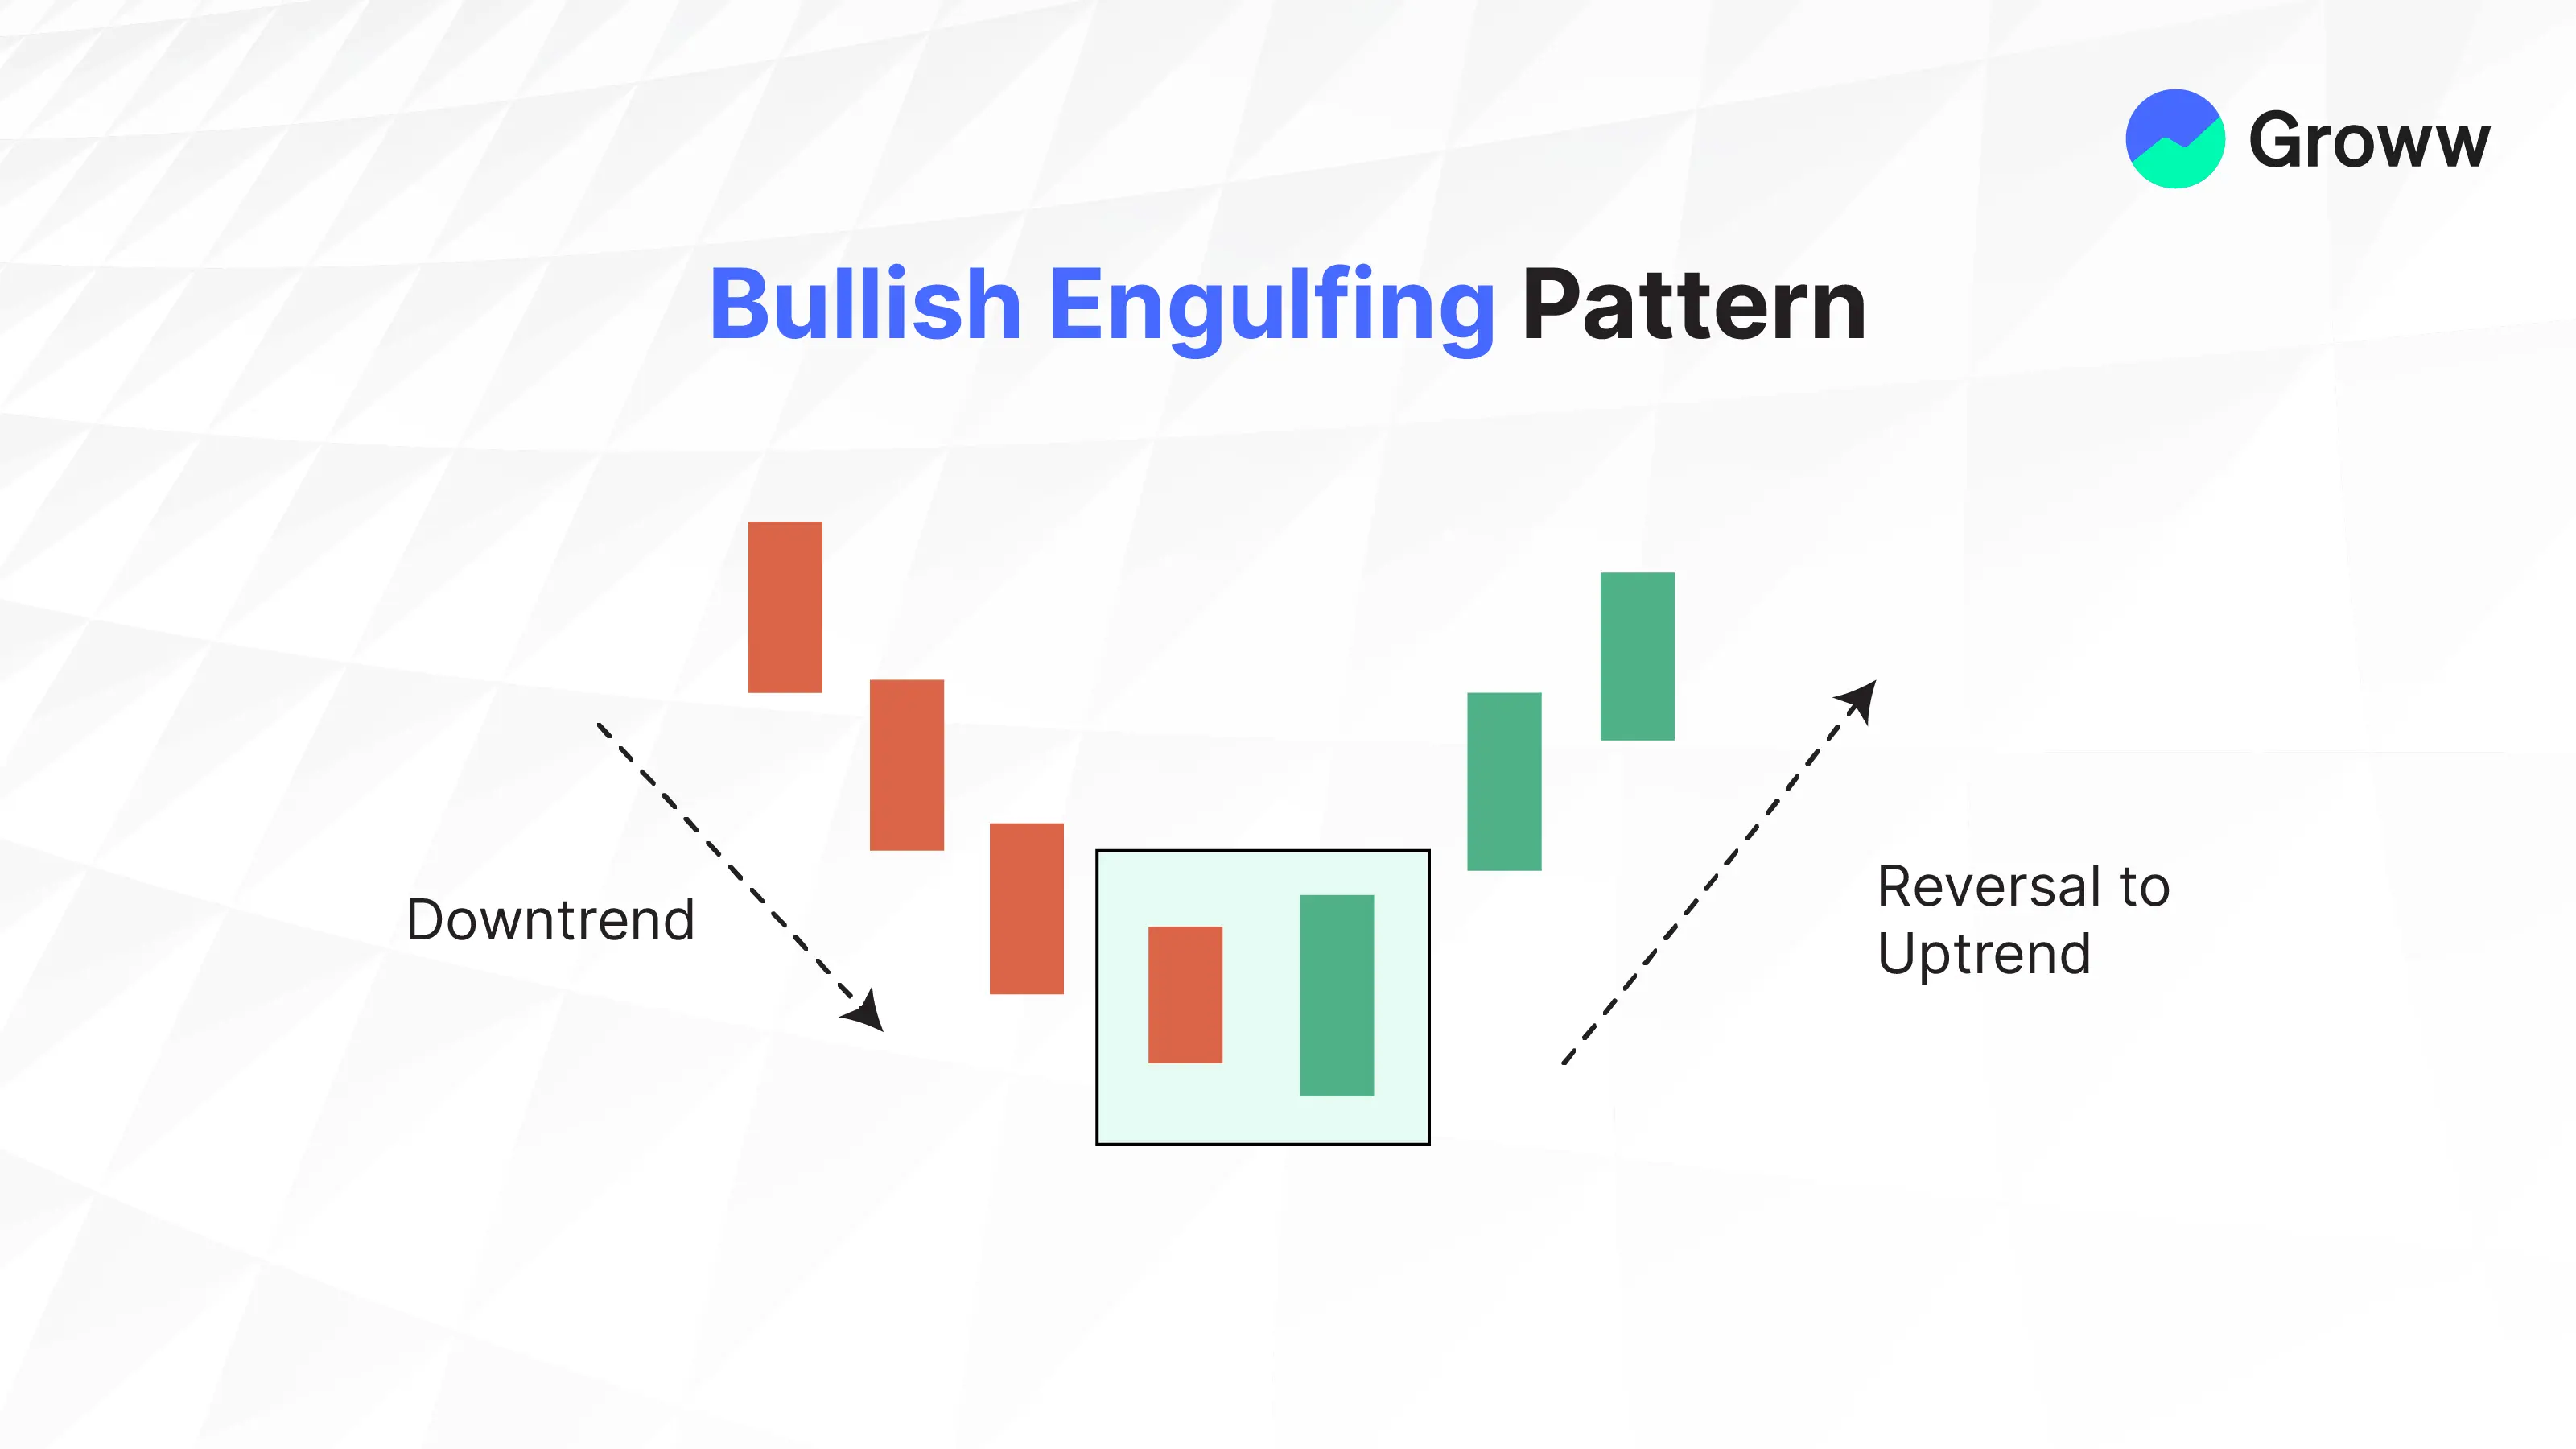
This pattern occurs after a price decline, indicating a higher price is coming soon. This is a white candlestick that closes higher than the previous day’s opening, and that too after opening lower than the previous day's close. It comes in a downtrend and combines a large hollow candle and a dark candle.
The pattern is identified with the smaller black candlestick, indicating a bearish trend. In contrast, the large white candlestick indicates a bullish trend on the next day, fully engulfing the body of the earlier day’s candlestick. This pattern forms when the stock opens at a lower price on the second day than it closed on the first day.
However, the body of the large day two candlestick will not get an opportunity to engulf the body of the earlier day’s small candlestick in case the price does not gap down.
Traders use this pattern to gauge whether sentiment is changing, i.e., a good time to purchase a stock.
Piercing Line
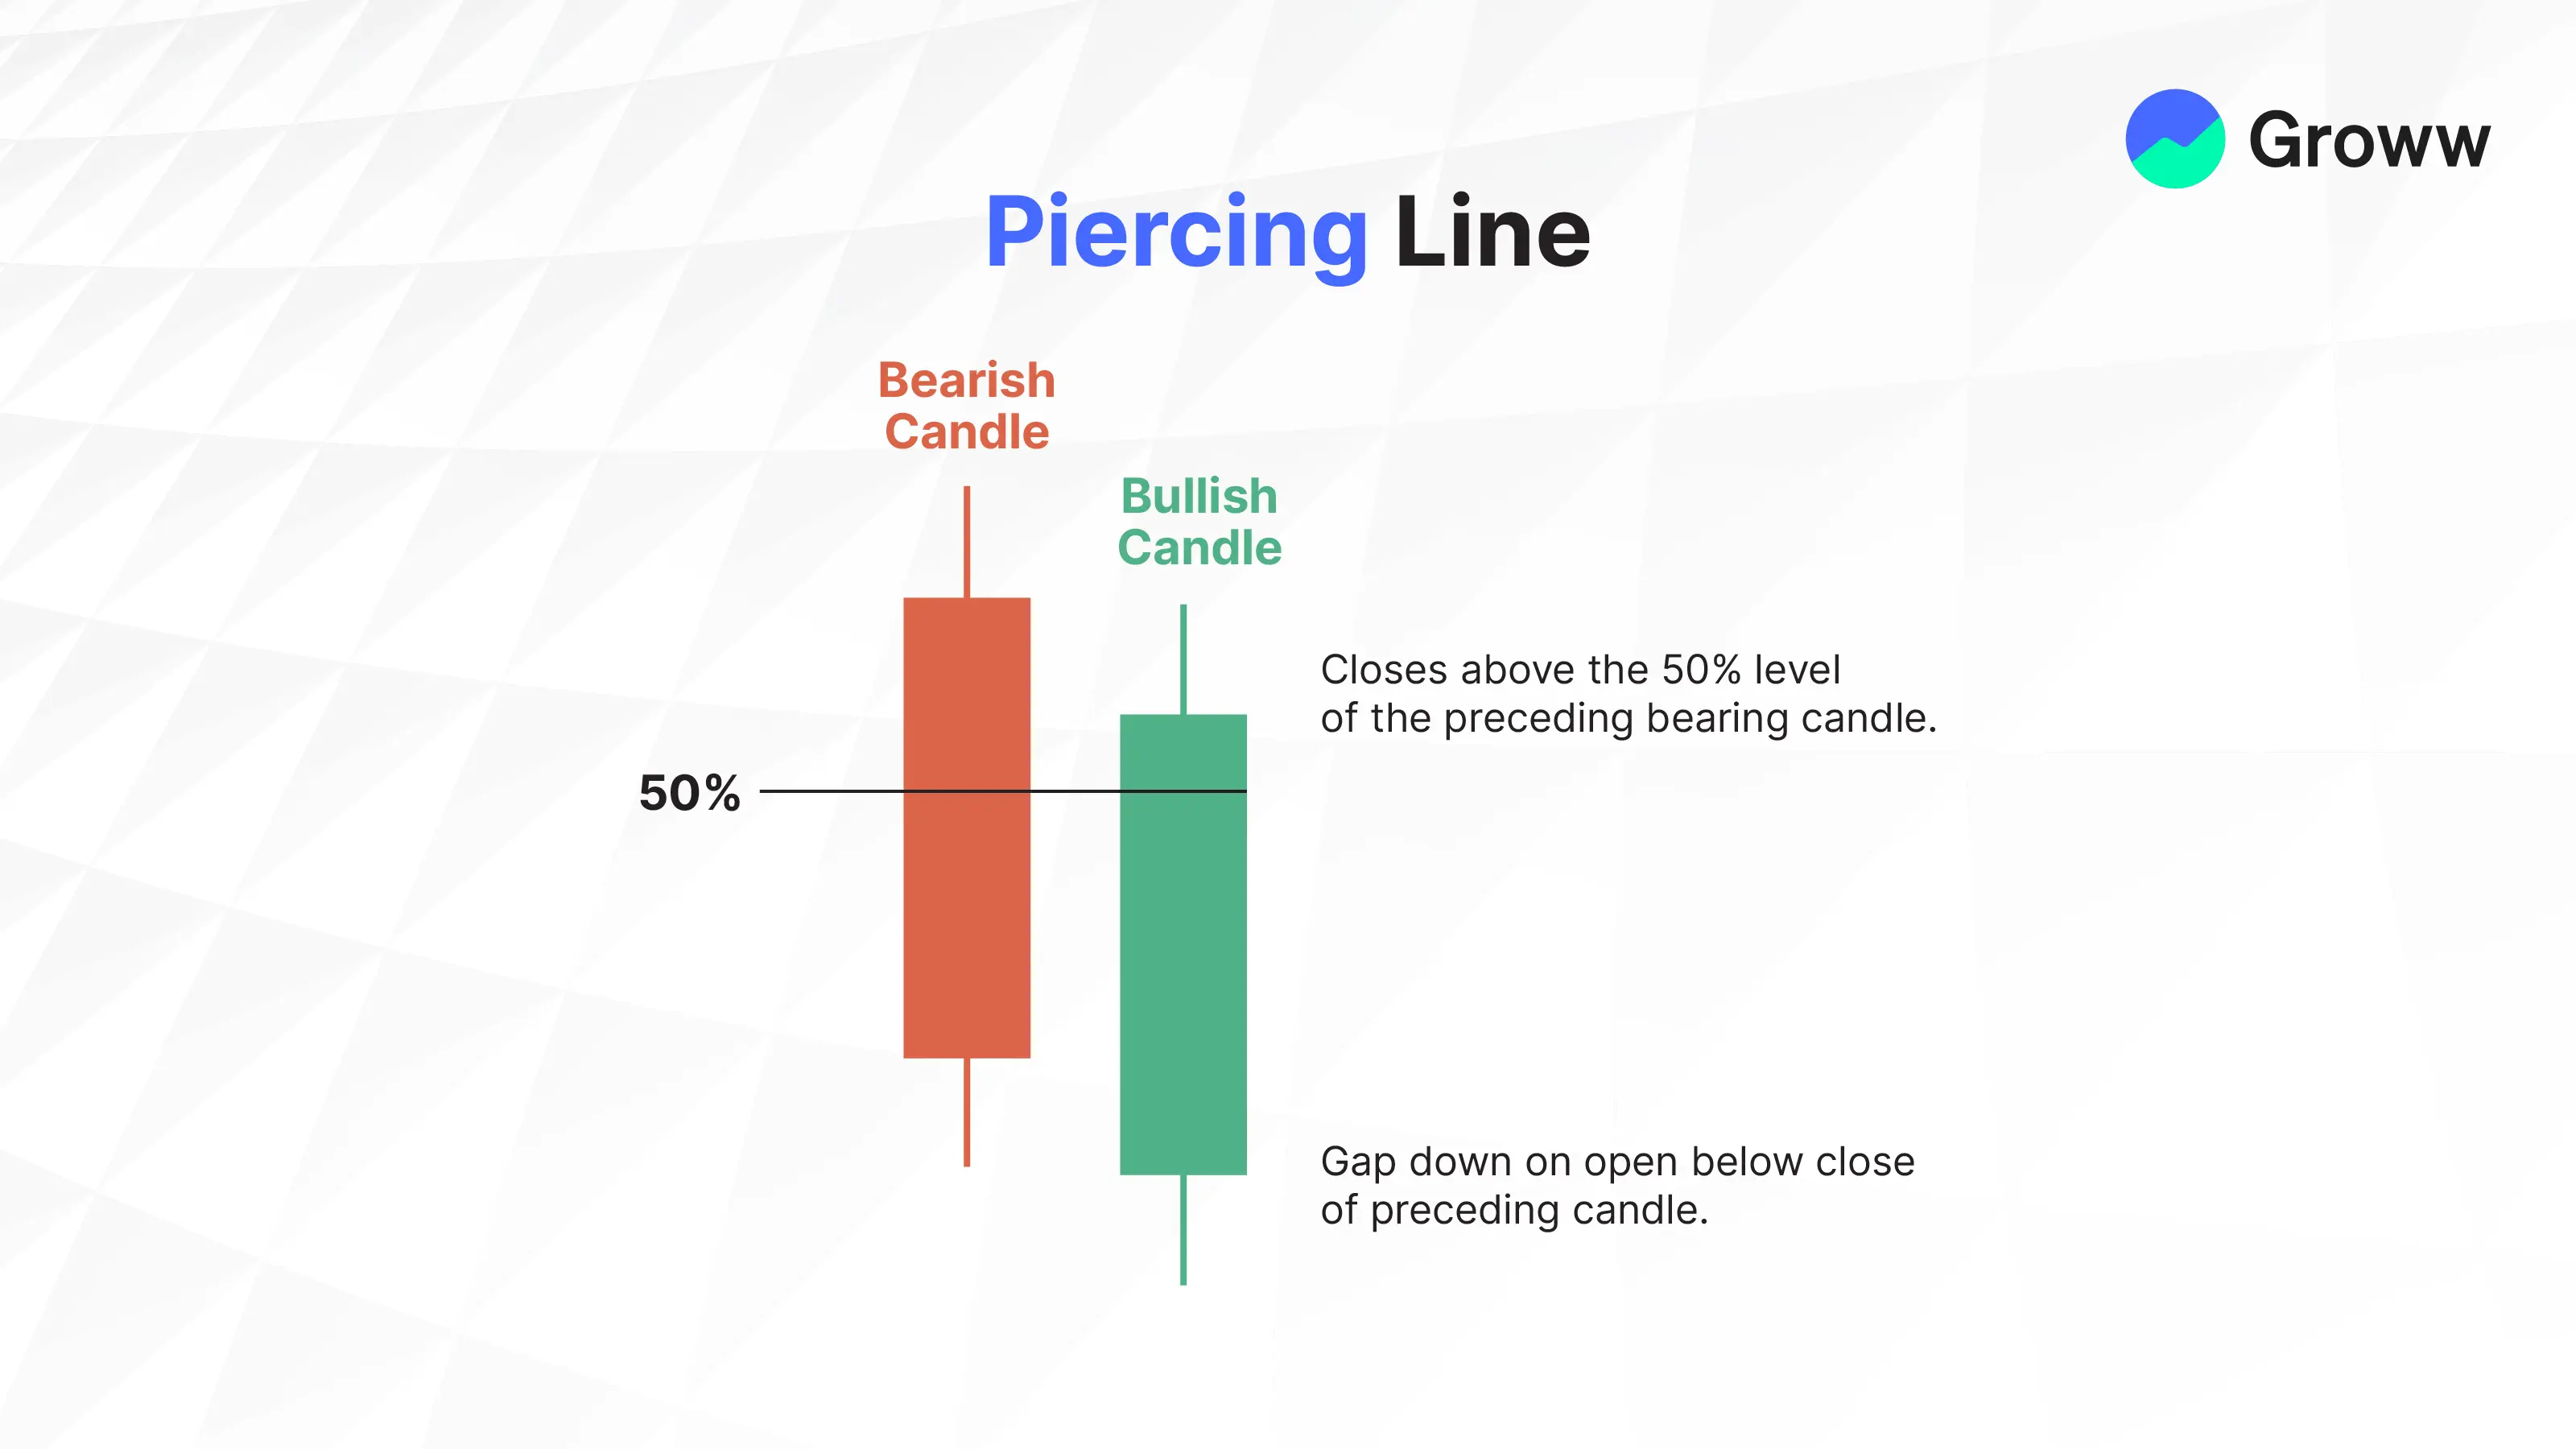
It is a bullish reversal pattern: a long red candle followed by a long green candle, with the green candle opening below the previous candle's close and closing below its midpoint. Two consecutive candles thus form the Piercing Line pattern: the first is bearish and opens below the low of the previous candle, while the second is bullish and closes above the midpoint.
The pattern matters because it indicates a change in market sentiment from bearish to bullish, with the first bearish candle signalling that sellers are in control. The second candle signals that buyers are taking control, suggesting a possible reversal in the trend.
There is also a gap down after day one, when trading starts on day two, opening near the low and closing near the high. The close is a candlestick that covers about half the upward length of the earlier candlestick on day one. This piercing line pattern is quite similar to the dark cloud cover pattern, with the difference that it indicates a bullish reversal, whereas the latter indicates a bearish reversal.
Dark Cloud Cover
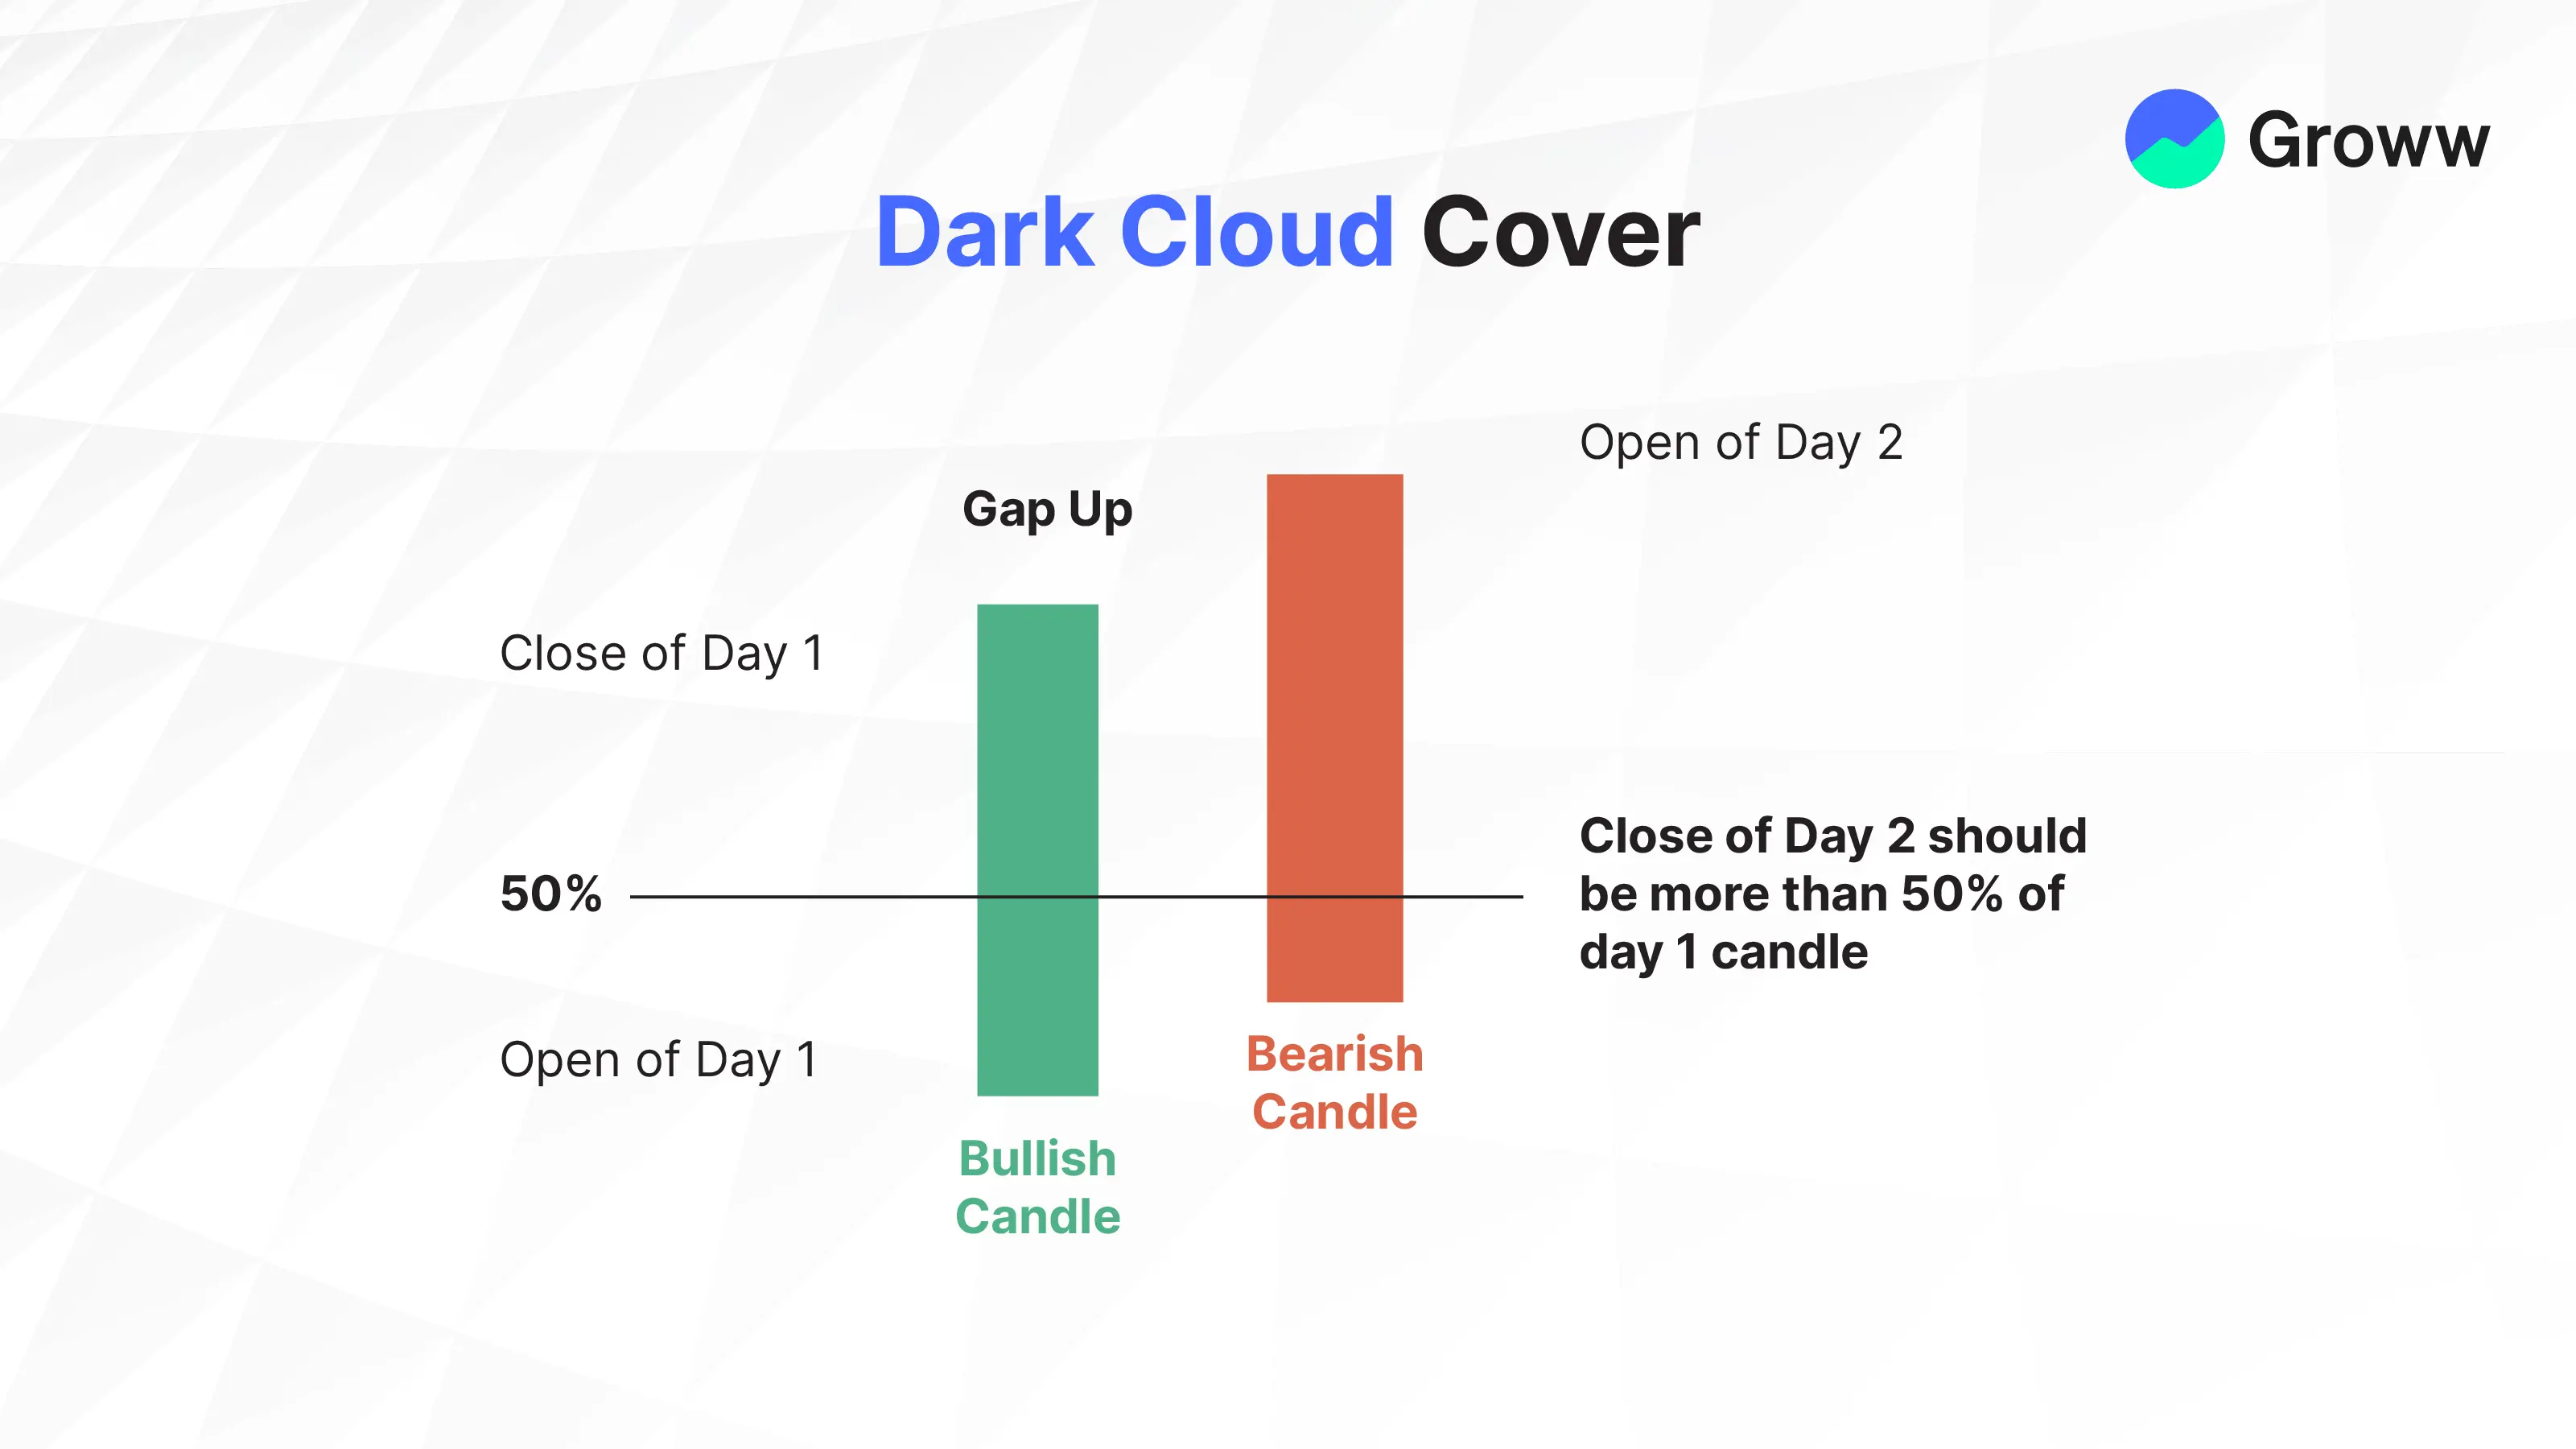
This is a bearish reversal pattern, and a bearish one follows a bullish candle. This opens above the closing of the previous candle and closes below its midpoint. This pattern thus indicates a momentum shift towards the downside after a price rise.
The pattern is a reversal, with the bullish uptrend followed by the bearish downtrend. There are thus two consecutive candles, i.e. the first candle being a bullish one and the second being a bearish candle opening above the previous candle’s high and closing below its midpoint. If the trend continues, it can signal a price decline.
Both these candles are relatively large, indicating robust participation from both investors and traders. The bearish candle will close below the earlier bullish candle’s midpoint. It is not as significant when it happens with smaller candles.
The term refers to collapsed prices that resemble dark clouds. The bearish dark cloud cover begins with an asset price that has been rising for a while, then suddenly turns before eventually falling. Traders thus consider it a bearish reversal pattern that occurs after a price uptrend.
Tweezer Top & Bottom
These are patterns with two candlesticks that have similar highs and lows, thereby indicating potential support or resistance levels.
Tweezer Tops:
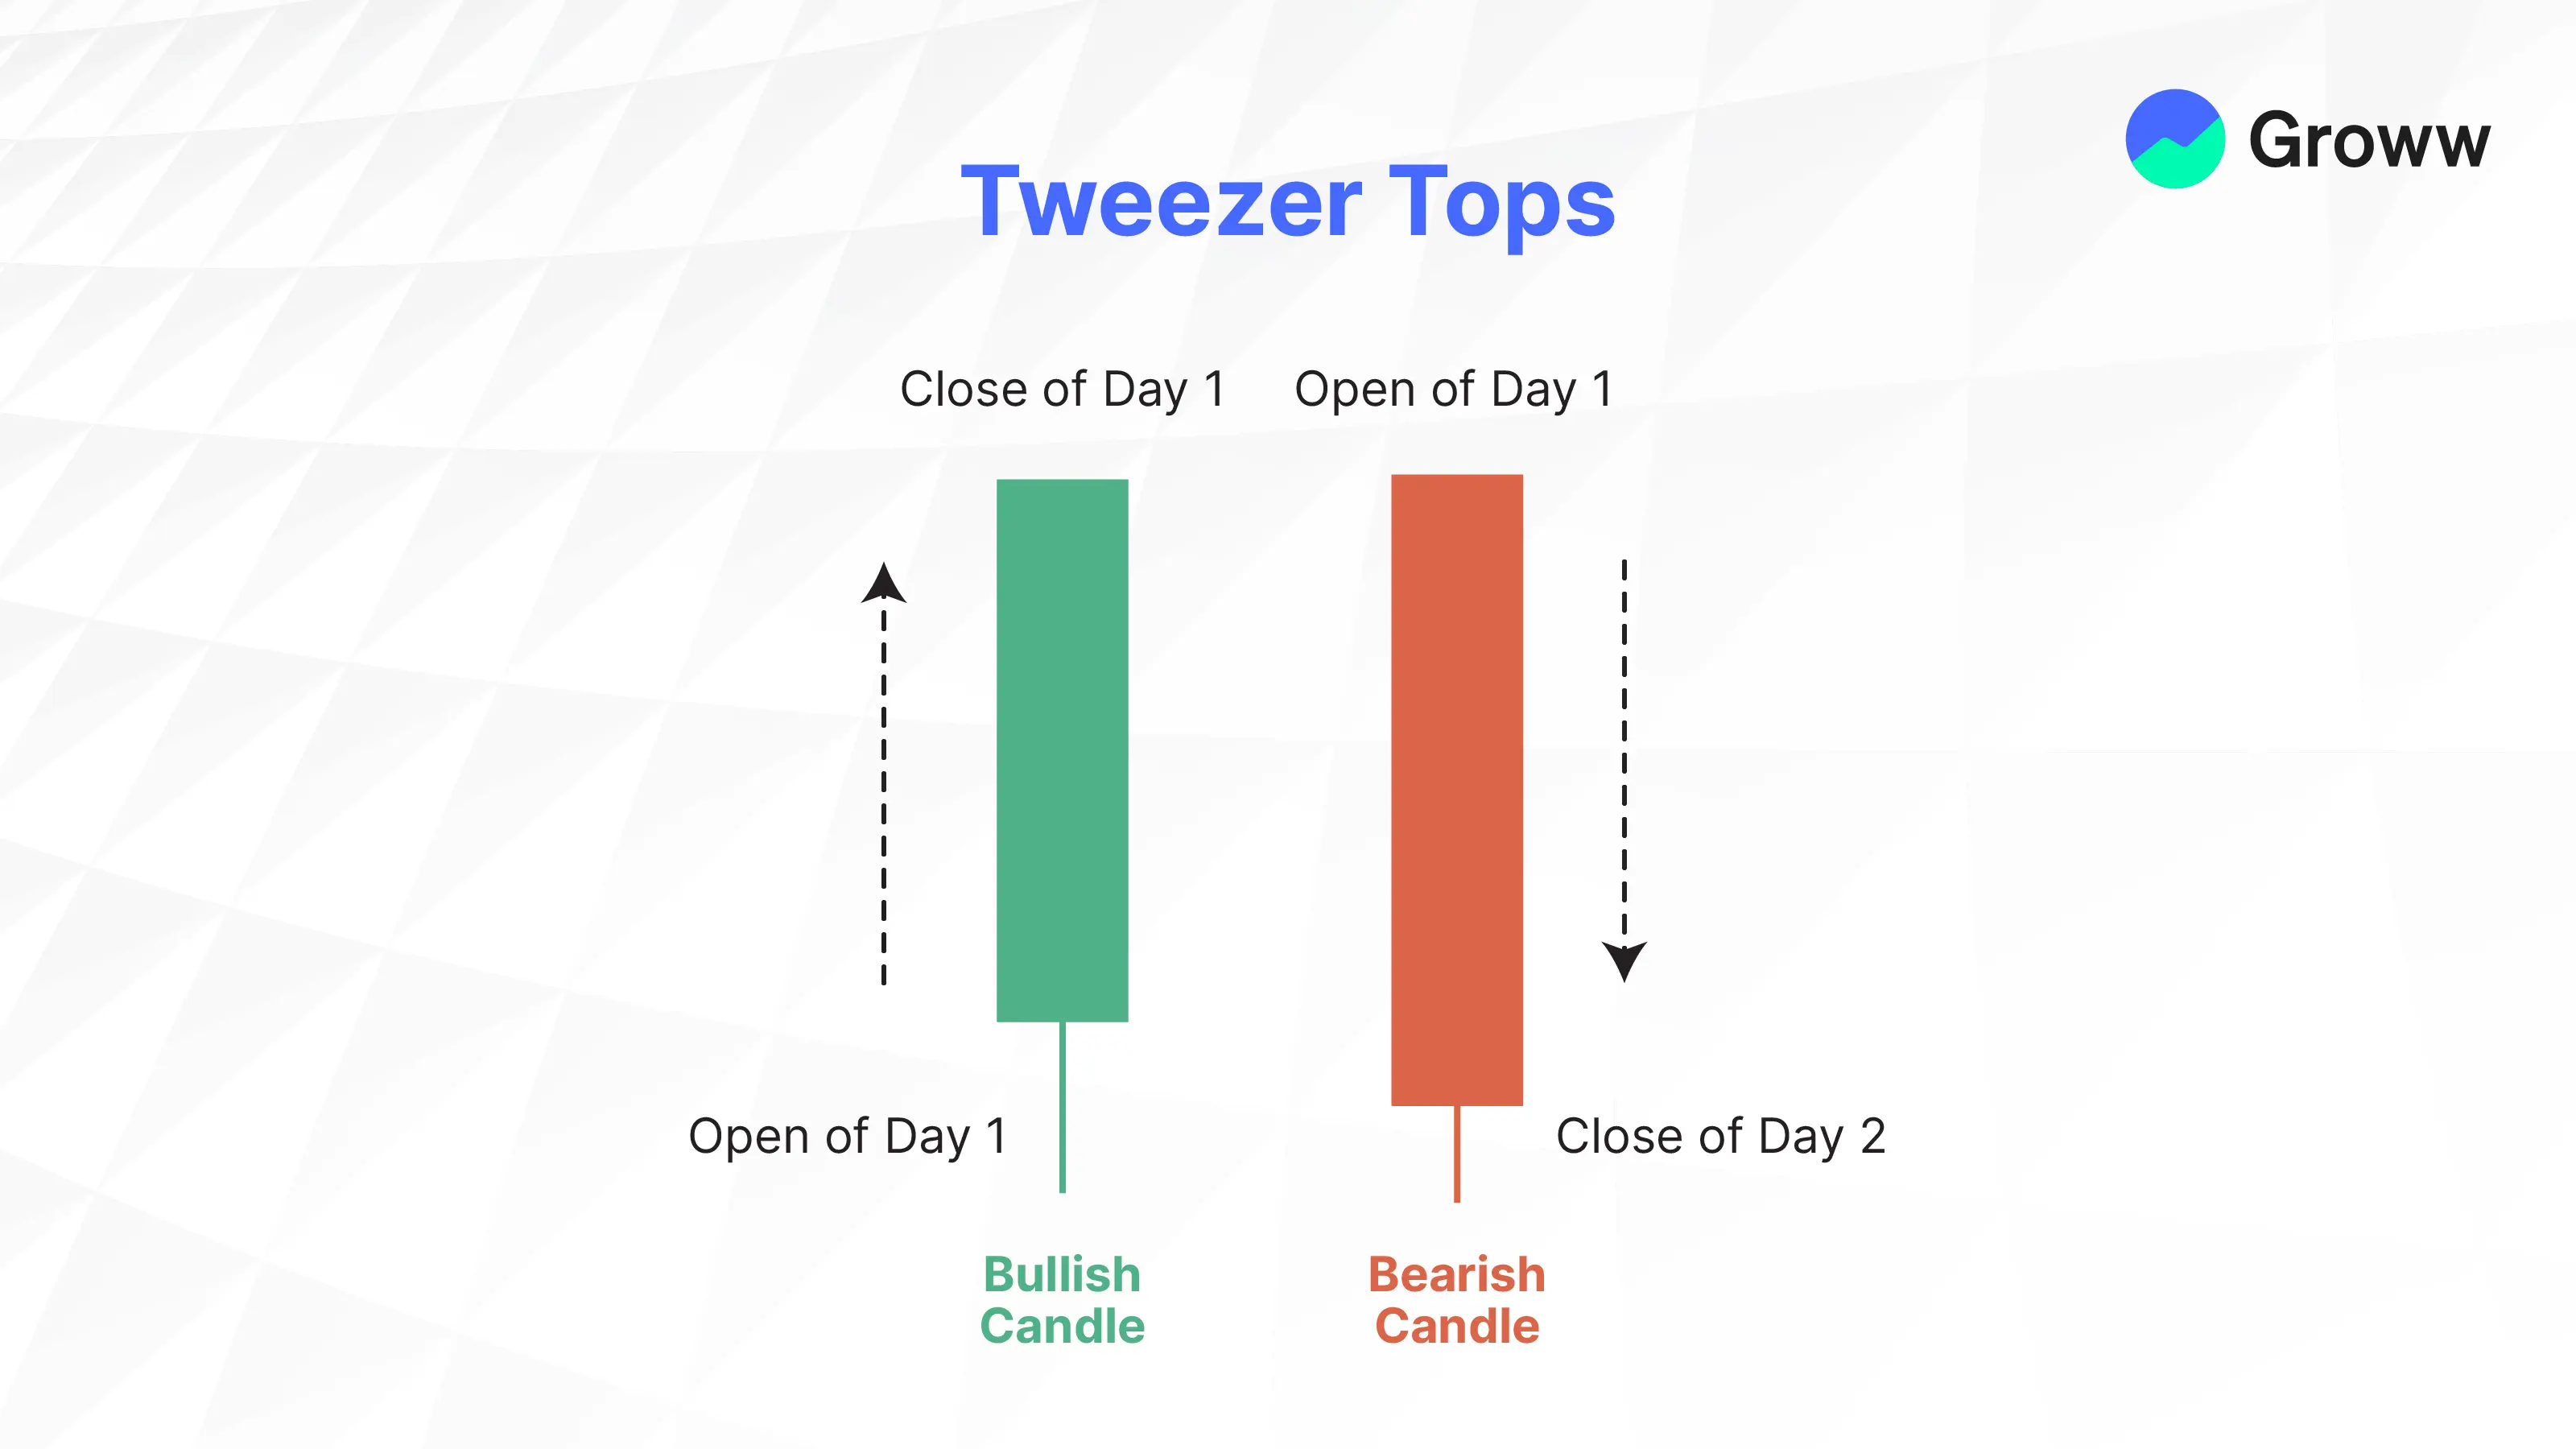
They are a specific double candlestick pattern that occurs whenever the market is in an uptrend. The pattern consists of two candlesticks with equal highs, which occur when the highs of both candlesticks are almost the same after the advance. This is when the second candlestick opens at/near the high of the previous day before closing lower. It is a bearish reversal indicator that signals the bulls will lose market control and is a potential indicator of a trend reversal to the downside. The pattern may occur after a prolonged uptrend, making it more reliable.
As a trader, you may use this pattern to either enter a short position or exit a long position, with the stop-loss order placed above the second candlestick’s high to restrict any possible losses.
The first candle is bullish in nature, although it indicates rejection of higher prices, while the second candle tries to go higher but ultimately fails in the Tweezer top. The pattern is a signal of strong resistance and eventual market decline and consolidation.
So, a bullish candlestick has to form on the first day of the formation of the pattern, followed by a bearish candle on the second day with a similar high to the earlier day’s candlestick. While the pattern is valid, they should structurally look different from each other.
Tweezer Bottoms:
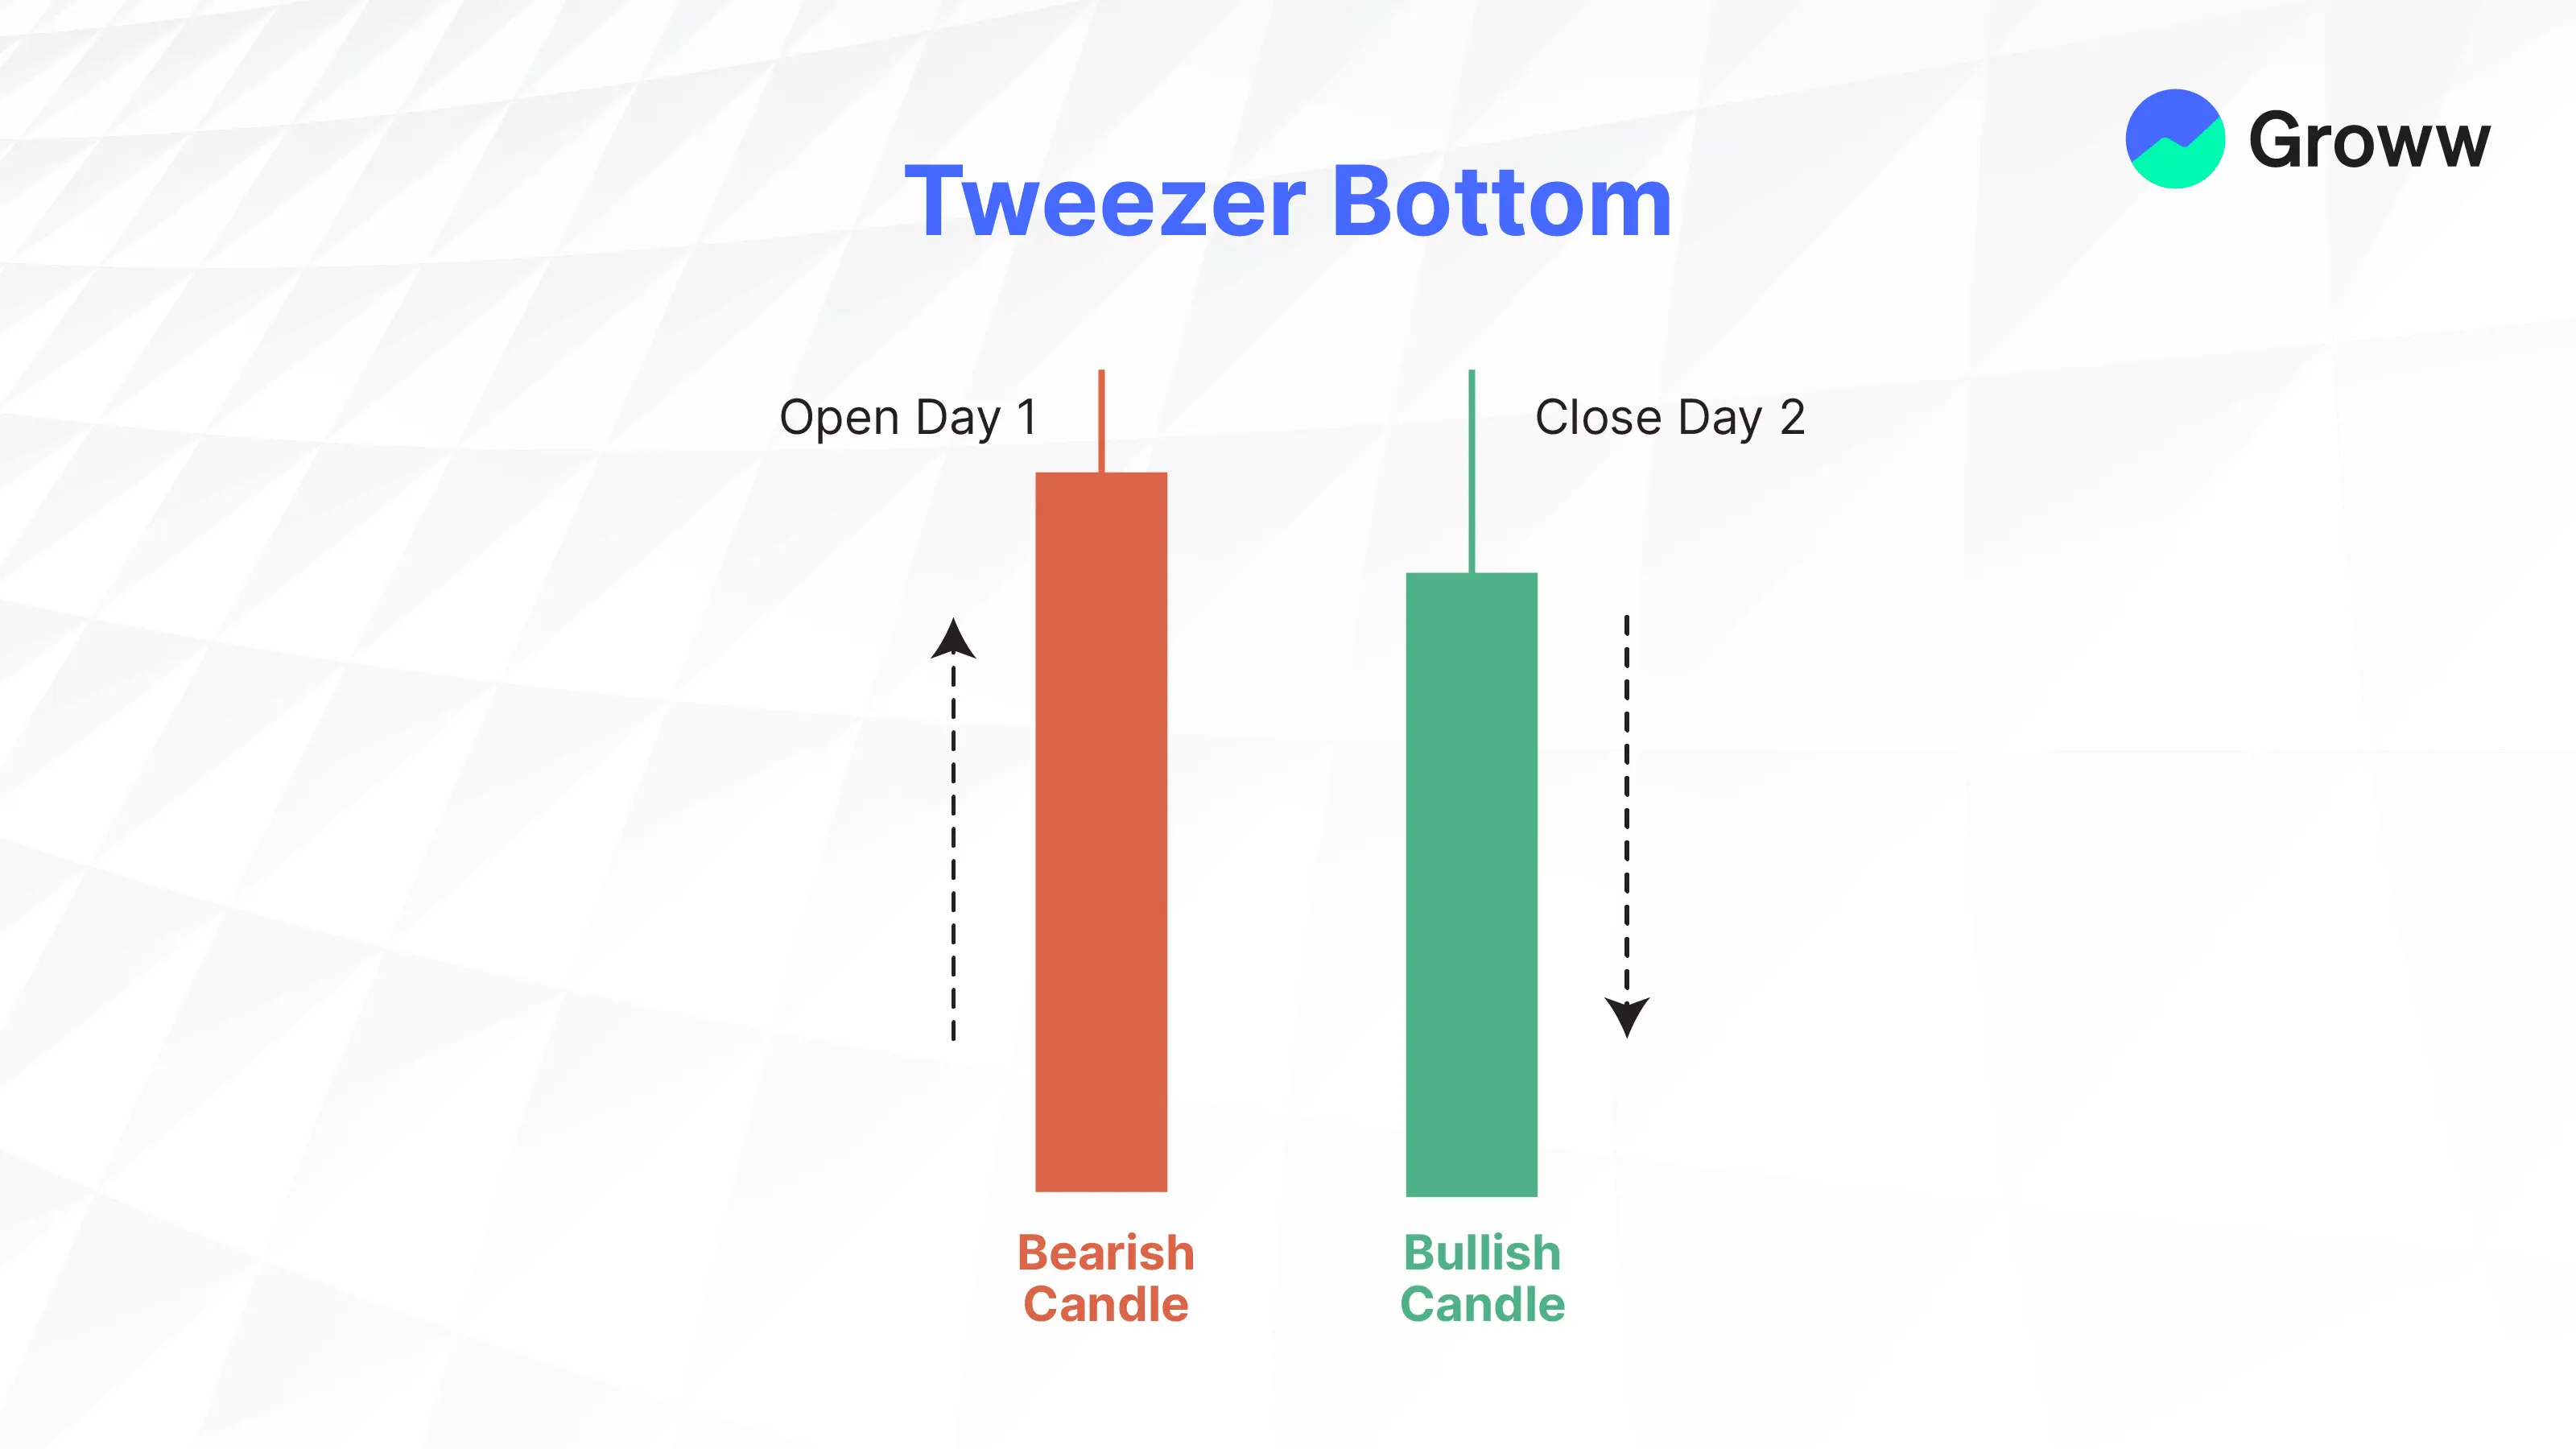
This is the pattern that helps spot a bullish reversal pattern at the bottom of a downtrend. The pattern comprises two candles with similar lows, with the second candle a bullish one with an equal-length body and shadow. It also shares the same low as the first candle. It is just the opposite of the Tweezer tops pattern, since it follows an extended downtrend.
The pattern indicates an exhaustion of selling pressure, with buyers steadily taking control of the market. The first day will witness the formation of a bearish candlestick, while a bullish candle will form on the next day, with a similar low as the candlestick on the previous day.
Harami (Bullish/Bearish)
The Harami pattern comes with two candlesticks, and the second candle is entirely contained in the first candle’s body. A bullish Harami is a reversal pattern in which a small bearish candle is followed by a larger bullish candle that engulfs it. The bearish Harami is another reversal pattern in which a small bullish candle is followed by a larger bearish candle that engulfs it.
Bullish Harami Line:
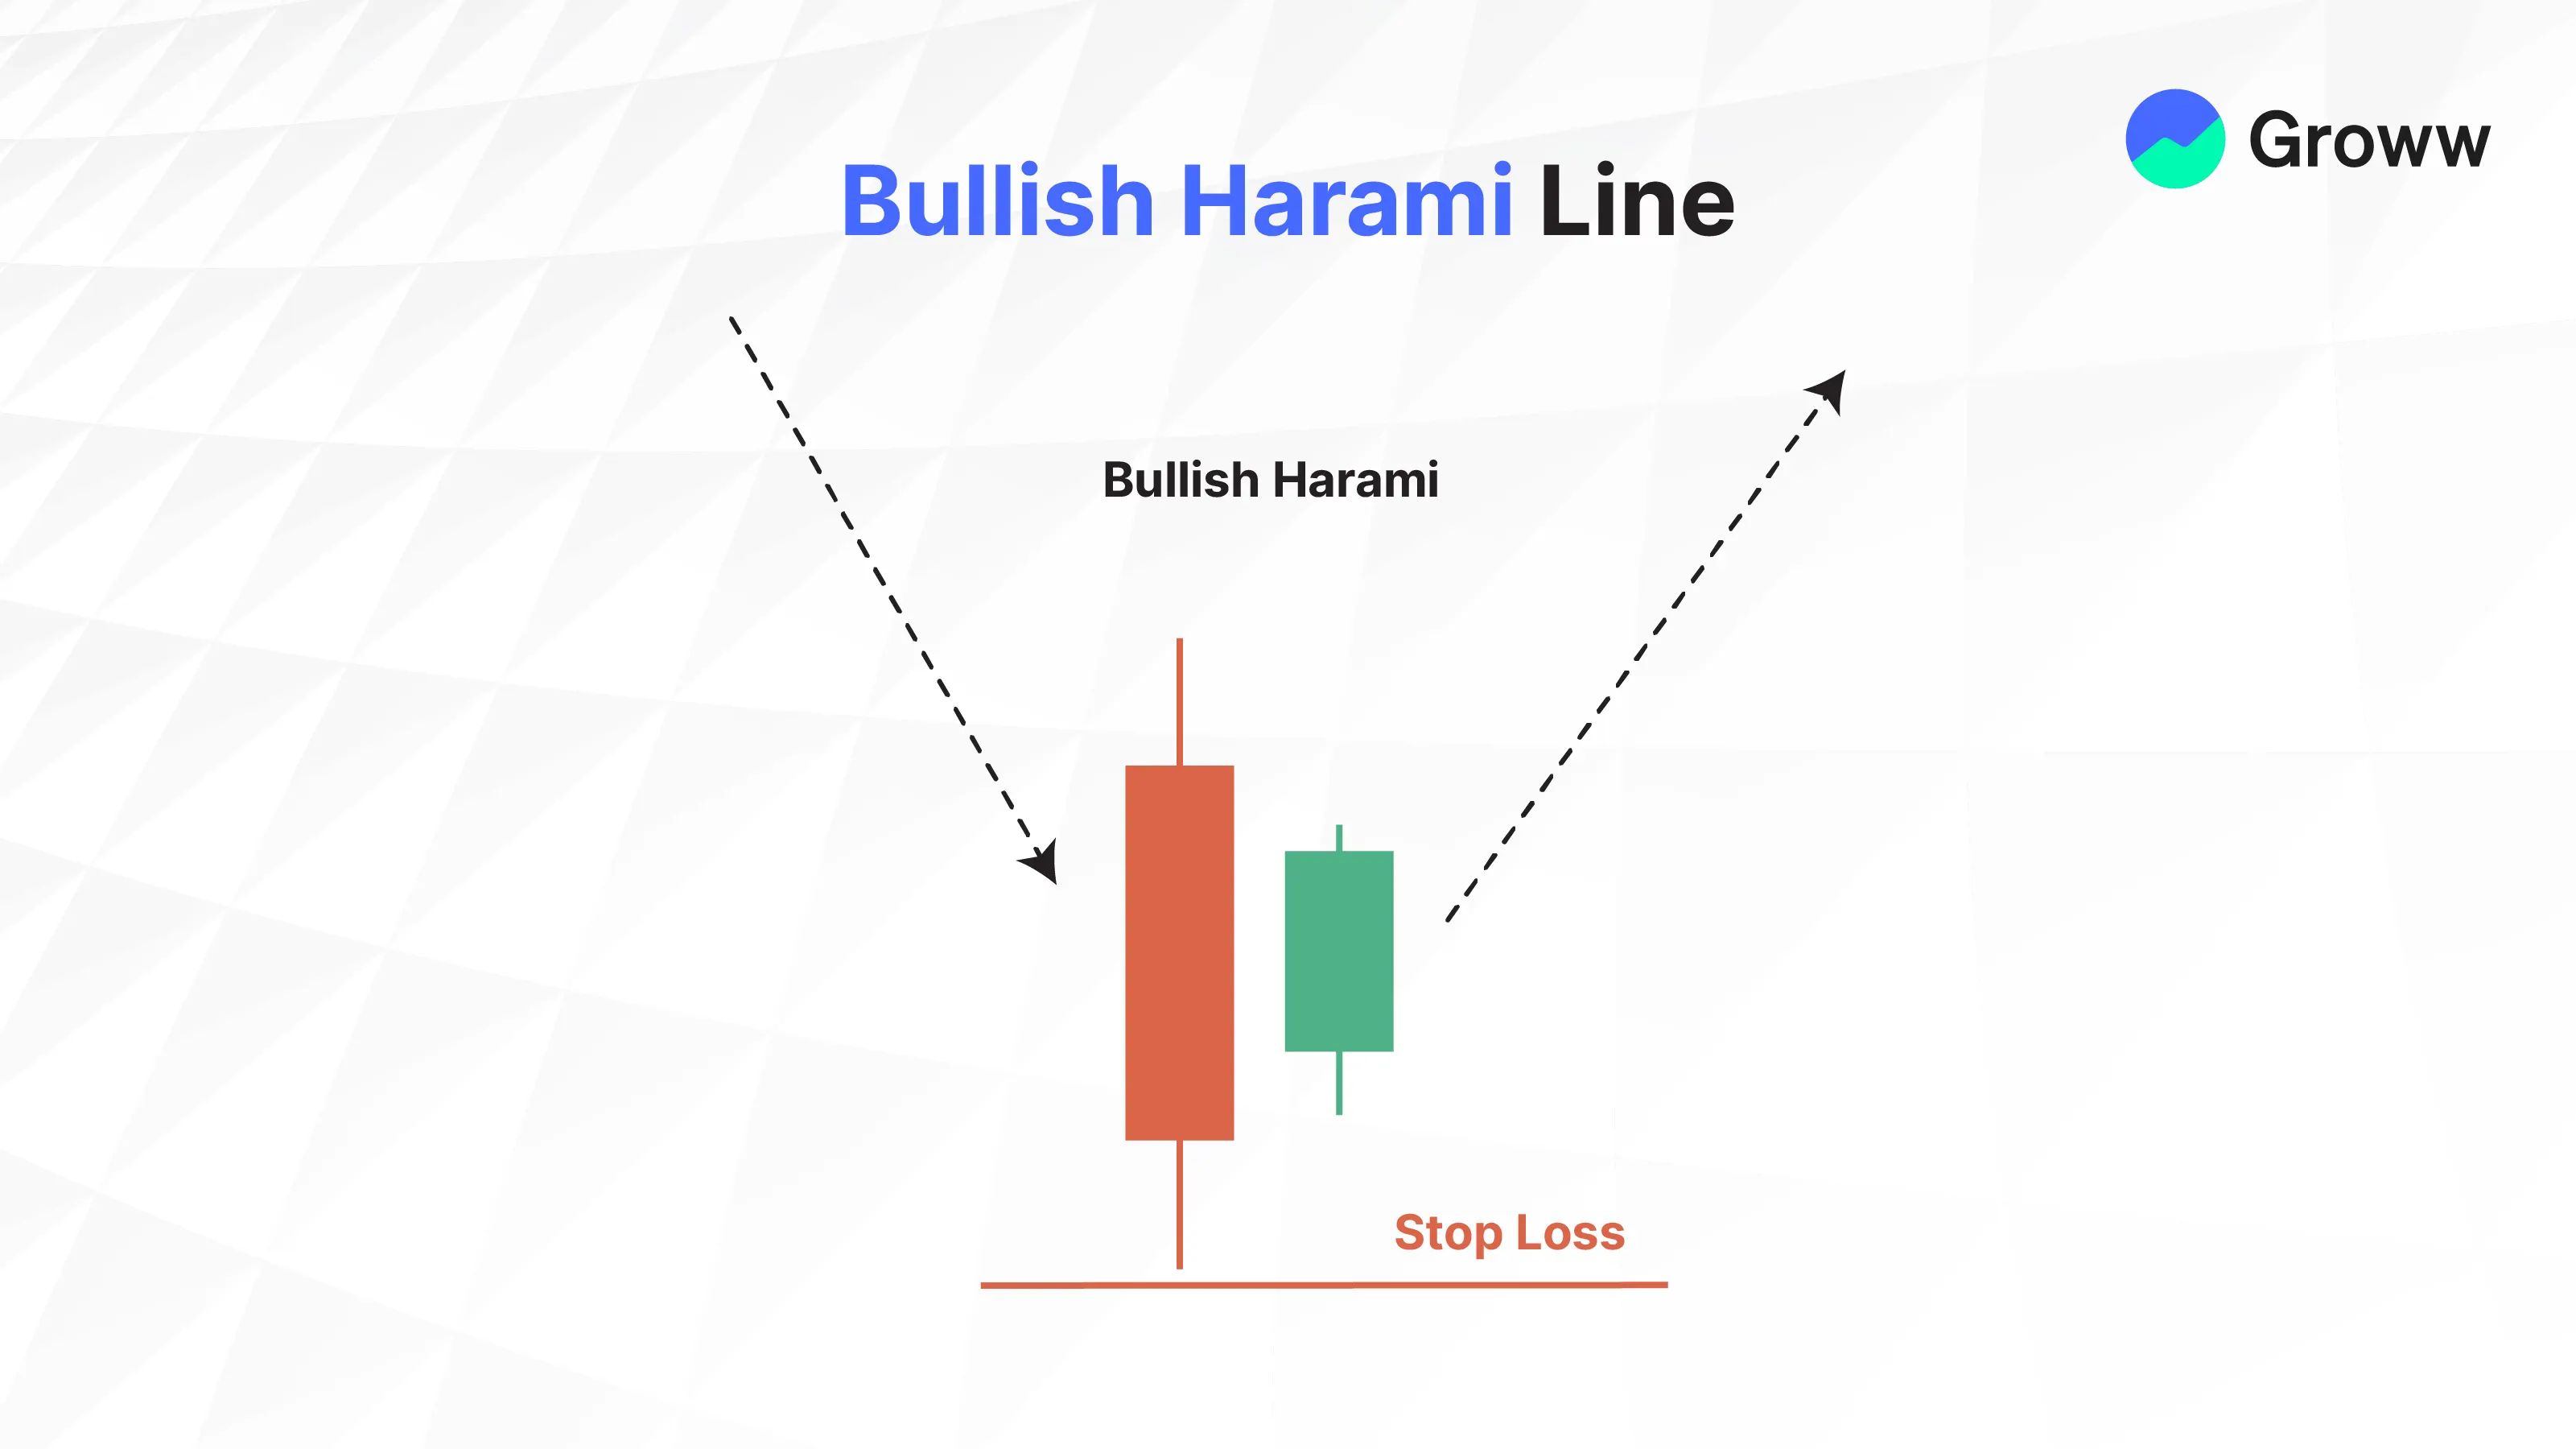
This is a pattern that forms during the downturn and signals a possible reversal in market direction. Bullish Harami lines usually indicate a slight price increase, suggesting the end of a bearish trend. The line comprises a bearish candle with a big body and a bullish candle with a small body that is encircled within the prior candle’s body.
The small bullish candlestick indicates a period of market hesitation. In contrast, its position within the earlier day’s body indicates that bears are losing momentum as the bulls begin to gain control.
The bullish Harami line is a relatively weak reversal pattern, and other technical indicators should be used for confirmation before making trading decisions.
Bearish Harami Line:
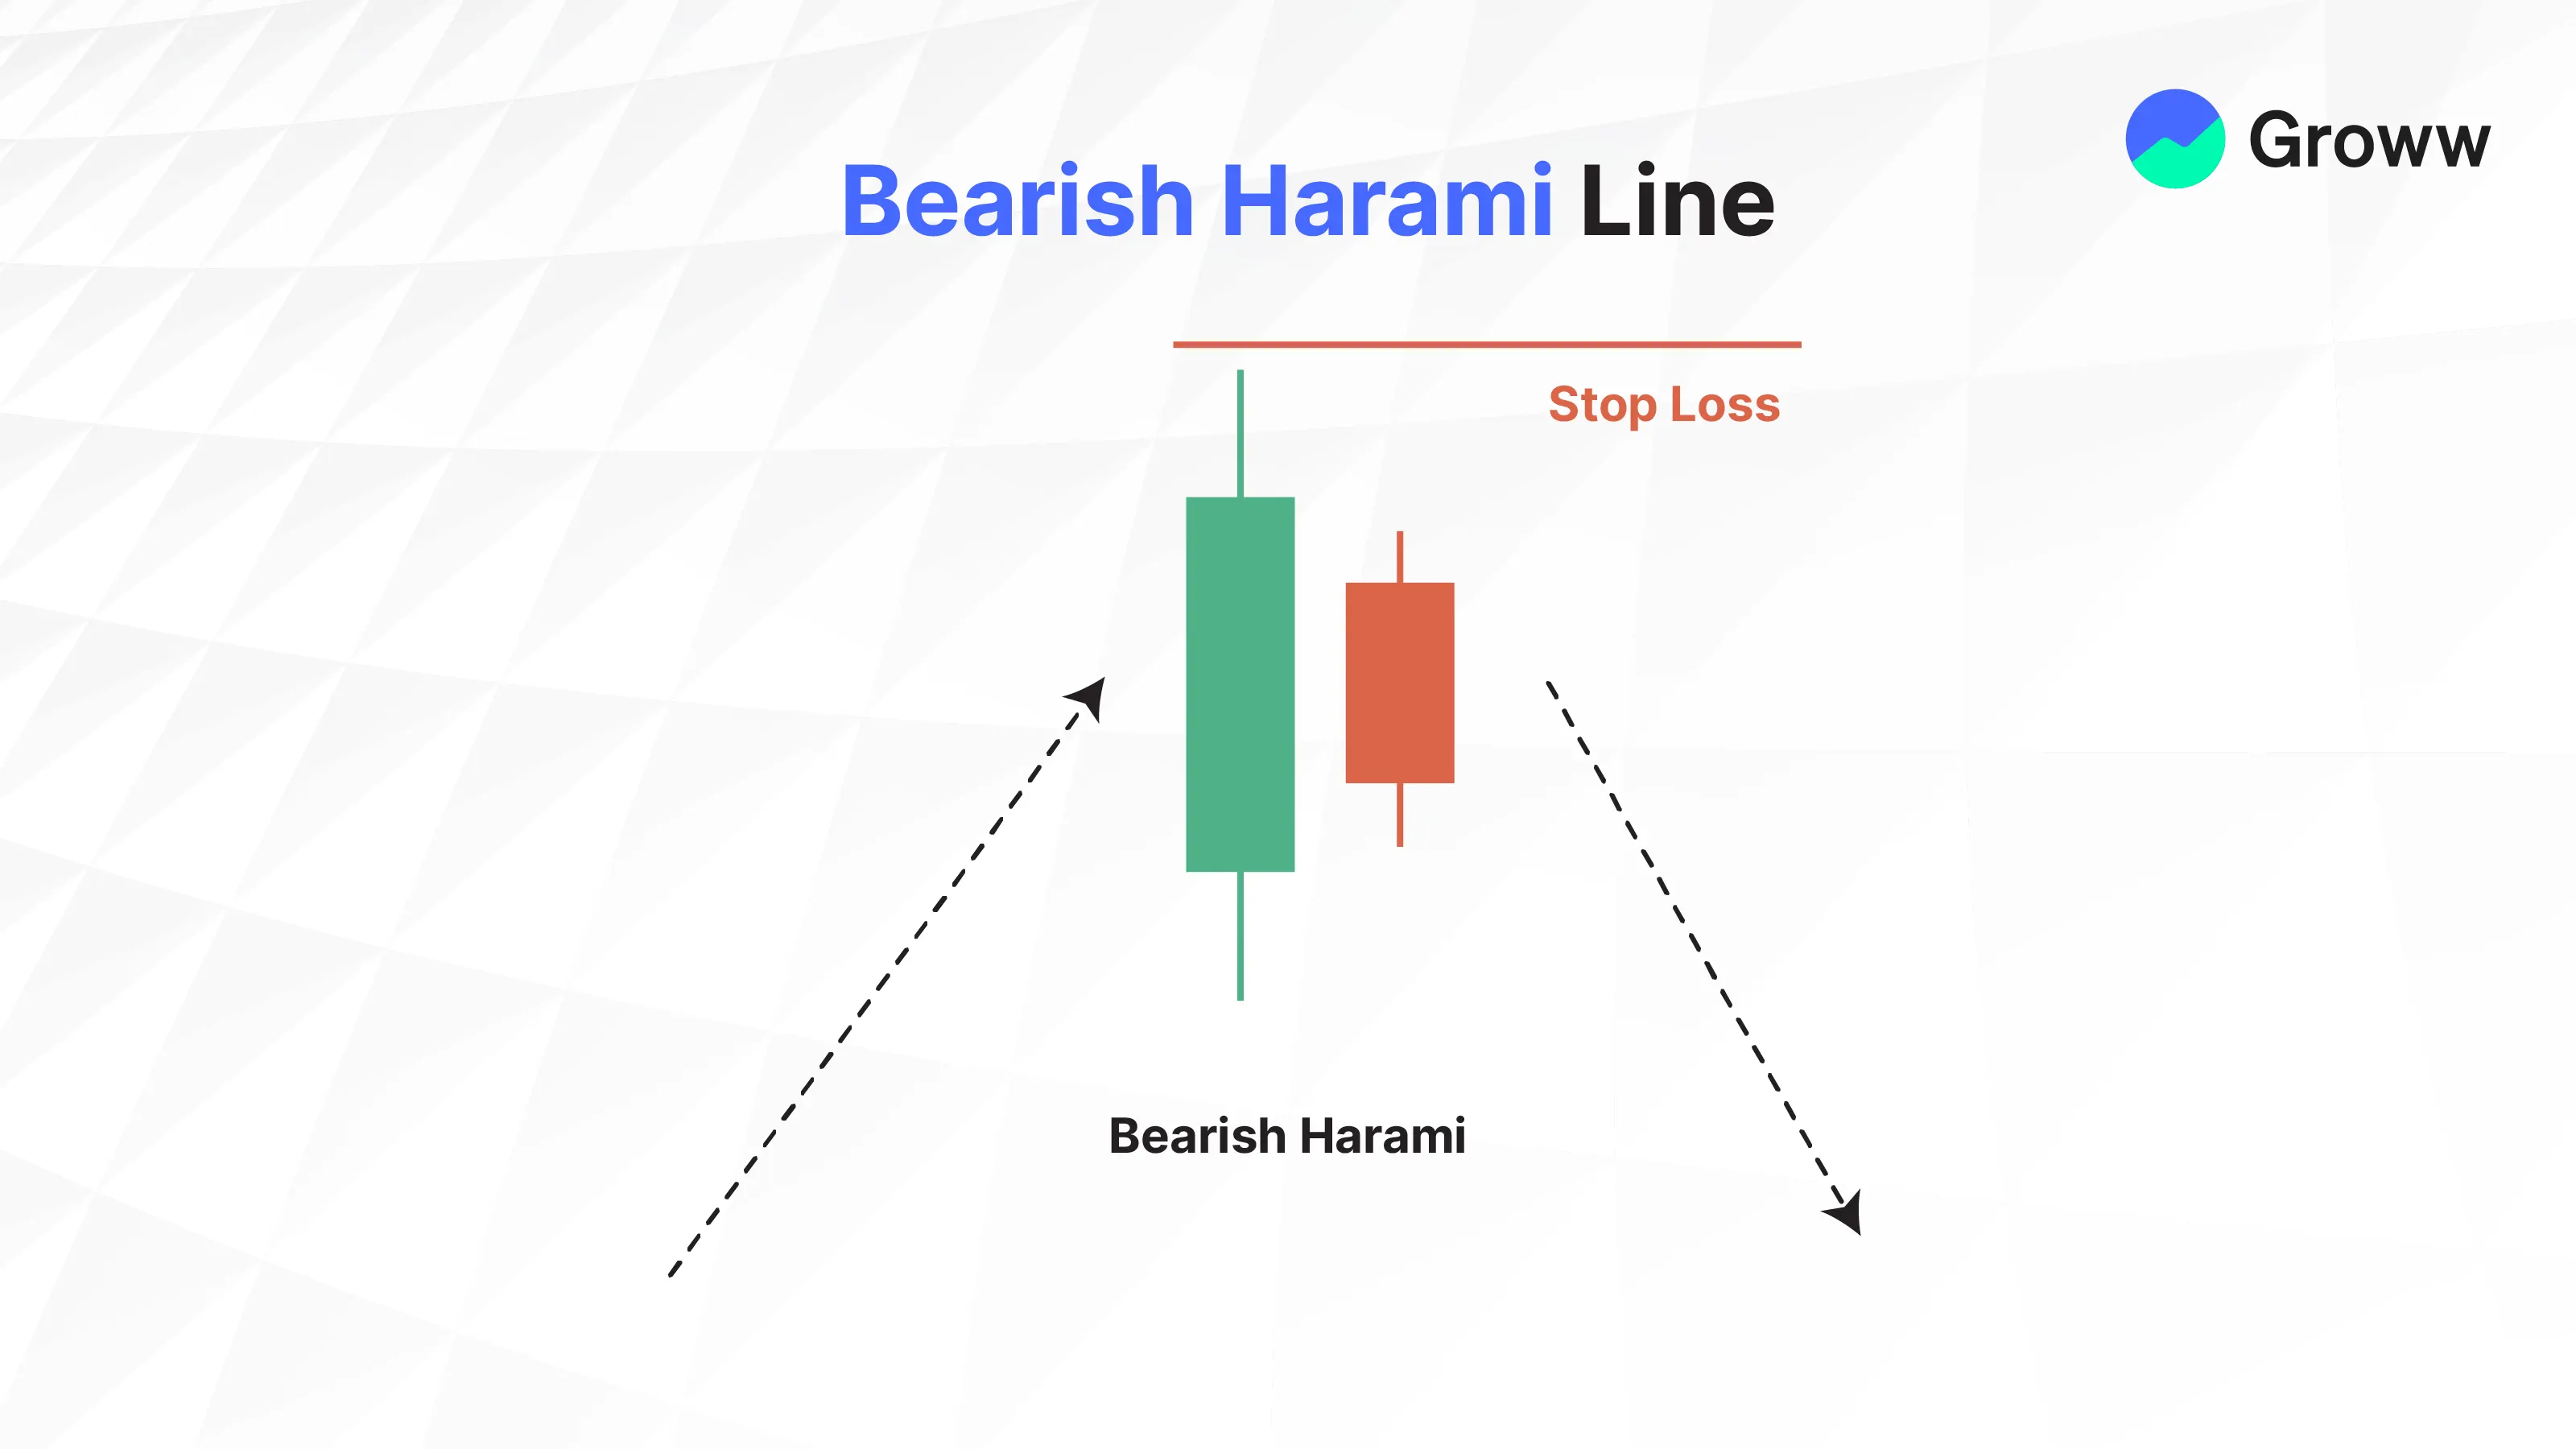
This is a bearish reversal pattern that shows a possible reversal of an uptrend. This is called Harami in Japanese, which means "pregnant." The pattern thus forms with a smaller bearish candlestick that is fully engulfed by the body of the preceding bullish candlestick.
The bearish Harami line indicates buying momentum driven by an uptrend that is now weakening, along with an upcoming sentiment shift among traders.
The opening and closing prices of the second candle should be accommodated within the first candle’s body.
Technical indicators such as the stochastic oscillator and RSI (relative strength index) are used with the Bearish Harami line to confirm a trend reversal.
Kicking Pattern
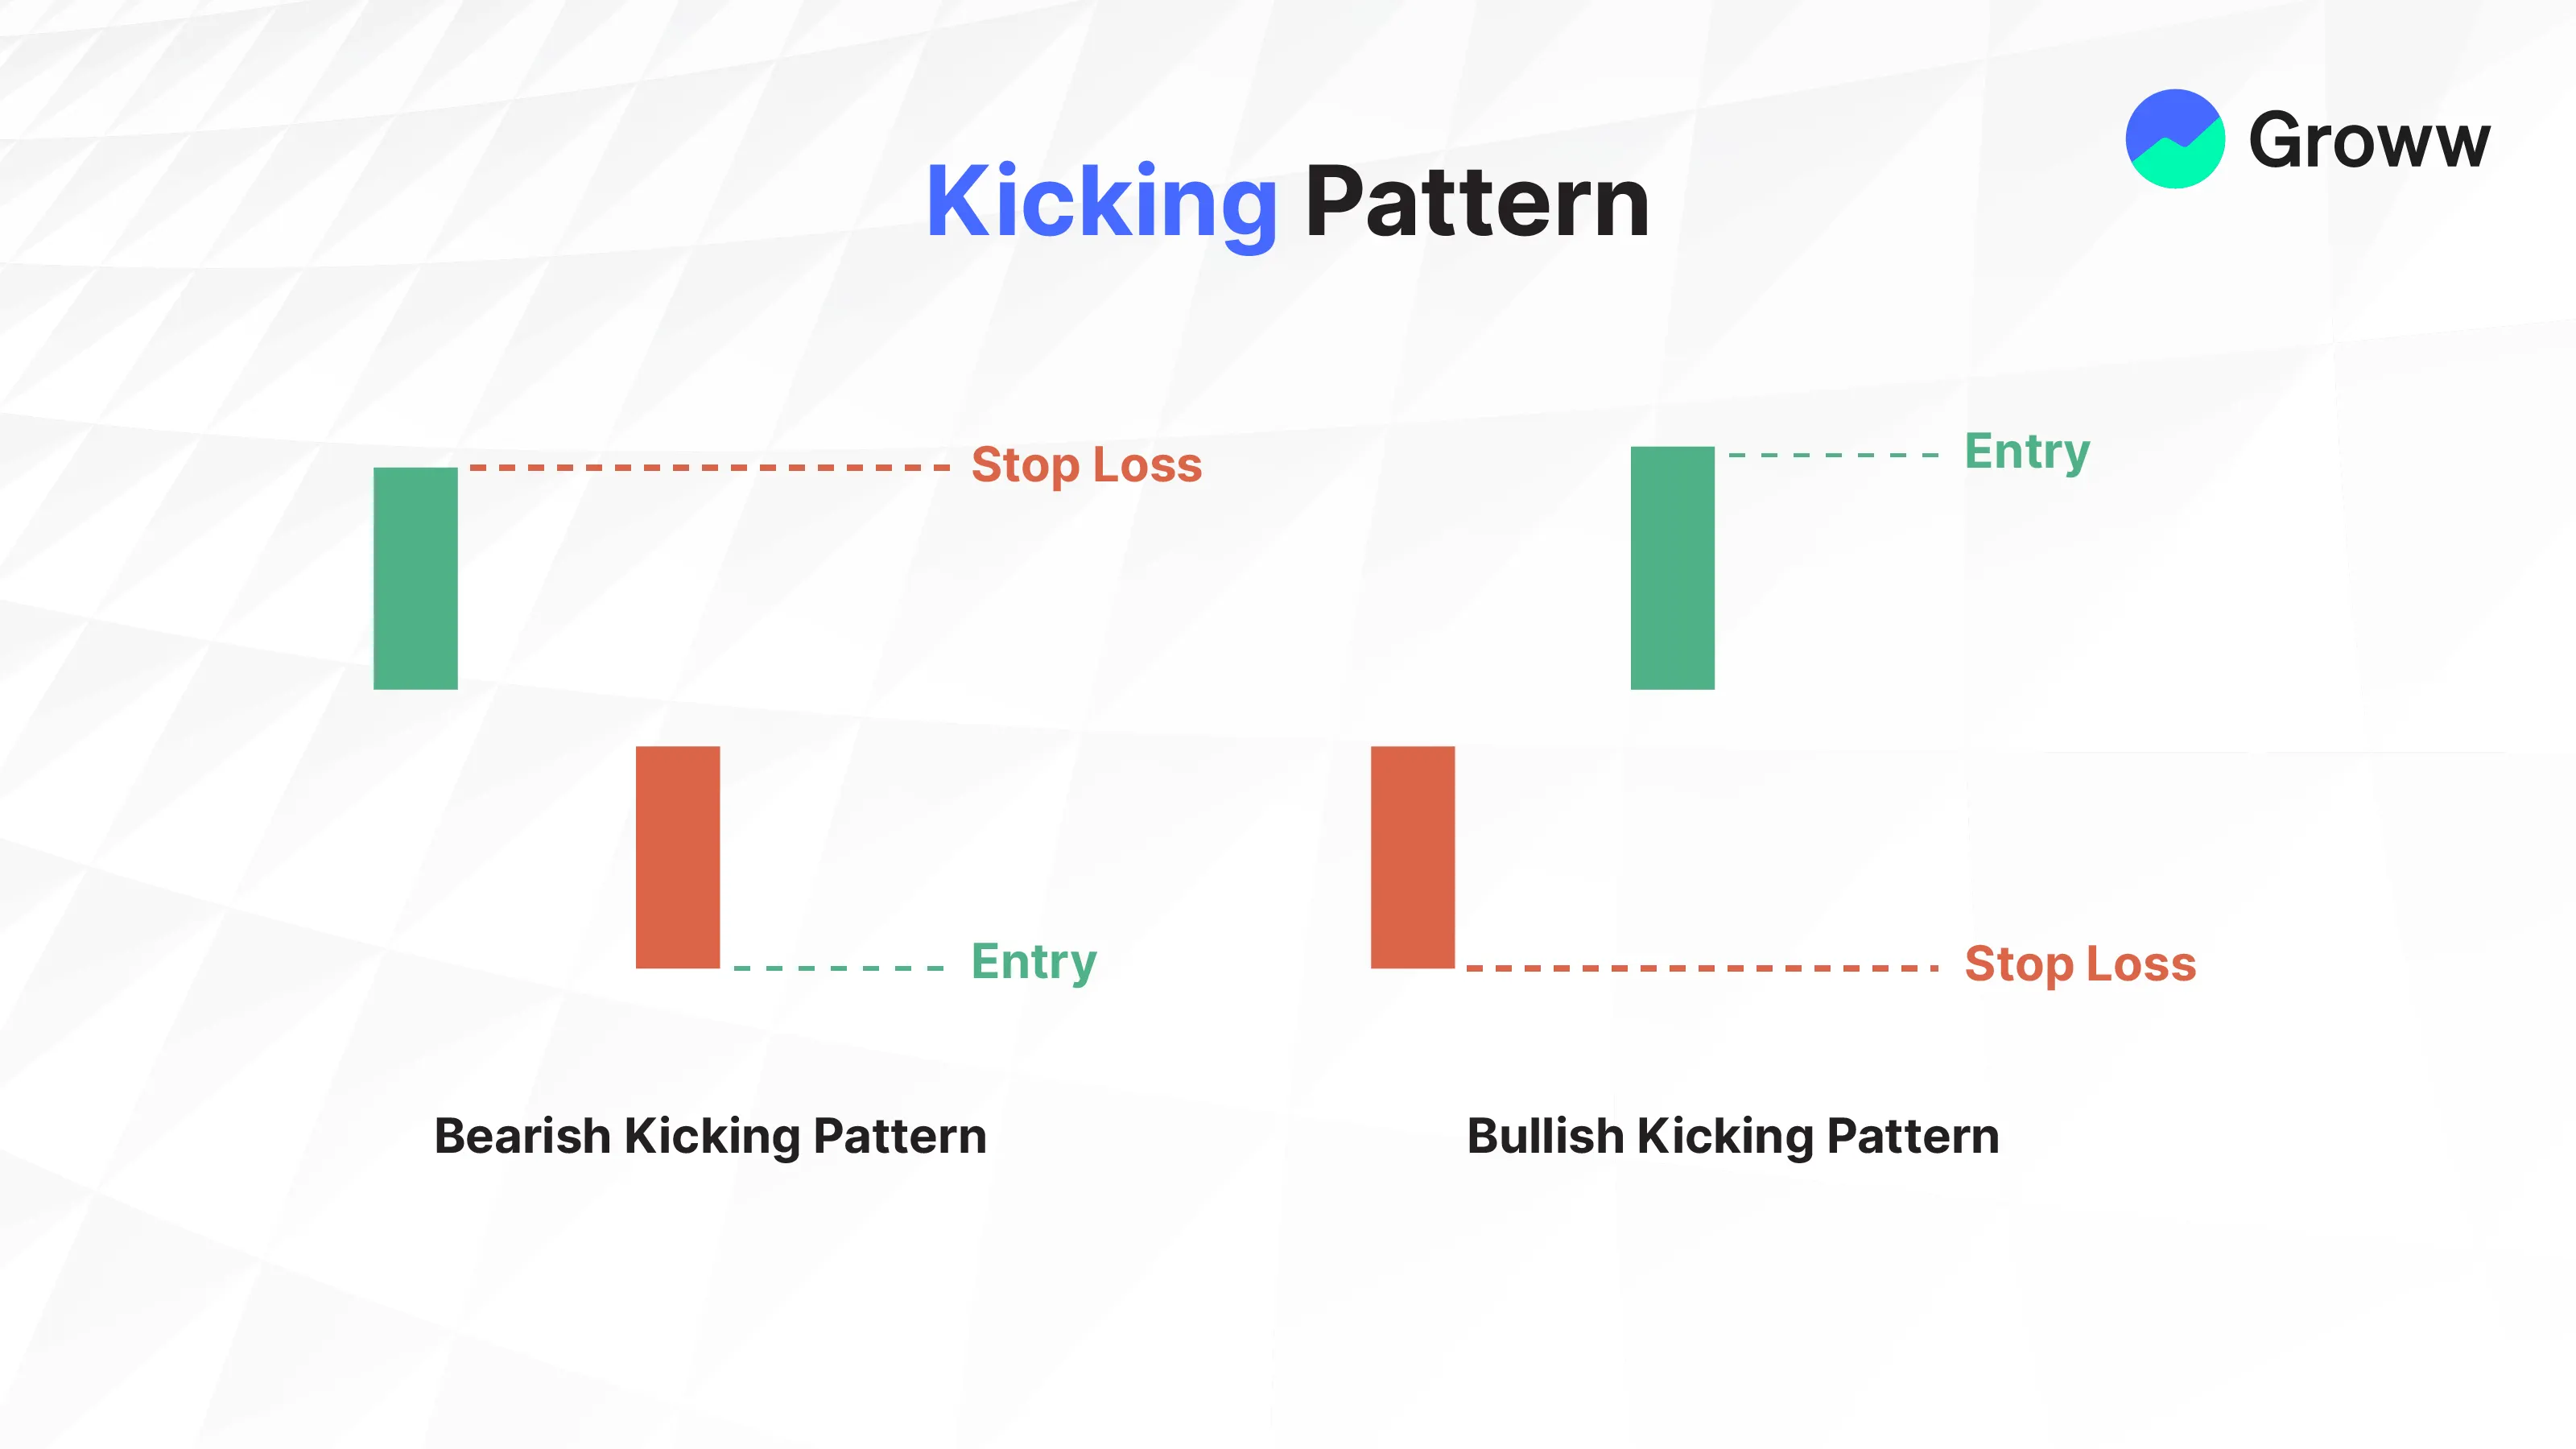
The Kicking pattern is a reversal indicator that usually occurs at the beginning of a trend, during a trend, or at its conclusion. This happens when two candles have large bodies, with one opening higher than the previous day's high and the other opening below the previous day's low. This indicates a sharp price reversal over the range of the two candlesticks.
Traders may use the pattern to determine which group of market participants is controlling the direction. Kicking patterns can either be bullish or bearish.
Matching Low
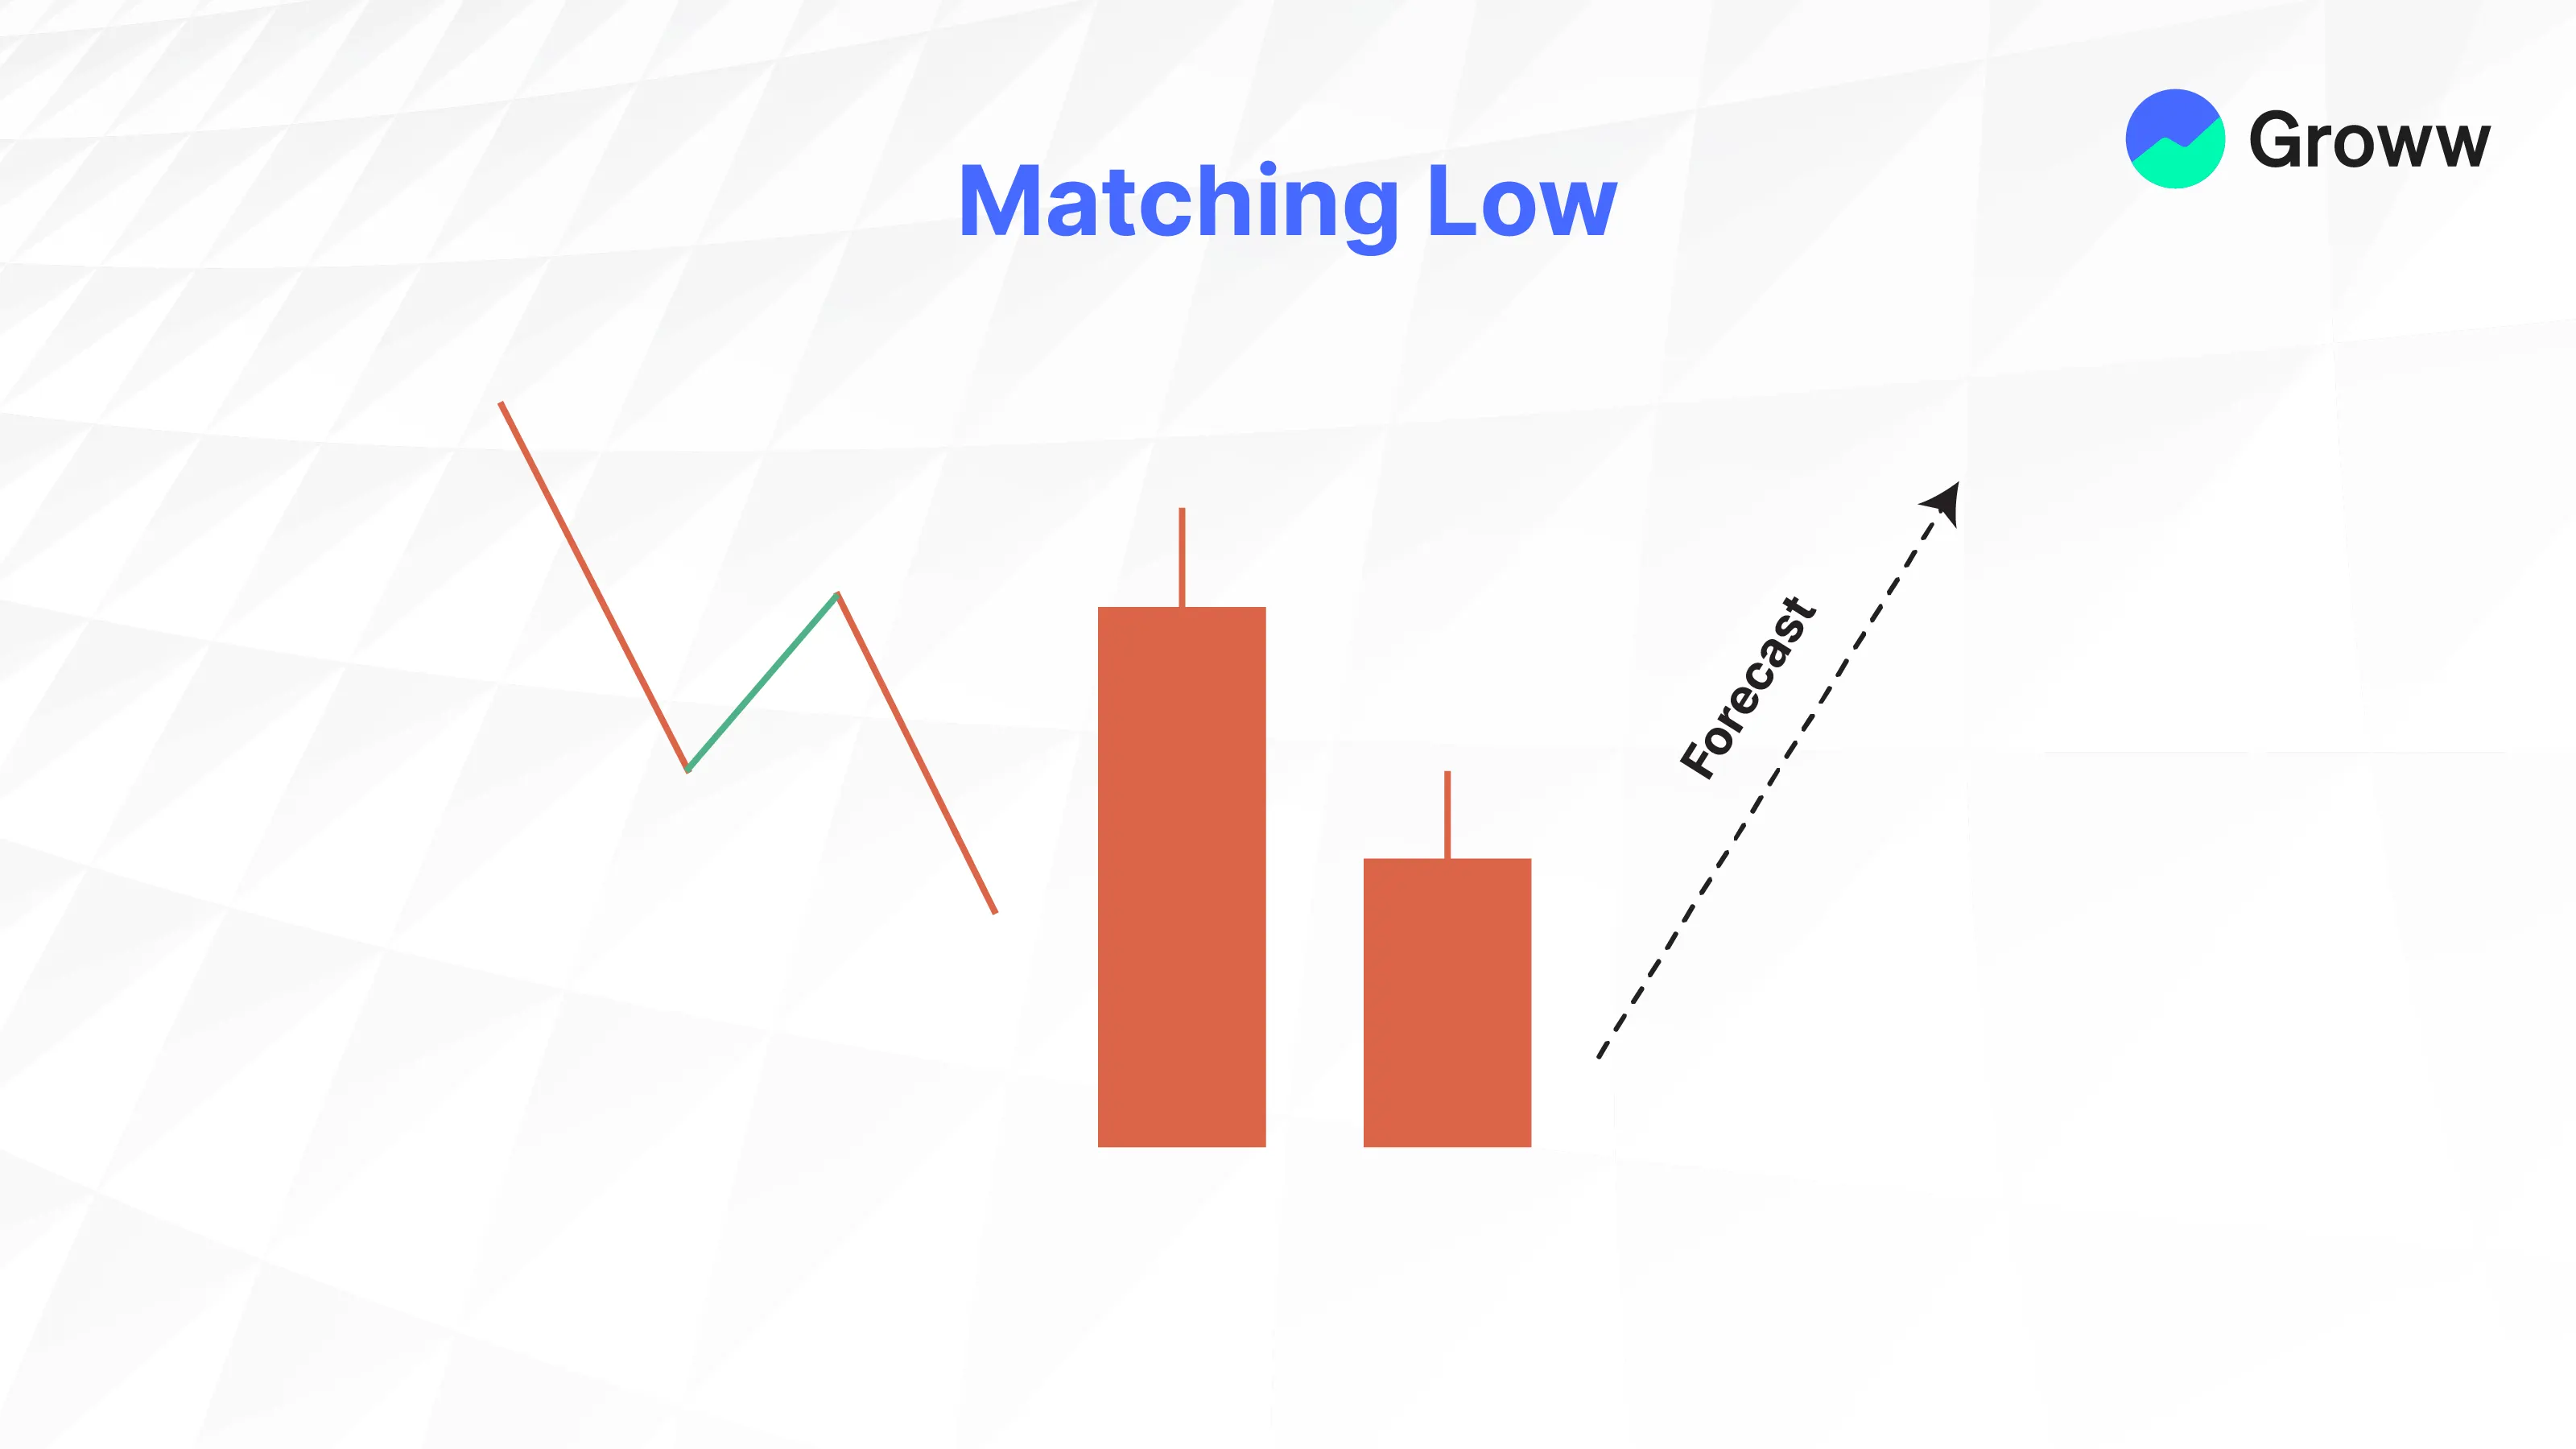
The Matching Low is a specific double-candlestick reversal pattern (bullish) that is among the least frequent on candlestick charts. It occurs after a price decline and signals a possible bottom. The prices may go either way, following the same pattern before continuing to the downside.
The first candle will have a long black body, and the second one will have the same closing at around the same price threshold as the close of the first candle.
This hints at lower selling pressure, while suggesting that bearish trends are losing steam and buyers are again stepping in.
The key point is that, despite the low shadows, both candles show similar closing prices. Traders may anticipate price rebounds after the matching low pattern.
Trading Implications
Here are some trading implications of double candlestick patterns:
- Bullish engulfing patterns indicate a potential shift from a downtrend to an uptrend. This means buyers have taken control, and prices are likely to rise. It could thus be a buy signal, particularly if it appears at the bottom of a downtrend.
- Bearish engulfing patterns signal a shift from an uptrend to a downtrend, with sellers gaining control and prices expected to fall. This may be a sell signal, particularly if it occurs at the top of an uptrend.
- The bullish Harami indicates a trend reversal, though it is not as strong as an engulfing pattern. This may be a possible buy signal in a downtrend, although you should confirm it with other indicators.
- A bearish Harami could signal a reversal and be a potential sell signal in an uptrend. However, the same confirmation is necessary with other technical indicators.
- Piercing line patterns suggest stronger buying pressure, with buyers moving prices upwards despite an earlier downtrend. The buy signal may come when the price breaks through the earlier candle’s resistance level.
- The Tweezer Bottom pattern indicates a trend reversal towards an uptrend, while the Tweezer Tops pattern indicates a reversal to a downtrend. This may have potential buy or sell signals for you to respond to.
- These patterns are usually more dependable when they occur at the conclusion of a trend. These should be confirmed with other indicators, such as moving averages and volume, before finalising one’s investment strategies.
Entry and Exit Strategies
Here are some entry and exit strategies worth considering:
- You may enter the trade after the formation of the second candlestick, depending on the signal of the same. For example, a bullish engulfing pattern indicates a potential buy entry.
- Stop-loss orders are usually placed below the bearish candle’s low (for bullish patterns) or above the bullish candle’s high (for bearish patterns). They help restrict any possible losses.
- You may exit depending on factors such as the pattern reversal, reaching your profit targets, or using indicators like moving-average analysis.
- Double candlestick patterns are usually more reliable when they are confirmed by other indicators or price action analysis. High volume during the pattern formation may make the signal more credible.
Limitations and Confirmations
Some of the limitations of double candlestick patterns include:
- Interpretation may vary from trader to trader, leading to misleading decisions.
- These patterns may generate false signals at times, suggesting a possible trend reversal that doesn’t materialise.
- Traders should wait for the second candle to form correctly and break any key level (resistance/support) to confirm the pattern in question and its overall validity.
- In the forex markets, double candlestick patterns may not always show the usual gap between the candles, thereby requiring newer interpretations.
- There is no guarantee the trend will continue, and prices may not move in the anticipated direction after the confirmation candle appears.
Here’s how you can confirm the pattern with the help of other indicators/aspects:
- High volumes on the confirmation candle may indicate a stronger signal and increase your confidence regarding the pattern.
- If the pattern appears at any key resistance or support level, it may be more reliable for you.
- Breaking any key level (on the second candle) may also provide stronger confirmation of the pattern.
- A subsequent candle continuing the trend indicated by the pattern may offer additional confirmation.
In Conclusion
Double candlestick patterns may be helpful for technical analysis, although you should only use them in combination with other indicators. Have a proper risk management strategy in place and understand the limitations and risks of the pattern before making trading decisions.