What Are Technical Indicators?
A technical indicator uses past stock prices and other data, such as volume or open interest, to make an informed estimate of how the market will move in the future. Traders and investors employ these indicators to determine when to buy or sell. Technical indicators enable traders to make data-driven and informed decisions.
Indicators are represented on charts, making it easier to notice trends. These indicators can help you determine whether an asset is oversold or overbought, assess the trend’s strength, and gauge price volatility.
How Technical Indicators Work
Technical indicators function by applying mathematical formulas to historical market data (volume, price, etc.) to generate signals, identify trends, and map momentum. Here’s how they usually work:
- They process raw data, including trading volumes, closing prices, open interest, etc.
- The formulas then convert the data into patterns or visual lines on charts.
- Technical indicators help identify repeating patterns, the trend strength, or momentum shifts.
- They also provide signals like the following:
- Trend Indicators that show the direction (MACD, Moving Averages)
- Momentum Indicators for measuring speed to identify oversold/overbought conditions (RSI, Stochastic Oscillator)
- Volatility indicators that show price fluctuations, like Bollinger Bands.
- Volume Indicators to confirm the price movement strength like OBV.
They help identify the following factors:
- Trend Direction: Whether prices are going up, down, or sideways.
- Momentum: How fast the prices are changing.
- Oversold/Overbought Conditions: Whether a stock is too low or high, indicating a possible reversal.
- Exit/Entry Points: When to sell or buy, depending on the signals.
Some key indicator categories include:
- Trend Following: Smooth price figures to indicate underlying trends, such as Moving Averages.
- Momentum Oscillators: They help identify price changes and speed, such as the MACD and RSI.
- Volatility Indicators: Help measure price fluctuations, such as Bollinger Bands.
- Volume Indicators: Help gauge buying or selling pressure, such as On-Balance Volume.
Types of Indicators
Here are some insights into the types of indicators that you may come across -
Leading vs Lagging
- Technical indicators are of two types - lagging and leading
- Leading indicators forecast potential price movements and trend reversals before their occurrence.
- Lagging indicators, on the other hand, confirm existing trends by analysing historical prices. They are considered to be more reliable. However, they often provide signals too late, which can hamper traders' decision-making.
Trend, Momentum, Volatility, and Volume Indicators
- Trend indicators show the upward or downward movement in prices
- Momentum indicators show how quickly stock prices are changing, whereas volatility indicators help determine the risks associated with market movements.
- These indicators help measure the strength, direction, and speed of price action.
- Traders can combine two or more indicators to get a better understanding of the market movements.
Overlays and Oscillators
Overlays:
- They are directly applied on the price chart, sharing the same scale as the price, thereby helping identify support/resistance levels, volatility levels, and trends.
- Some examples include Moving Averages (price data indicates trend direction), Parabolic SAR (helps determine potential stops and trend reversals), Bollinger Bands (measures volatility and possible price extremes), and VWAP (Volume-Weighted Average Price), which indicates the average price weighted by volume.
Oscillators:
- Moves between the set limits in a dedicated panel right below the price chart, thereby showing the overbought/oversold and the momentum levels.
- Some examples include the RSI (Relative Strength Index), which tracks the price movement changes and speed, the Stochastic Oscillator, which compares the closing price to a price range over a period of time, the Moving Average Convergence Divergence which indicates the relationships between two moving averages, and the Money Flow Index which is the volume-weighted RSI that indicates selling and buying pressure.
How Indicators Help in Decision-Making
Technical indicators help traders make informed trading decisions. These indicators provide insights into price trends, momentum, volatility, and volume. For example, traders can use moving averages to identify market trends and RSI to spot oversold and overbought conditions. Bollinger Bands help in identifying volatility and alert traders to potential breakouts.
Most Common Indicators
Here are some of the most common indicators:
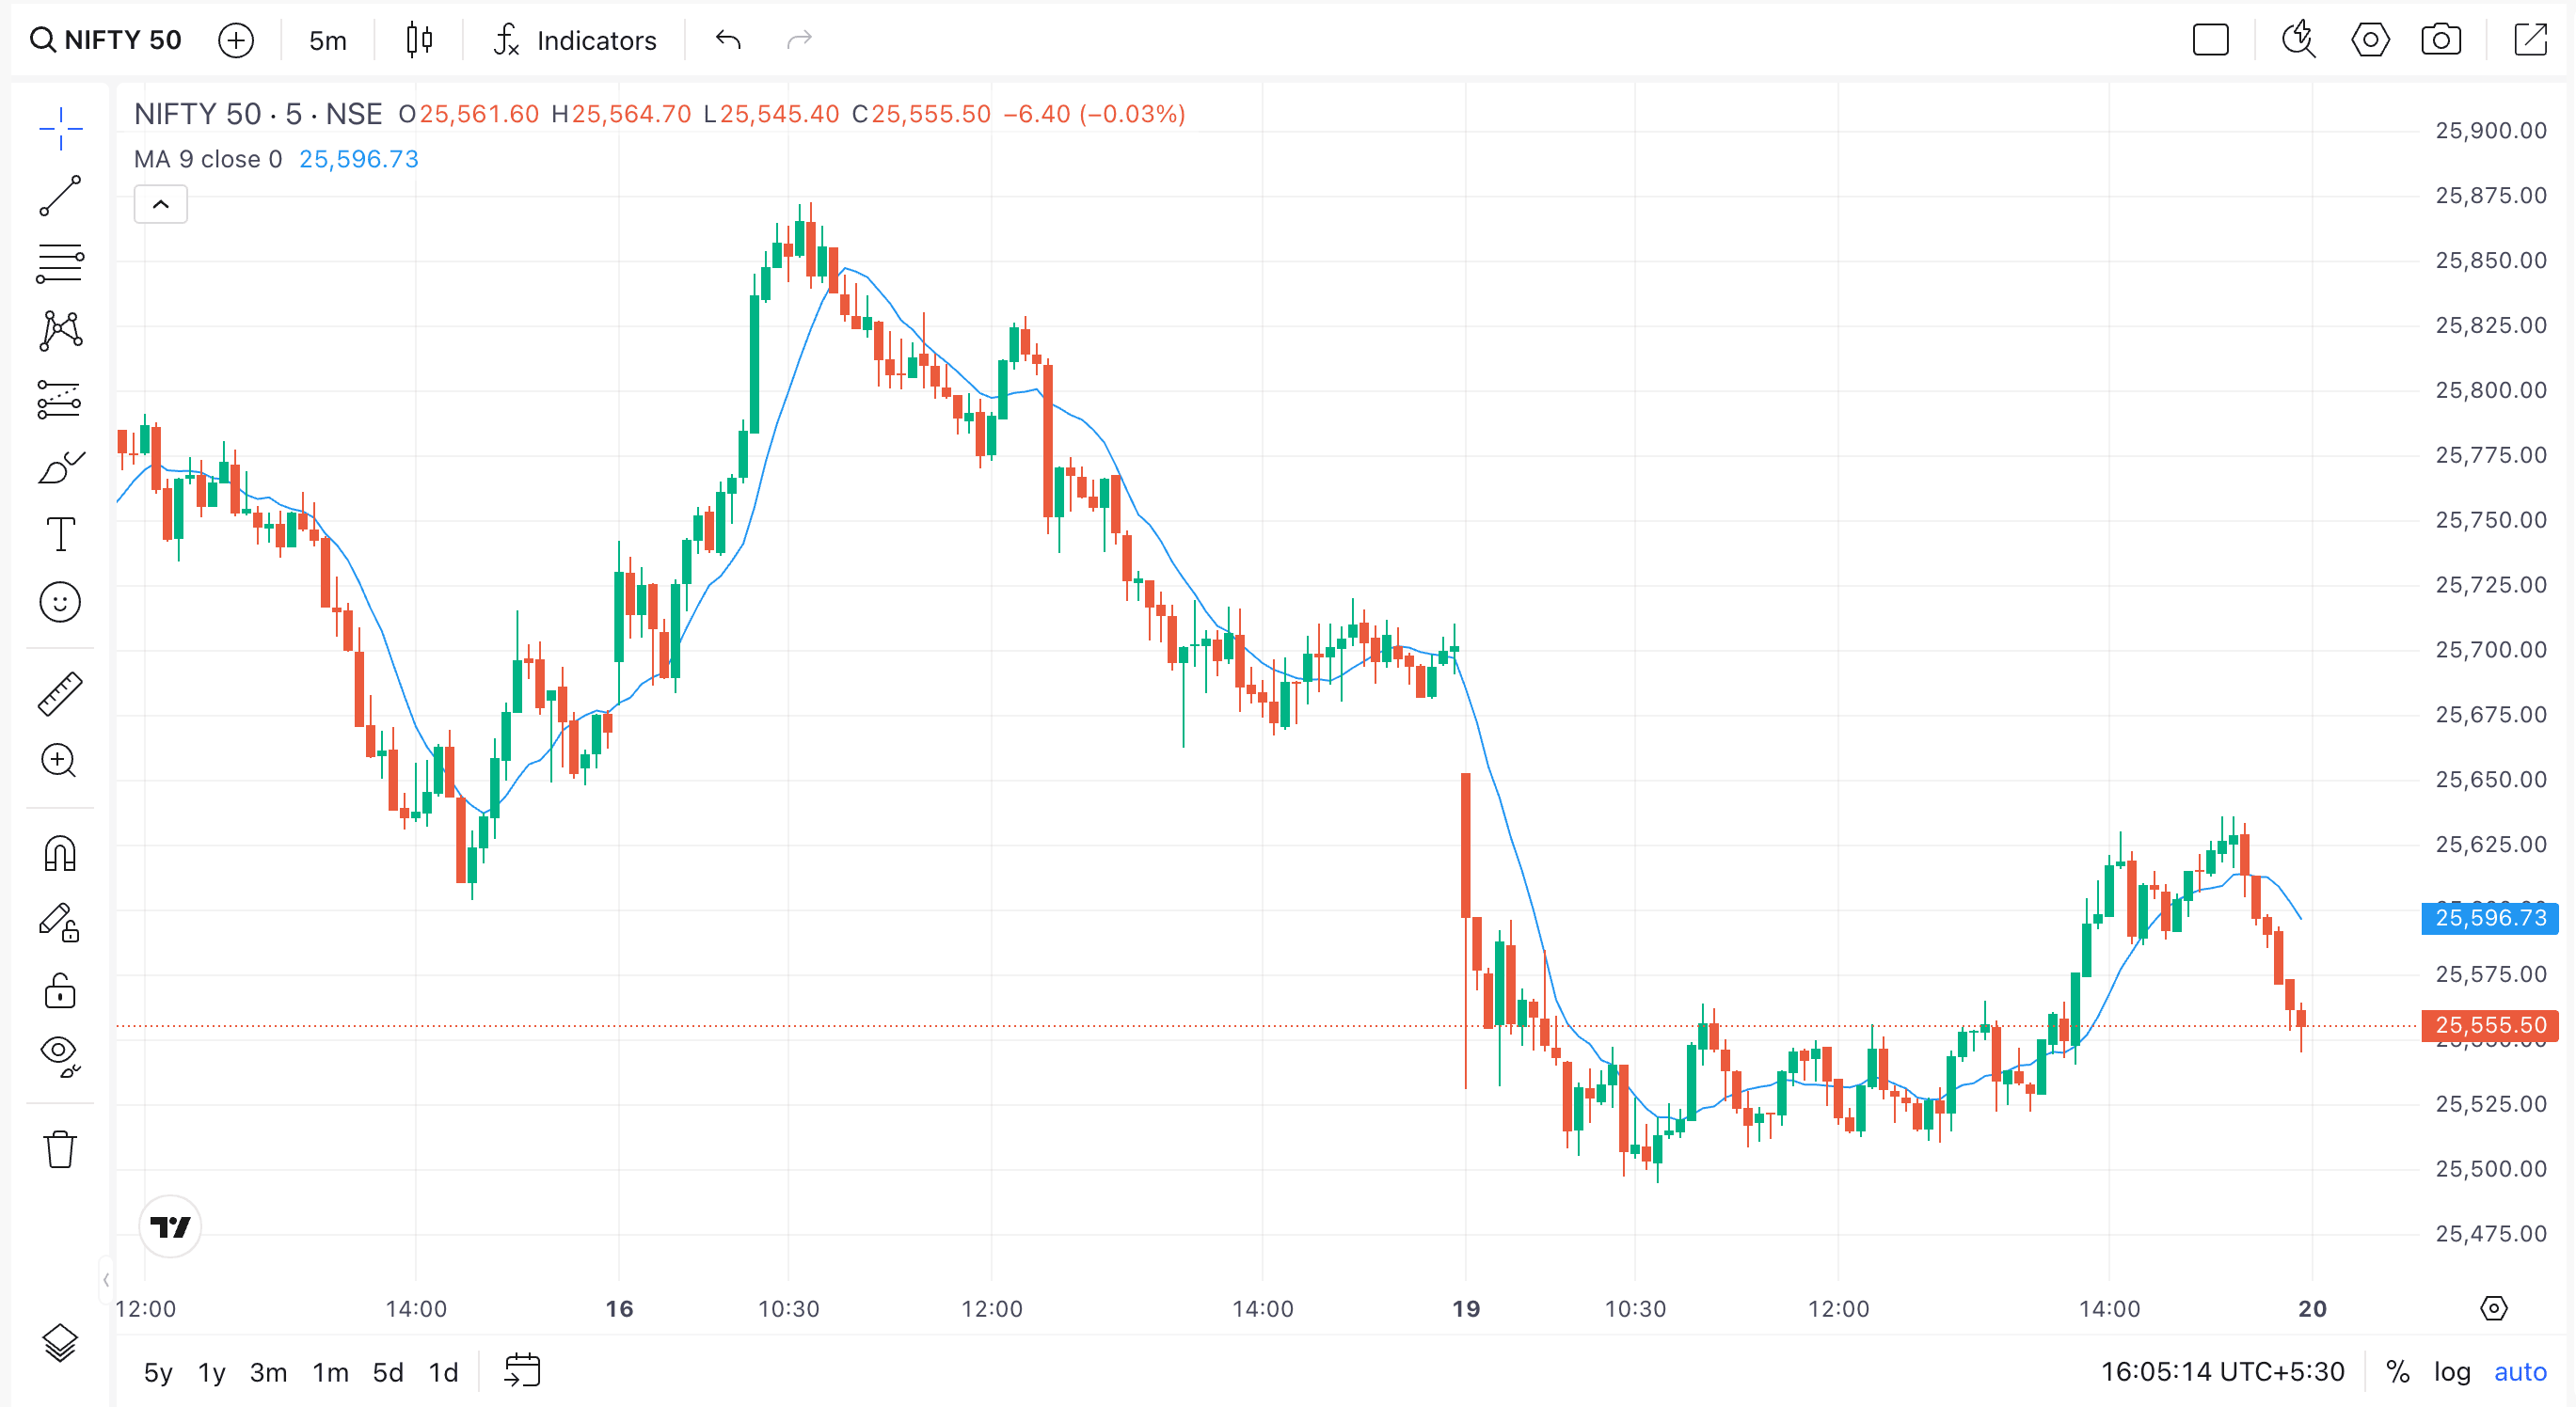
Moving Averages
Moving averages show the market's general direction by analysing price changes over time.
Formula/Calculation Method:
The most standard types are the SMA (Simple Moving Average) and the EMA (Exponential Moving Average).
The formula for the SMA is the Sum of Closing Prices Over ‘N’ periods/N.
On the other hand, the formula for EMA is the (Closing price * Multiplier) + (EMA of previous day * (1 - Multiplier)).
In this case, Multiplier = 2 / (Period + 1).
Interpretation Rules:
A rising Moving Average (MA) shows an uptrend, while a falling MA shows a downtrend. MAs often act as dynamic support during uptrends and as resistance during downtrends.
Whenever the price consistently trades over the MA, it confirms bullish sentiments in the market. Whenever the price is consistently below the MA, it confirms bearish market sentiment.
Overbought/Oversold Ranges:
Moving averages do not have fixed oversold/overbought ranges, though they may indicate such conditions relative to the average price
If the price moves too far above the long-term MA, it may be considered overbought, while a move too far below the long-term MA may be regarded as oversold.
Traders use the RSI or Bollinger Bands for a more defined range, while RSI readings above 70 are usually taken as overbought, and those lower than 30 are taken as oversold.
Bollinger Bands also indicate how prices touching the upper band are considered overbought, while those hitting the lower band are considered oversold.
Divergence Identification:
Divergence occurs when an asset price moves in one direction, while the moving average shifts in the opposite direction.
In a bullish divergence, the price makes lower lows while the indicator makes higher lows, indicating an upside reversal.
Bearish divergence occurs when the price makes higher highs, while the indicator makes lower highs, thereby indicating a downside reversal.
Trading Signals:
Here are some key aspects worth noting in this regard.
- Crossovers: In the case of a Bullish Crossover, a shorter-term MA crosses above the longer-term MA, while in the case of a Bearish Crossover, the shorter-term MA crosses below the longer-term MA.
- Price Breakouts/Reversal Zones: There is a decisive price movement above a significant MA, thereby confirming a trend reversal or breakout. A break below, however, may indicate a breakdown.
Strengths & Weaknesses:
Some of the strengths include:
- Easy to calculate and interpret
- Ideal for identifying and trading with prevailing trends, while filtering out market clutter
- It is versatile and can be applied across multiple timeframes and markets, and it is compatible with additional indicators.
Some weaknesses include:
- Moving averages are usually based on past prices, which are inherently lagging, potentially delaying signals.
- It may generate false signals in range-bound or choppy markets without any clear existing trend.
- Should not be used by itself, and you should use MAs with other tools for analysis, including oscillators, price action, and volume.
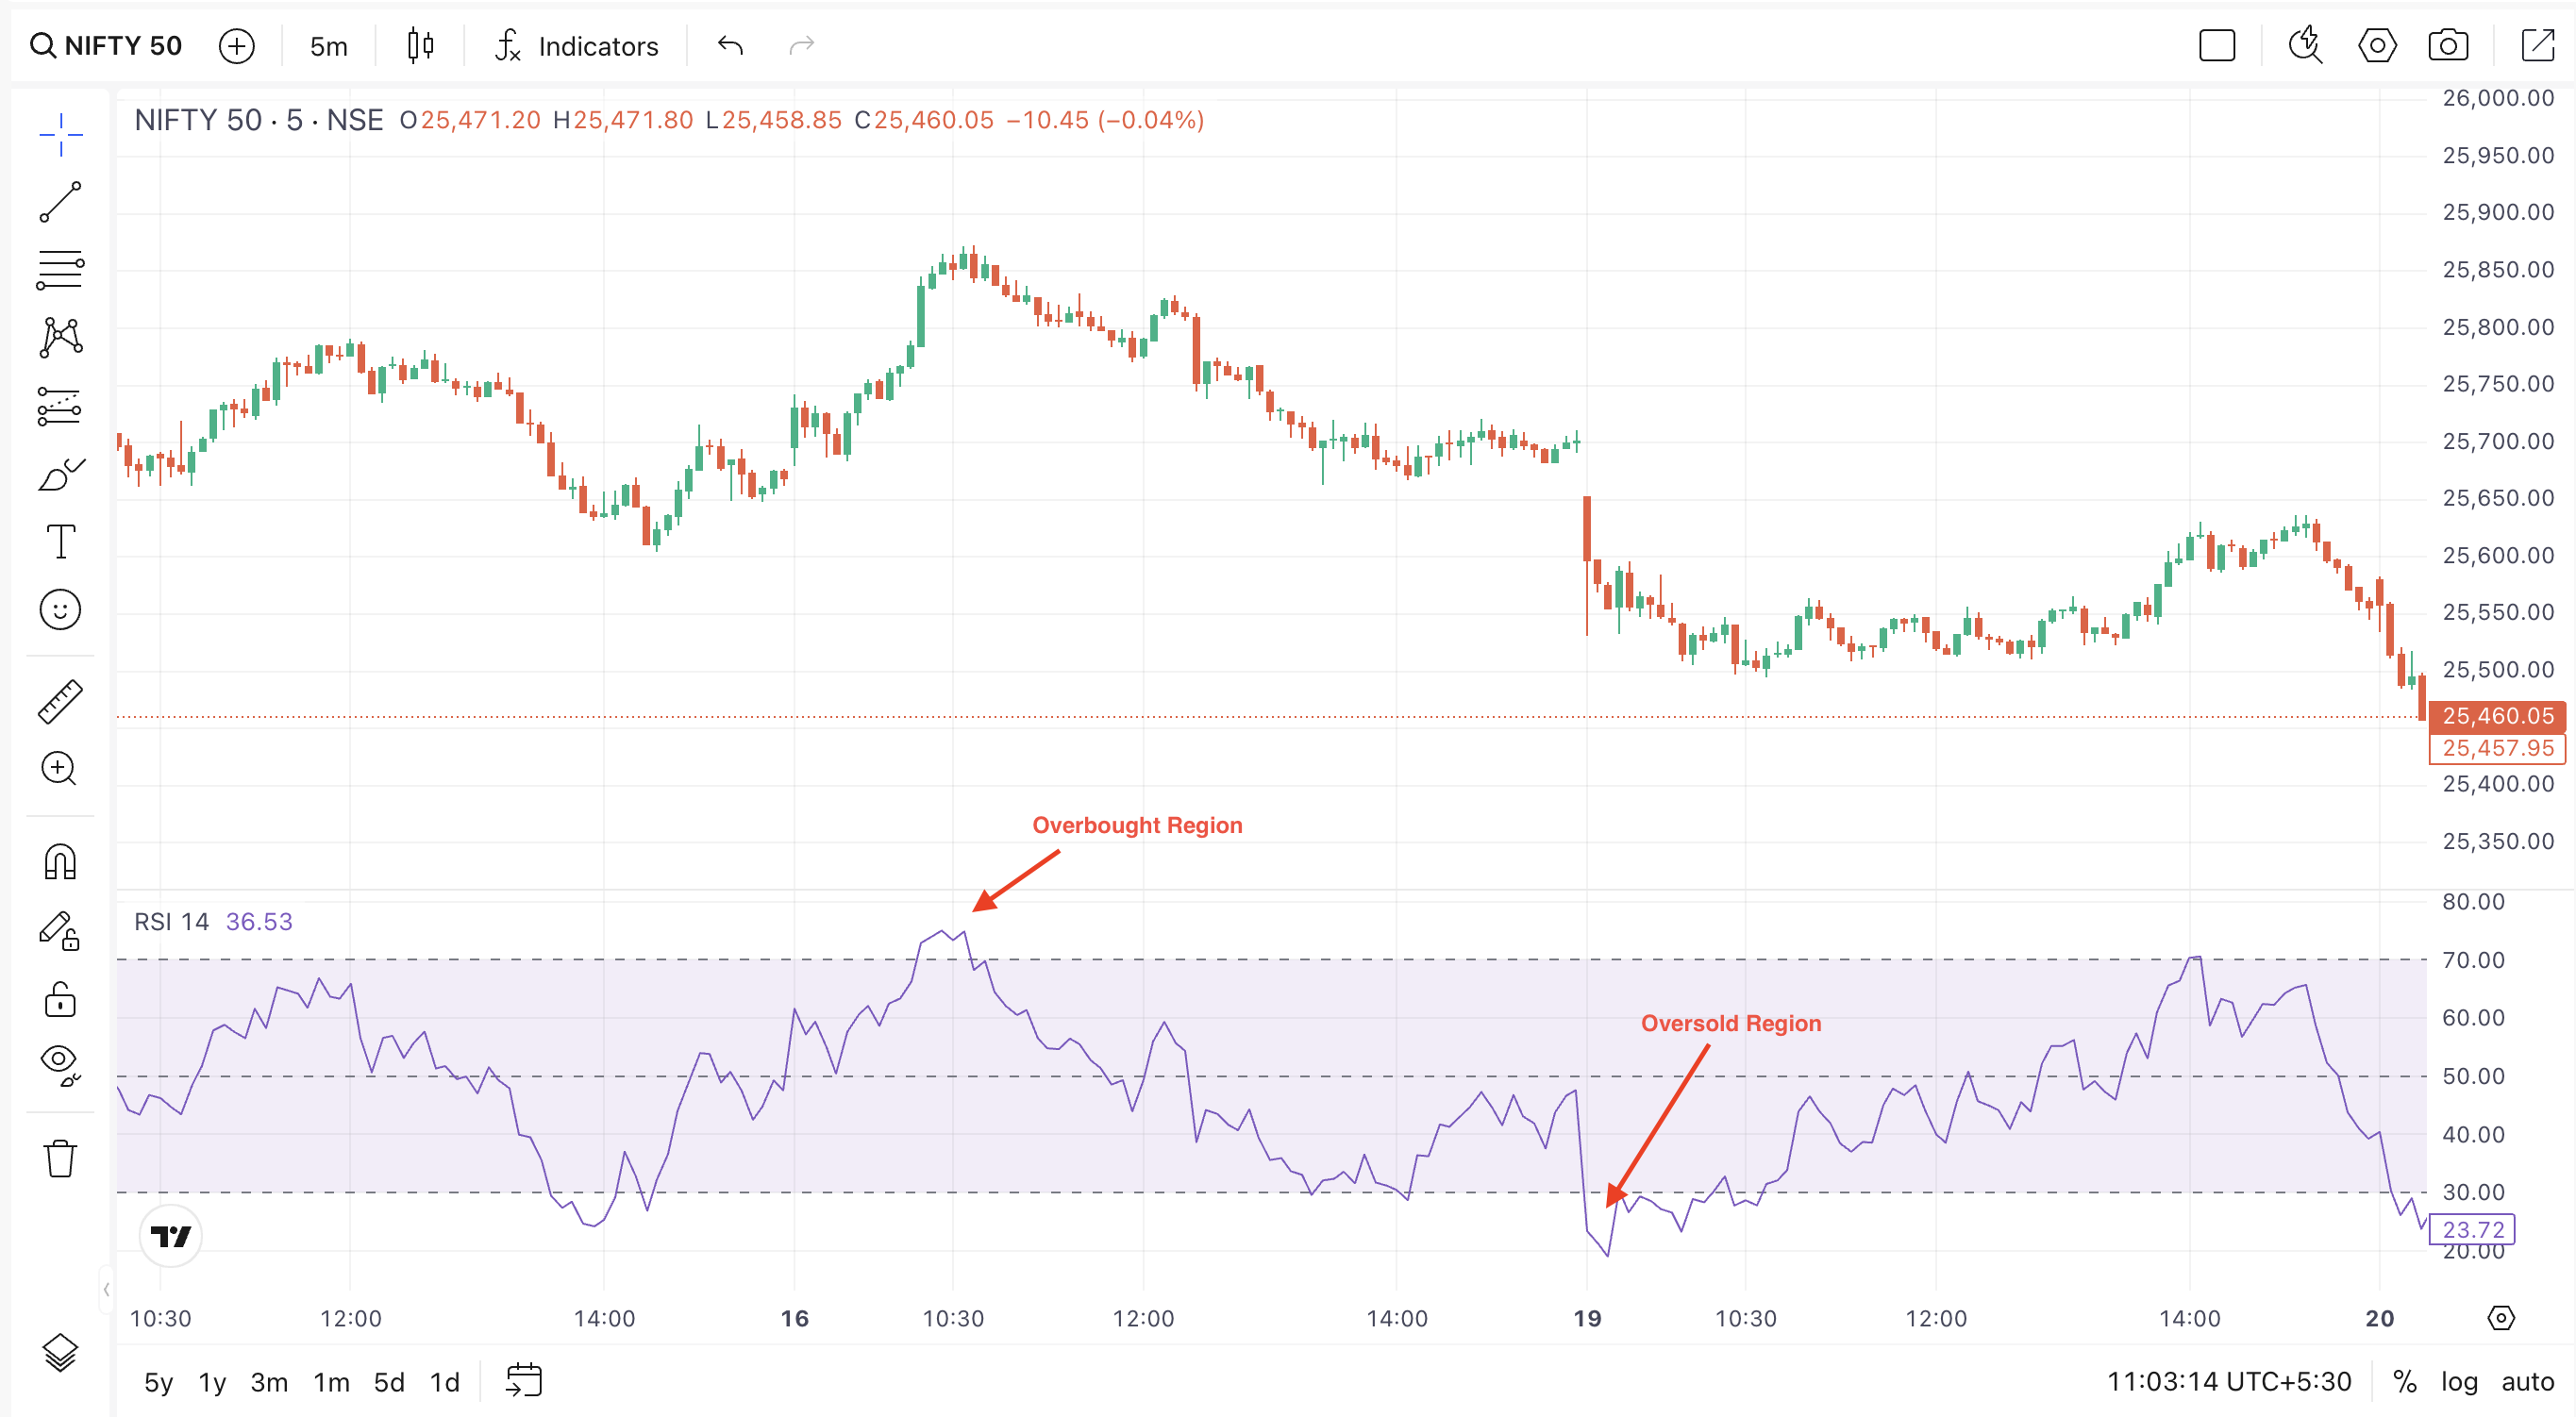
RSI (Relative Strength Index)
The RSI (Relative Strength Index) index measures the momentum and speed of recent price changes. This can help identify assets which are overbought and oversold.
Calculation Method:
The selected period is usually 14 days, while the average gain and loss is calculated by averaging the positive price changes/gains and negative price changes/losses over the total period. Relative strength calculation involves the following formula-
Average Gain/Average Loss
A sample calculation is the following:
RS1 = 100 – (100 / (1 + RS))
Interpretation Rules & Ranges:
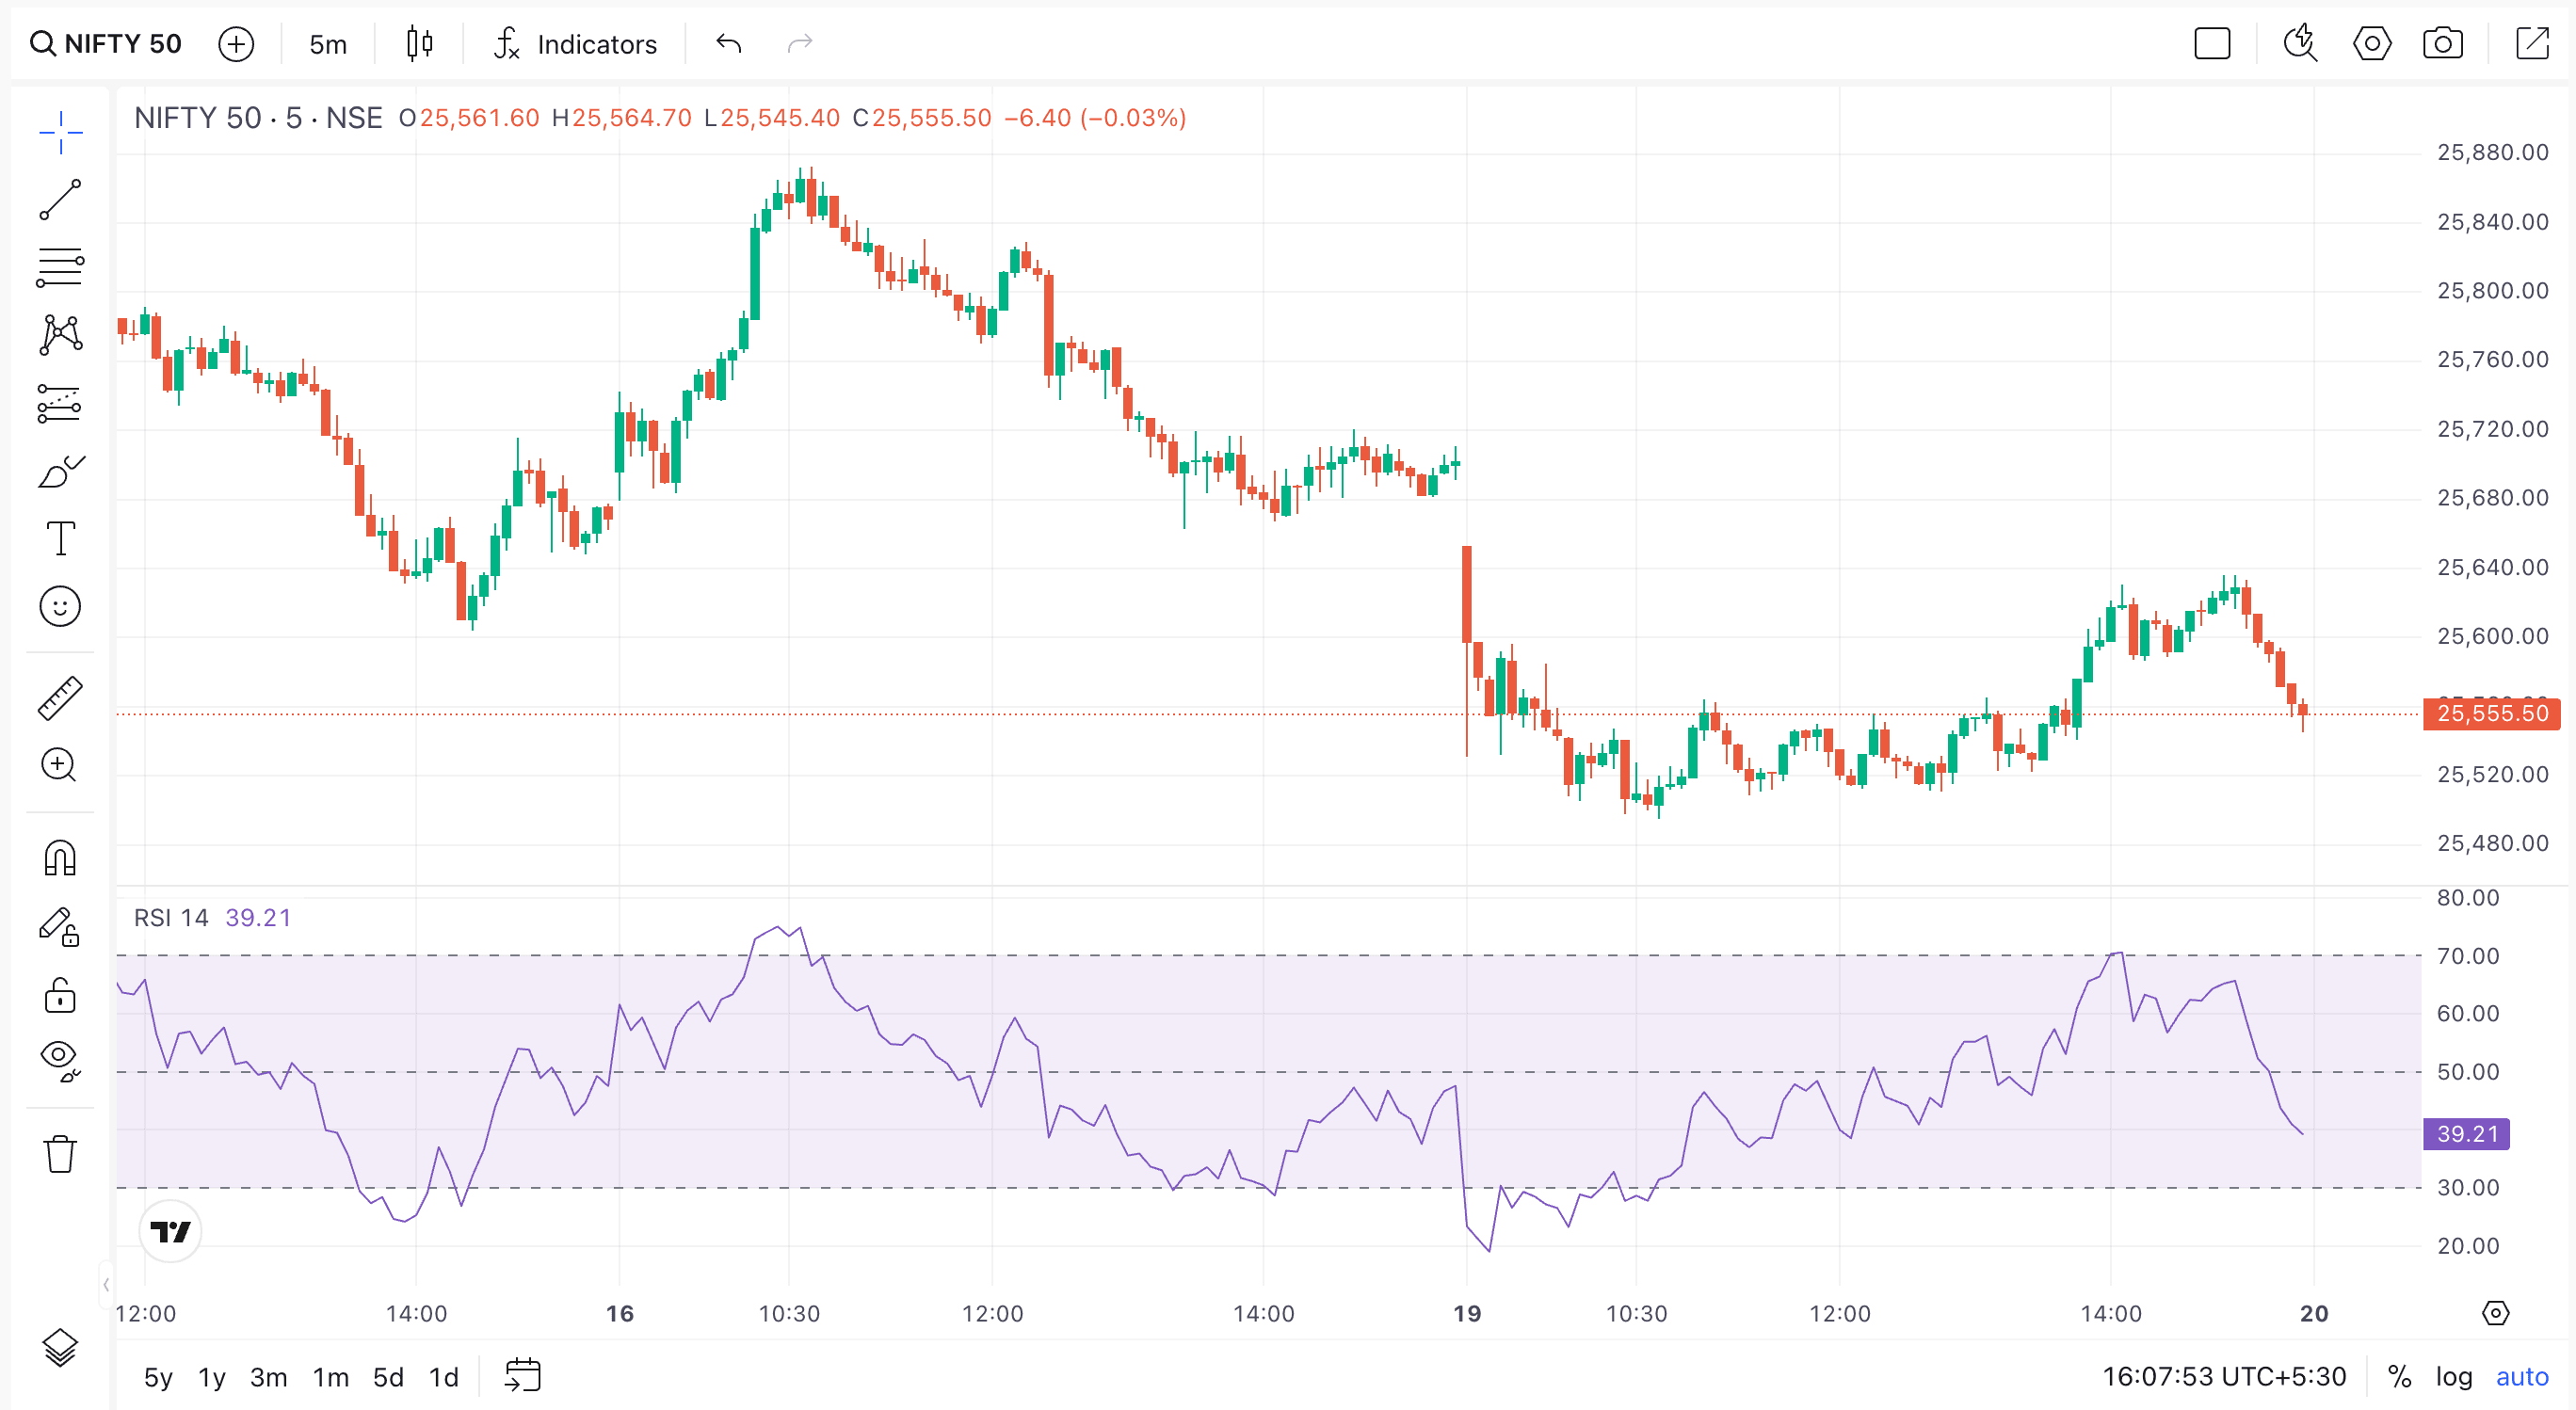
RSI oscillates between 0 and 100. Overbought and oversold are>70 and <30, respectively. The former indicates stronger buying pressure and a price reversal/pullback, while the latter indicates stronger selling pressure and a possible price reversal/rebound.
The Centreline is 50; anything above it shows bullish momentum, while anything below it indicates bearish momentum.
Trading Signals:
Crossovers are when the RSI crosses above 30 (bullish) or below 70 (bearish), while the Centreline Crossover is above 50 (bullish indicator) or below 50 (bearish indicator).
There is, however, Divergence, i.e. Bullish, where the price makes lower lows, but the RSI makes higher lows and Bearish, where the price makes higher highs, and the RSI makes lower highs.
There are sometimes failure swings where the RSI shifts to overbought/oversold, then pulls back and creates a higher low or lower high below/above the extreme zone. Thereafter, it breaks its earlier swing.
Strengths & Weaknesses:
Strengths:
- Helps identify changes in momentum and potential reversals
- Works as a trend confirmation mechanism
Weaknesses:
- May give false signals at times in strong trends (stays oversold or overbought longer)
- Needs confirmation from other tools, like moving averages and support/resistance levels
MACD (Moving Average Convergence Divergence)
The MACD shows the direction of the trend, momentum, and trend strength by comparing the short- and long-term exponential moving averages.
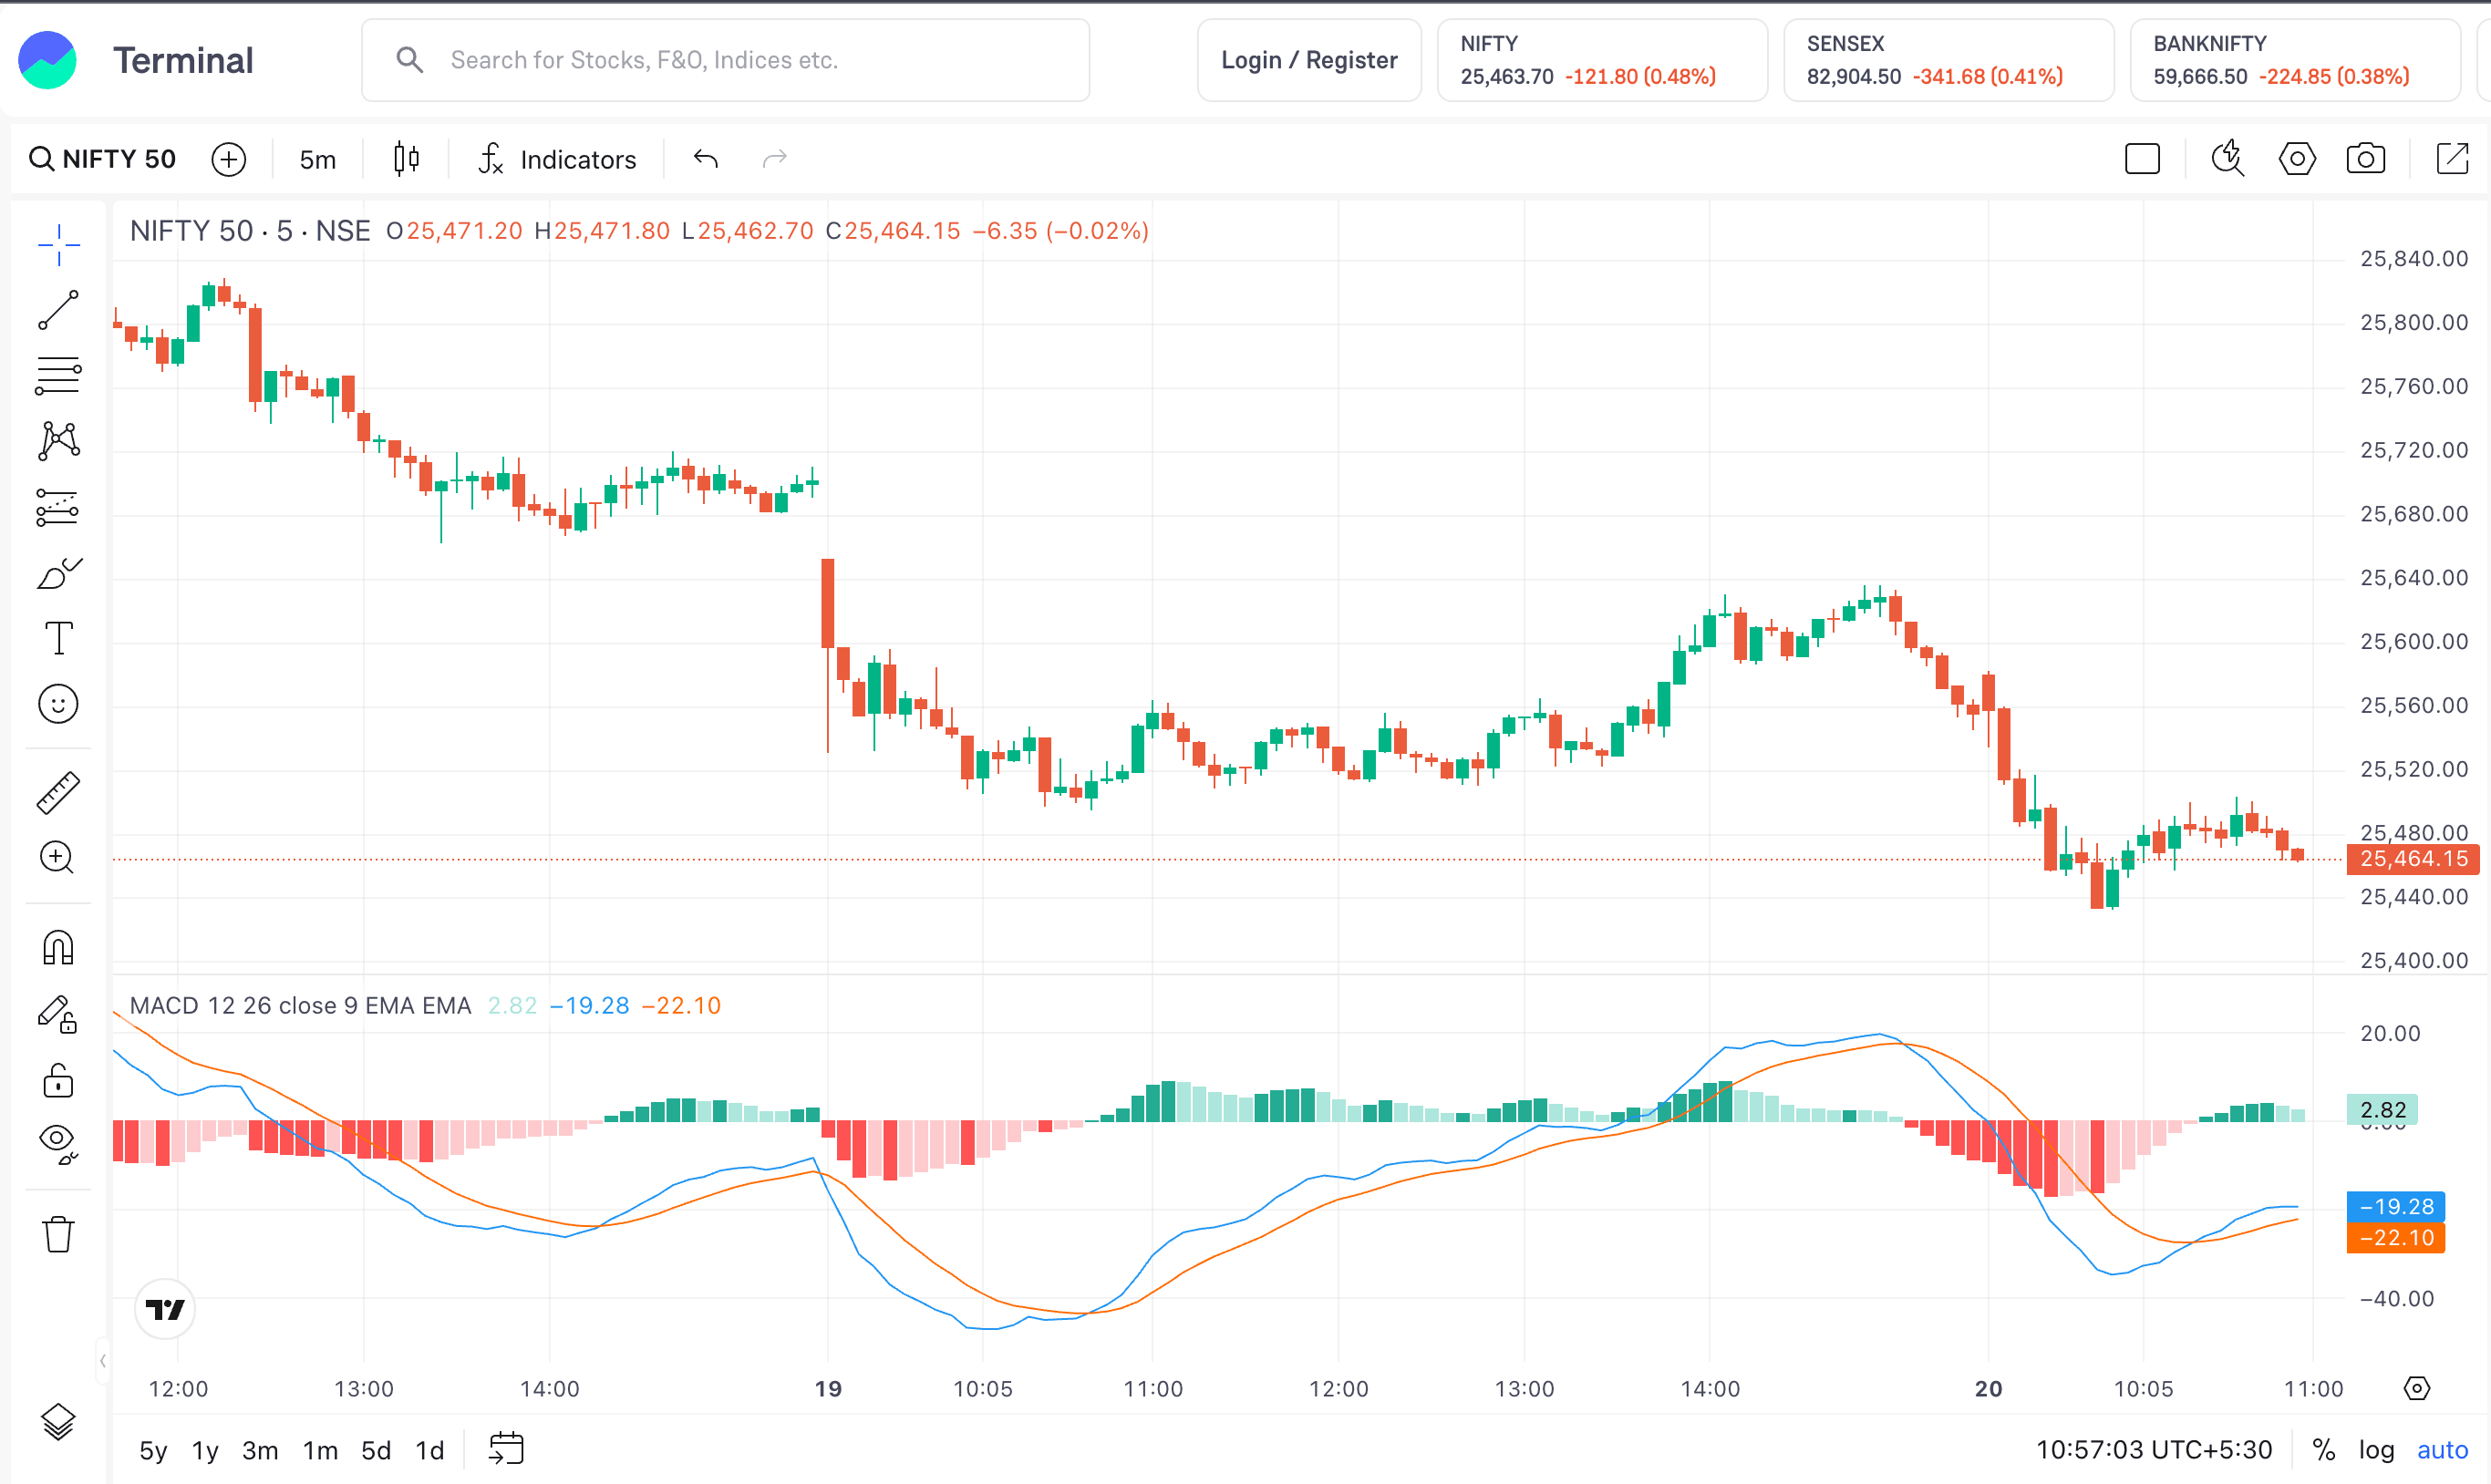
Calculation:
The key components are the MACD Line (12-period EMA-26-period EMA) along with the signal line, which is the 9-period EMA of the MACD line.
Another aspect is the Histogram, which shows the distance between the MACD Line and the Signal Line.
Interpretation & Trading Signals:
If the trend direction is above zero, it is bullish momentum; if it is below zero, it is bearish momentum. If it crosses above or below zero, it indicates shifts in trend. =
In the case of Crossovers, the MACD line crossing above the signal line (buy signal) or below the signal line (sell signal) is the key aspect.
Divergence is also visible: the price makes a new high or low, while the MACD does not, indicating a loss of momentum and a possible reversal.
The Zero Line effect is also there, where stronger signals happen further from zero, while signals nearer to zero in choppier markets may be false.
Strengths & Weaknesses:
Strengths:
- Indicates the trend direction and overall momentum
- Can be adapted to various timeframes and is easier to use
Weaknesses:
- Lagging indicator since it is based on past prices and may offer false signals in choppier markets
- You will need additional confirmation from RSI and other tools for better decision-making.
Bollinger Bands
Bollinger Bands determine the volatility in the market by plotting standard deviation bands around a moving average. This helps in determining potential overbought or oversold conditions.
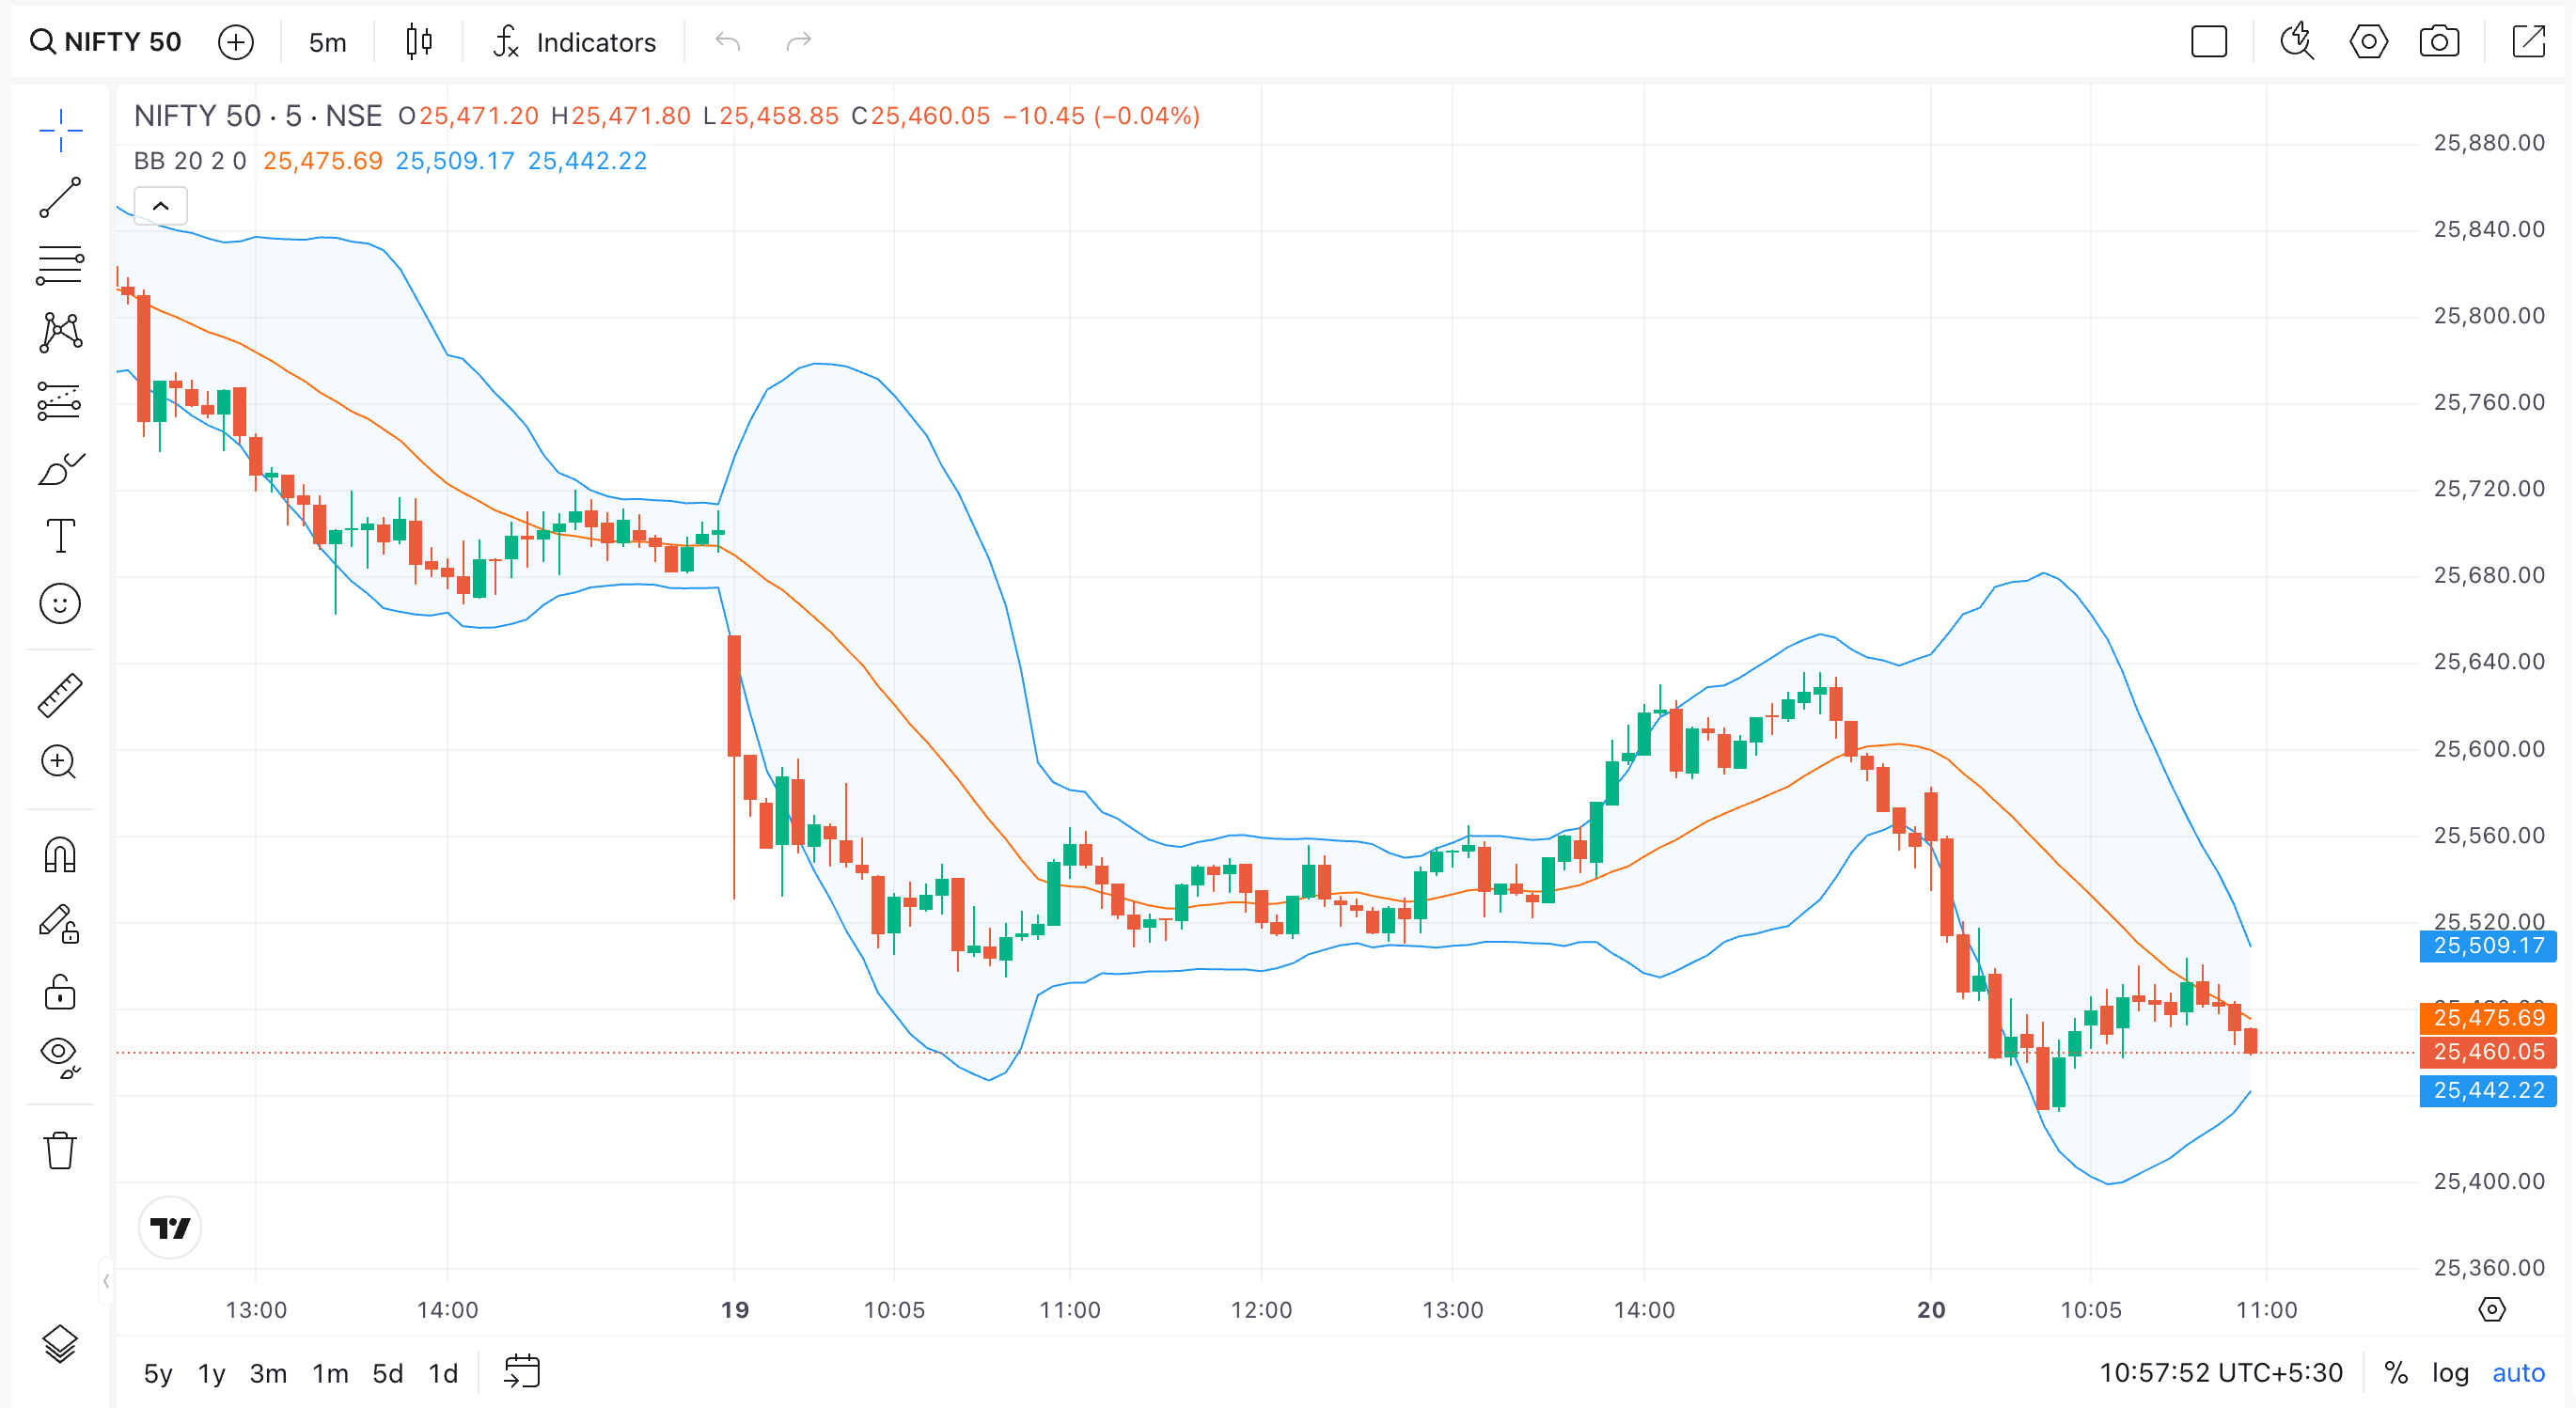
Calculation:
Three lines are used for the calculation of Bollinger bands:
- Middle Band: A simple moving average (usually a 20-period Simple Moving Average of the asset price)
- Lower Band: The middle band is deducted from the same number of standard deviations
- Upper Band: It is the middle band plus the specific number of standard deviations (mainly two) of the price in the same period
Interpretation Rules:
The primary rule is based on the concept that prices usually return to the middle of the bands.
Narrowing bands (squeeze/contraction) indicate a period of lower volatility, often preceding a major price movement in either way.
Widening (expansion) bands indicate higher volatility and confirm the strong trend’s direction.
Prices usually stay within these bands, and movement outside the same may be significant without indicating a reversal. Instead, they may signal the beginning of a robust trend.
Overbought/Oversold Ranges:
When the price touches/moves above the upper band, it indicates an overbought condition, while an oversold condition is indicated when the price touches/moves below the lower band.
Divergence occurs when an indicator fails to confirm price movement. So, there could be a Bullish Divergence (the price makes a lower low, while the accompanying indicator makes a higher low) or a Bearish Divergence (price makes a higher high, although the accompanying indicator makes a lower high).
Trading Signals:
There could be crossovers, where any move back inside the bands after touching the lower/upper band is used as a signal.
Breakouts happen when closing outside the bands, indicating the start of a new trend, particularly after a squeeze. There are also reversal zones, where prices shift from one band to another, often indicating a potential short-term trend change.
Strengths & Weaknesses:
Strengths:
- Can be adapted easily, with the standard deviation usage helping bands adjust automatically to changing volatility in the market
- Offers an extensive representation of volatility, range, and possible extreme prices
- May be used for multiple timeframes and with varying assets
Weaknesses:
- It is a lagging indicator with calculations based on historical data.
- Touching any band will not guarantee a trend reversal, while false signals may be generated amidst strong trends.
There are other indicator types, such as the Golden Crossover Strategy, which uses moving averages (both short- and long-run) to predict market trends.
Limitations of Indicators
Here are the limitations of indicators that you should also note carefully.
- Indicators are helpful at specific points. However, there are times when market dynamics change and produce results different from those shown by indicators.
- If prices move sideways, there is a high chance that indicators may give false signals. Similarly, too many indicators can give mixed signals and confuse the traders.
- Thus, traders should use it as a mere tool to inform their decisions, while also considering other factors such as market dynamics, sudden changes in the external market, and other relevant factors before making any final trading decisions.
Best Practices in Using Indicators
Here are the best practices for using technical indicators.
- To employ indicators effectively, traders need to know how each one operates. One can begin with one or two fundamental indicators. Traders should use a combination of indicators, such as one trend indicator and one momentum indicator, to improve signal quality.
- It is not advisable to overload a chart with too many indicators, as this can be confusing. Moreover, traders should try their strategy on historical data before trading with real money.
- Observe how indicators behave across different market types. Also, always trade with stop-loss and risk management.
- It is important to remember that indicators are tools, not guarantees. They assist in guiding decisions, but effective trading also requires patience, planning, and emotional self-control.
Choosing the Right Indicator for Your Trading Style
Here’s how to choose the right indicator for your trading style:
- Define your trading objectives and preferred style, whether it is swing trading (holding positions for several days or weeks, meaning you require indicators for finding medium-term trends), scalping/day trading (quick and short-term movements that require responsive and real-time indicators), or position trading (holding for weeks, months, or even years, needing broader market themes and trends).
- Understand market conditions, since indicators behave differently depending on whether the market is trending, sideways, or ranging.
- Choose complementary indicators across multiple categories to get a comprehensive picture and confirm trading signals. Do not use multiple indicators measuring the same thing.
- Always test your indicators and their settings using historical data and your demo accounts on online platforms before putting capital at risk.
By trading style, here are the indicators that may be suitable:
- Day Trading/Scalping: Relative Strength Index (RSI), Bollinger Bands, Stochastic Oscillator, Average True Range (ATR), and Exponential Moving Averages (EMA)
- Swing Trading: Moving Averages (MA), RSI, Moving Average Convergence Divergence (MACD), Average Directional Index (ADX)
- Range Trading: RSI, Stochastic Oscillator, Bollinger Bands
- Position Trading: On-Balance Volume (OBV), Simple Moving Averages (SMA), Fibonacci Retracement
Market Conditions Affecting Indicator Performance
Some of the market conditions that impact indicator performance include the following:
- Indicators for trending markets, including EMA or SMA and also the ASI (Accumulative Swing Index), usually perform better in trending markets (downtrends/uptrends)
- Indicators effectively confirm the trend's strength and direction, helping identify optimal entry and exit points. Now, while helpful, they often lag markets, as they rely more on historical data, potentially leading to signal delays.
- In sideways or range-bound markets, there is no clear direction, and prices fluctuate within a particular range. This is where trend-following indicators are often less effective and may generate false signals.
- RSI, Bollinger Bands, and MACD usually help identify oversold or overbought conditions, thereby indicating potential reversals within the range.
- Indicators may also slip in volatile markets or crisis periods, losing their reliability and generating more ambiguous signals. Crossovers may multiply without any clear direction.