Bearish Engulfing Pattern
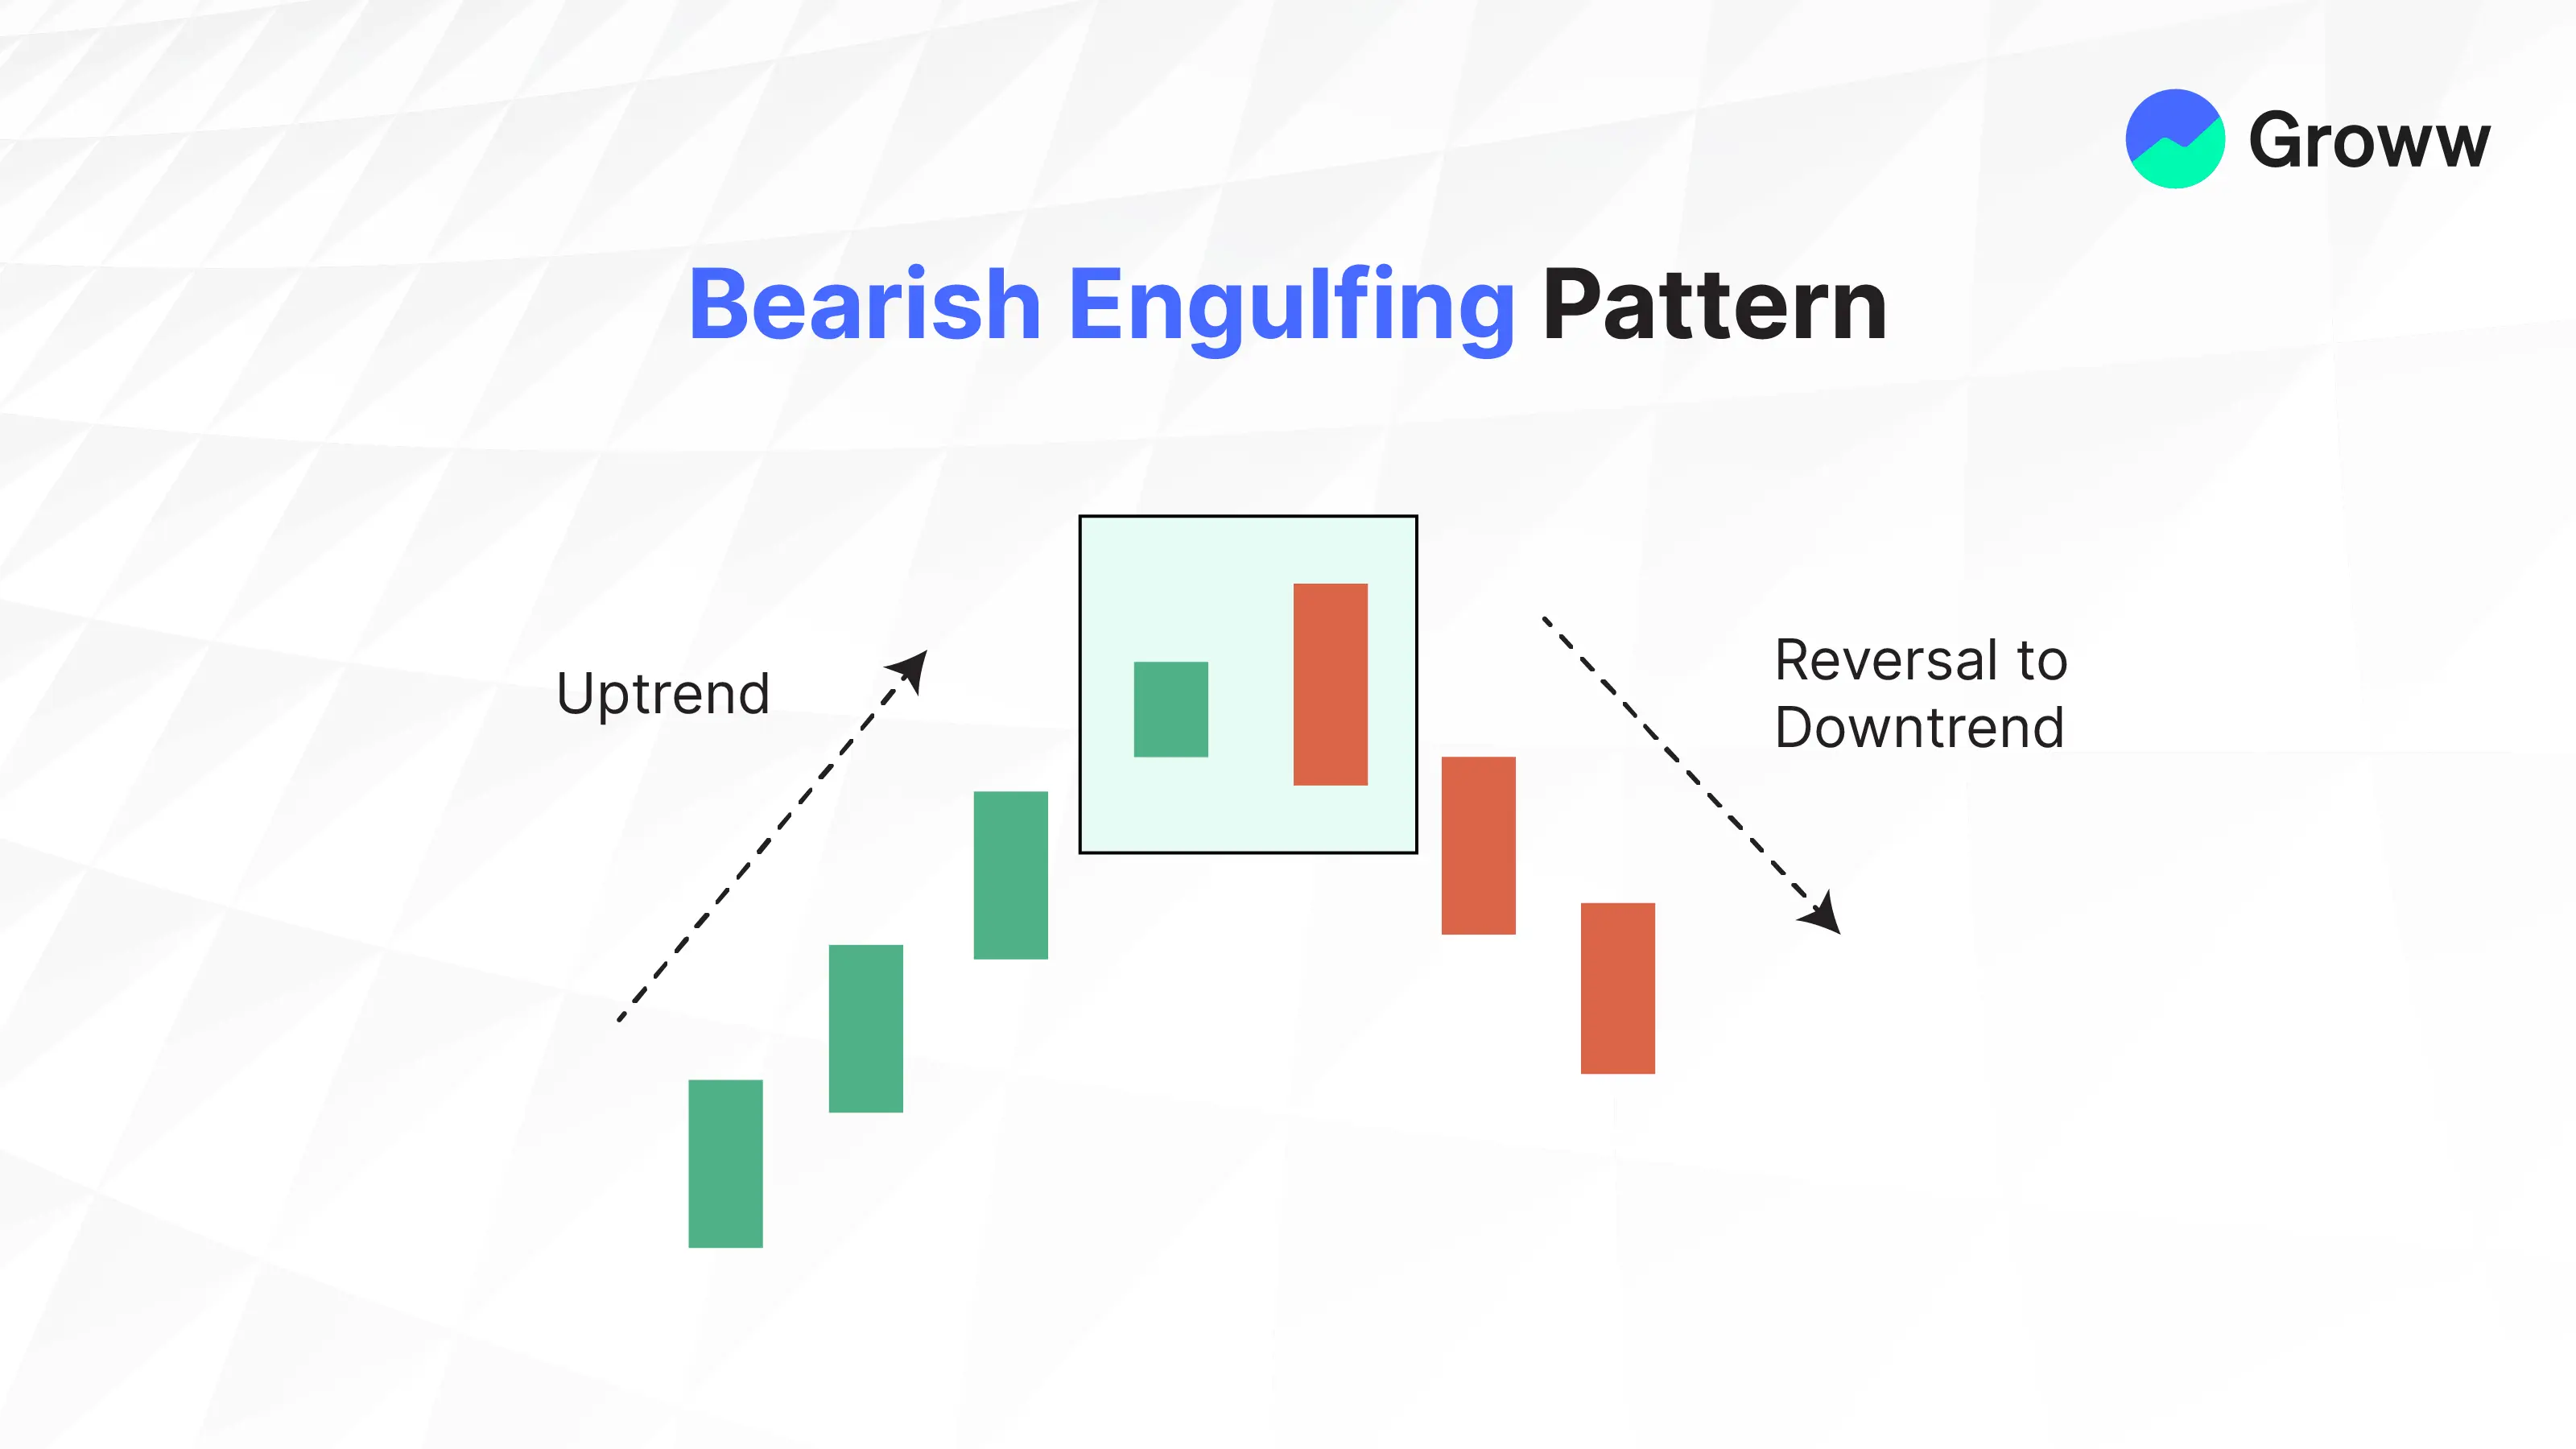
A bearish engulfing pattern, which is a technical chart pattern that indicates that lower prices are on the way. The pattern consists of an up candlestick (white or green) followed by a big down candlestick (black or red) that eclipses or "engulfs" the smaller up candle.
The pattern is significant because it indicates that sellers have surpassed purchasers and are pushing the price down more aggressively (down candle) than buyers were able to drive it up (up candle).
What is Bearish Engulfing Candlestick Pattern?
Such a pattern forms at the end of an uptrend and indicates a trend reversal. It means that the sellers will outnumber the buyers and drive down the price.
This pattern is formed by two candles. It occurs when a green or up candle is followed by a red or down candle that totally overtakes or engulfs the up candle.
The bullish engulfing pattern indicates a significant shift in attitude. As a result, the gap up on the market's opening is filled up during the development of the bullish engulfing pattern, and the down candle formed engulfs the preceding up candle.
When the beginning price of a day is higher than the closing sum of the previous day, a gap-up occurs. It is a bullish sign, but because this pattern is a trend reversal, the gap quickly fills up.
Check Here to know How to Read Candlestick Charts.
Importance
In trading, engulfing candles is quite essential. When markets change direction, we aim to capitalise on new trends. Reversal patterns, such as the bullish and the bearish engulfing candles, indicate an oncoming change in price direction because the previously dominating force has begun to lose momentum, allowing the opposing force to capitalize.
Both patterns occur at the end of a long trend. The bullish engulfing pattern indicates that the second candle is robust enough to start a new trend. Because the low of the second candle is lower than the low of the first, it indicates that the bulls were able to push the sums action from the session lows to higher sums, which was not seen in the previous session.
Effectiveness
Patterns produced on a candlestick chart are only sometimes as evident in theory as they are in practice. For example, when an opening of an engulfing candle is considerably above the close of the preceding candle, it is more dependable.
It essentially means that there is a significant gap up. Furthermore, the closing of the down candle should be significantly lower than the opening of the up candle. In a tumultuous market, this candlestick pattern is especially unreliable since it produces several engulfing patterns without appropriate clarity.
How to Trade with Bearish Engulfing Patterns
This pattern, or candle, is a potential sell signal, and traders typically take short bets once it forms. In practice, though, a trader can adopt a variety of techniques.
For clarity, consider a daily candlestick chart, where each candle represents a day's price change.
- If the volume rises greatly during the creation of the engulfing candle, it may indicate a stronger downward trend. At the end of a day, the period that the engulfing candle is formed, aggressive traders sell.
- In addition to this pattern’s trend, most traders seek signs such as the price breaking below the upward support line. When paired with other signs, this pattern gains credibility.
- Some traders wait a day following the formation of this pattern to confirm the trend. When it is weak, this becomes important.
Limitations
Following a sharp price increase, engulfing patterns are especially useful because they indicate when momentum is shifting downward. Even though the price is generally rising, the engulfing pattern's impact is diminished because it is a fairly common signal.
The enclosing candle or second candle could also be massive. If they choose to trade the pattern, the trader may be left with an extraordinarily large stop loss. The possible profit from the trade may not justify the risk.
Check More Bearish Chart Patterns
|
Bearish Pattern |
Features |
|
It is formed when three consecutive long-red candles with small wicks are visible |
|
|
It appears at the top of the uptrend as a single candle with a small body and a long lower shadow |
|
|
It is a three-candlestick pattern that - Starts with a long bullish candle - Followed by a small-bodied candle that gaps up - And ends with a long bearish candle that closes well into the body of the first candle |
|
|
It is a reversal strategy which: - Is a single candlestick pattern with a small body, a long upper shadow, and little to no lower shadow |
|
|
It is a two-candlestick pattern that: - Starts with a long bullish candle followed by a Doji (a candle with a very small body) |
|
|
It is a two-candlestick pattern where: - A small bearish candle is completely engulfed within the body of the previous large bullish candle |
|
|
- It consists of two or more candles with matching highs and appears at the top of an uptrend. - The first candle is usually bullish - And the second candle is bearish |
|
|
- It starts with a long bullish candle - Followed by a long bearish candle that opens below the previous candle’s opening price and closes lower |
|
|
It is a three-candlestick pattern that: - Starts with a bullish candle - Followed by a smaller bearish candle that is completely within the first candle - And ends with another bearish candle that closes lower |
|
|
It is a three-candlestick pattern that - Starts with a bullish candle - Followed by a bearish candle that engulfs the first candle - And ends with another bearish candle that closes lower |
|
|
it is a five-candlestick pattern that: - Starts with a long bearish candle - Followed by three smaller bullish candles that stay within the range of the first candle - And ends with another long bearish candle that closes below the first candle |
|
|
It forms a long green candle followed by a red candle that opens above the previous high but closes below the midpoint of the green candle. |
|
|
It is a three-candlestick pattern that - Starts with a long bullish candle - Followed by a Doji that gaps up from the previous candle - And ends with a long bearish candle that gaps down from the Doji. |