Piercing Candlestick Pattern
Navigating the stock market can be a tedious task for any trader. To ease this tough journey, traders take recourse to a variety of tools to help them. One such category of tools is called Technical Indicators. Within this category are the candlesticks, including candlestick chart patterns. Candlesticks can help traders identify market conditions. In this blog, we will study the ‘Piercing Pattern’ of candlesticks, which is a bullish reversal trading pattern.
A piercing candlestick pattern can be used as an indicator to enter a long position or exit a sell position. This pattern is formed when a potential short-term reversal – from a downward trend to an upward trend – is on the cards.
Check Here to know How to Read Candlestick Charts.
What is the Piercing Pattern?
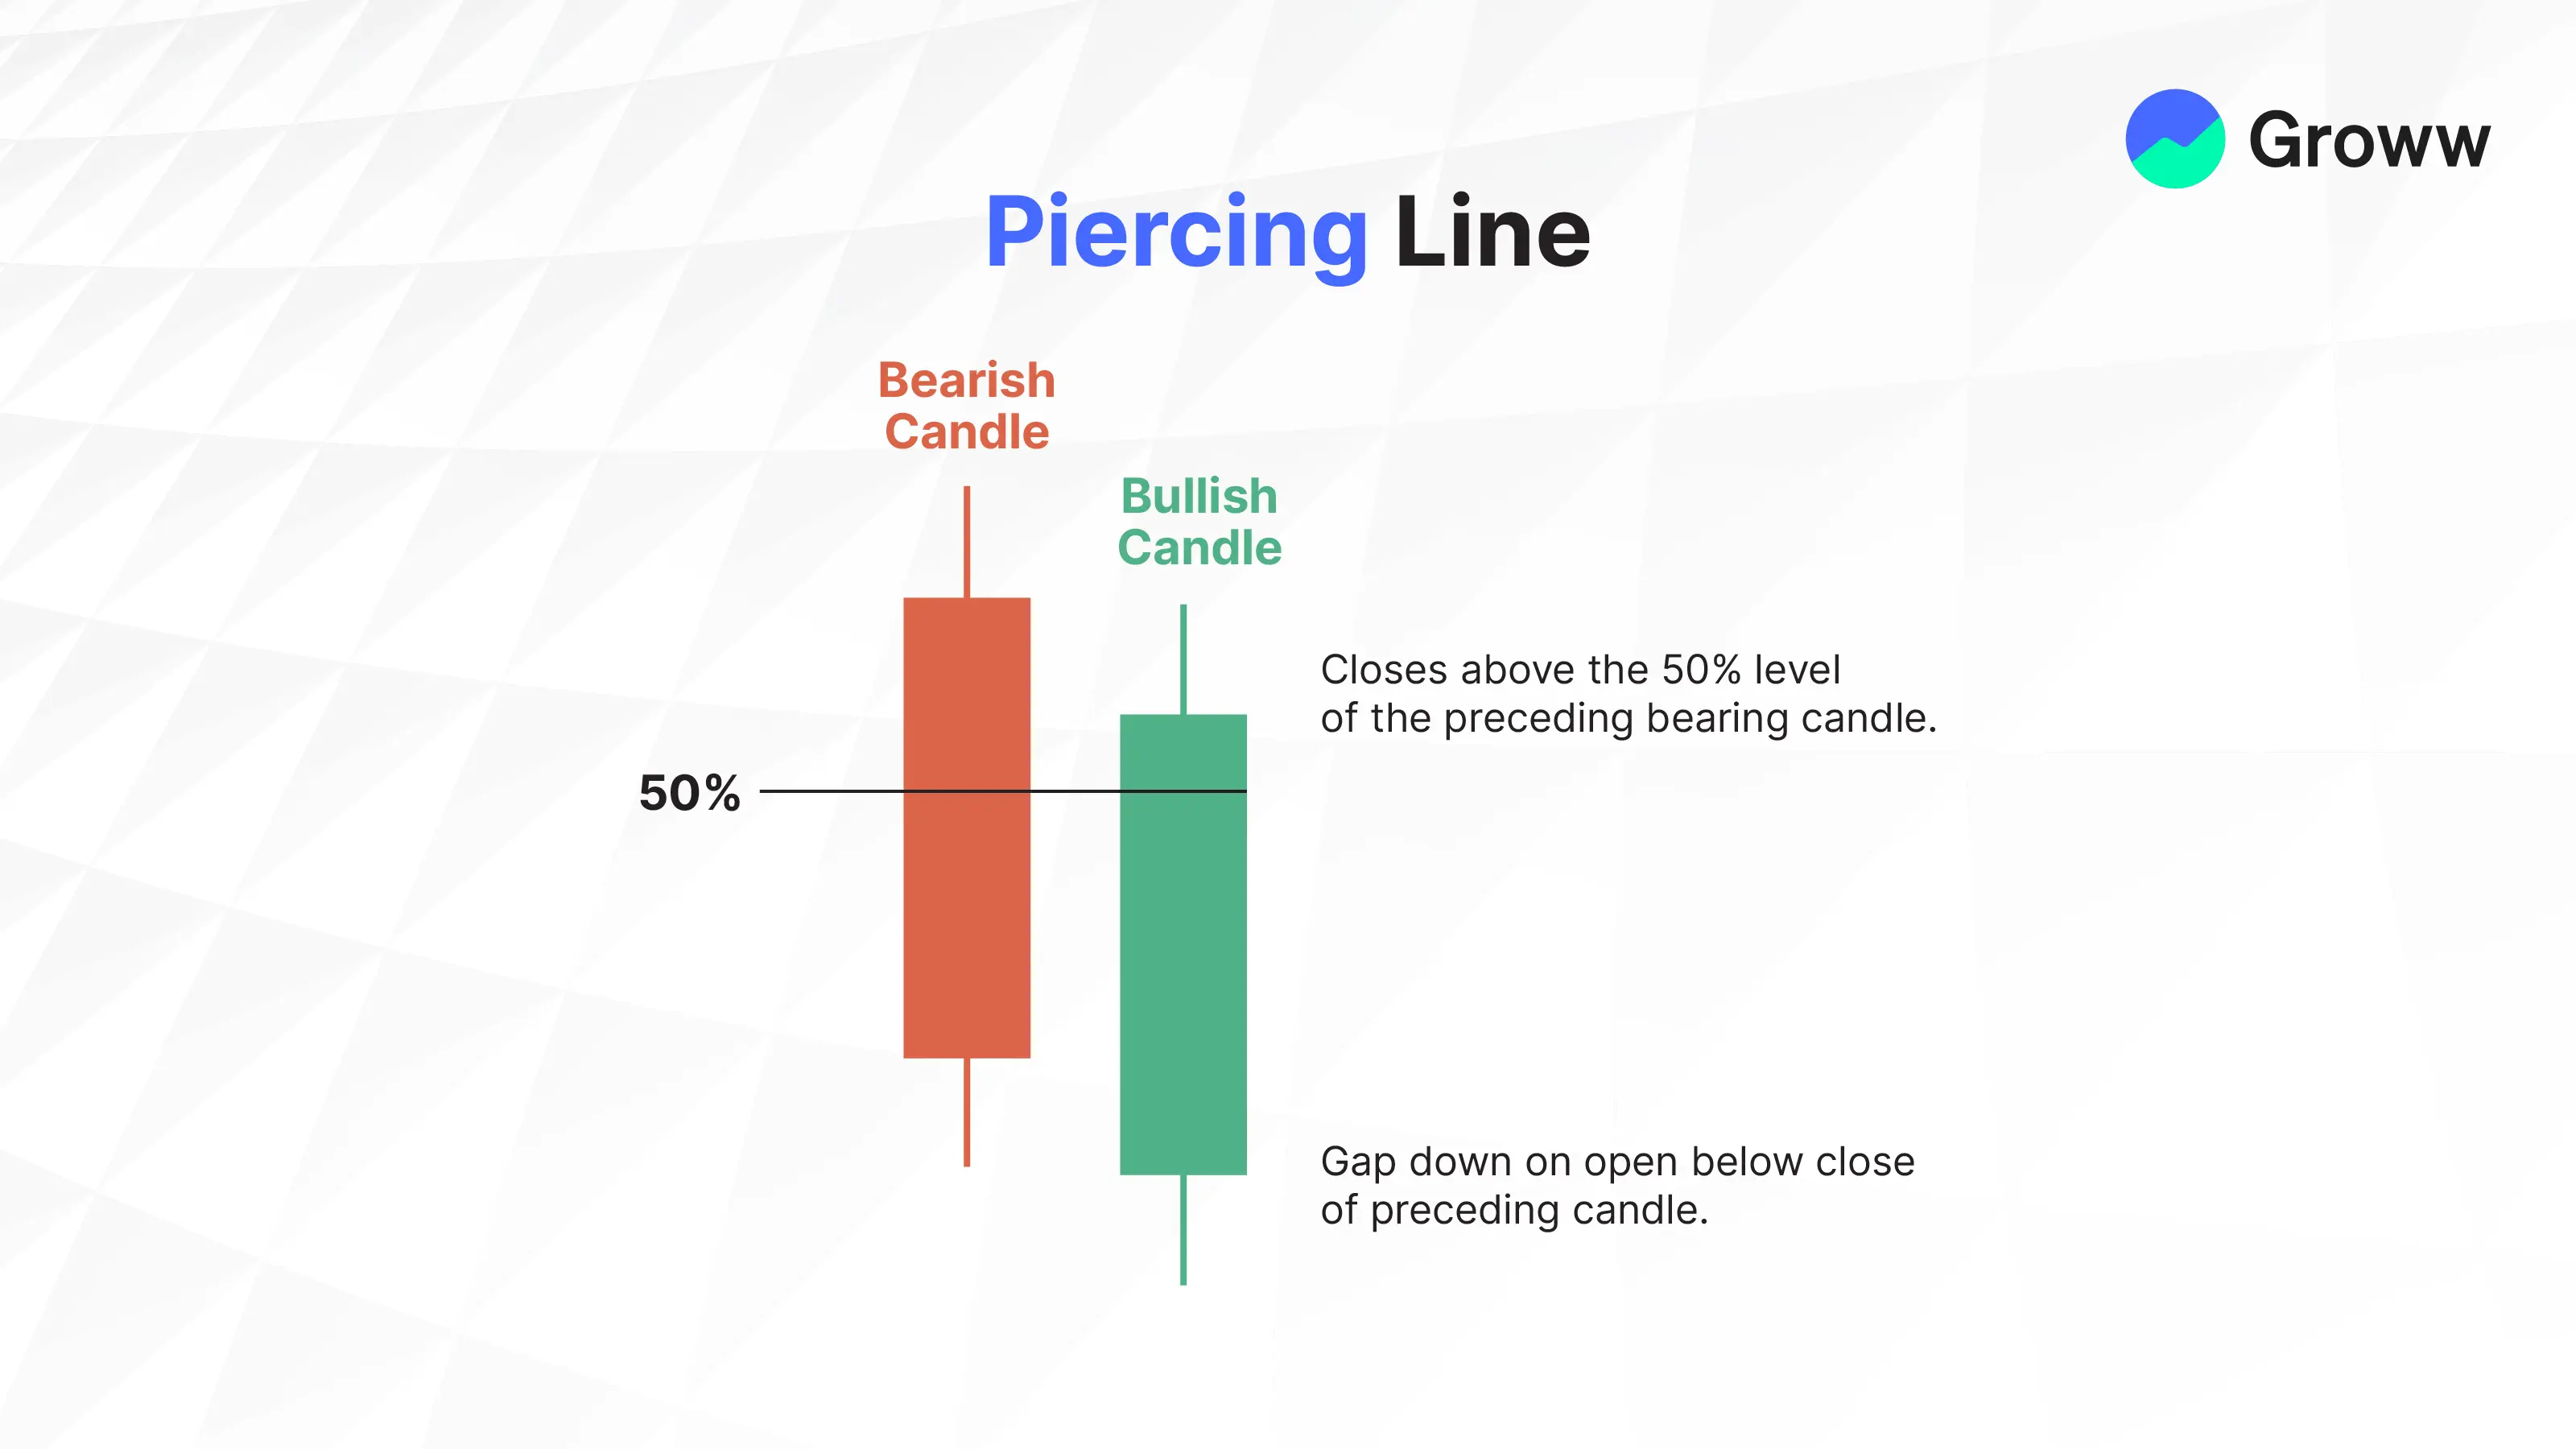
A piercing line candlestick pattern is a two-day pattern that indicates a potential reversal from a downtrend into an uptrend. The pattern usually involves the first-day opening price of the stock near the high and closing near the low with an average or large trading range. There will be a gap at the start of the second day where trading opens near the low of the previous day and then closes near the high.
How Does the Piercing Pattern Work?
A piercing pattern forms when a stock starts at a low price, quickly rebounds to reach an intraday high, and then closes at or above its opening price. The need to create an outside reversal signal is to exploit the divergence between two oscillators. The piercing line candlestick pattern is just one of the several reversal signals that fall into this category.
This pattern offers a confirmation signal of a reversal when the stock price is pierced from below the opening price and the closing price is at a higher level than the opening price.
This pattern is rather uncommon. That is why traders should not rely on this pattern alone. Because of the rarity of the pattern, traders should also use other tools and indicators to arrive at their trading decisions to ensure optimum results.
Formation of Piercing Candlestick Pattern
As mentioned earlier, the timeline for the formation of this pattern is two days. The first candle is influenced by sellers, while the buyers dominate the second candle. The preceding candle shows a downward trend in the asset value. Under this pattern, you can see that the supply of shares meant for sale has reached the upper ceiling.
The second candle in this pattern will start with a small gap. Gaps can only be created if the stock’s opening price is greater or lower on the second day than the previous day's closing price.
The second candle crosses at a value closer to the opening price of the first day. In order to have a clear piercing line, the second candle should cover at least half of the last day's red candlestick.
How to Use Piercing Candlestick Pattern in Trading?
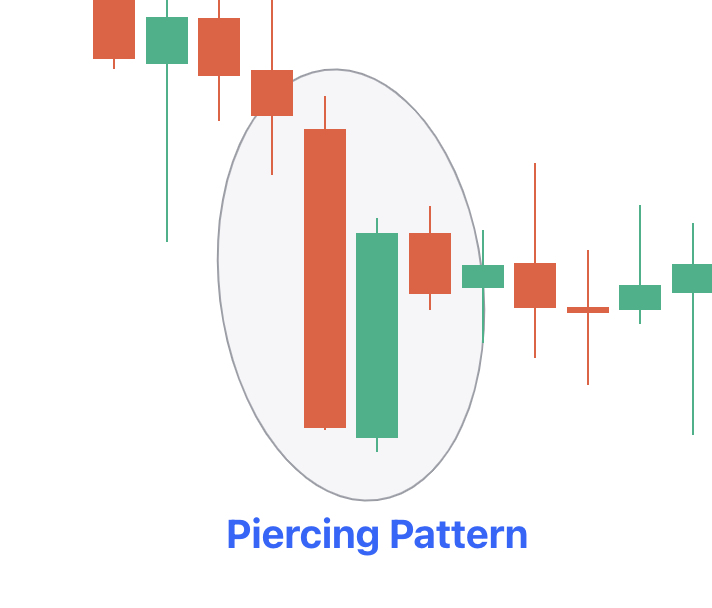
A piercing line pattern signals an overall bullish reversal, but you need to be very cautious if you are using it for the purpose of trading. You can visually see the second candle covering half of the first candle and forming a piercing shape. The first candle will not be covered entirely, and this implies that the bulls could not control the market entirely.
When you see a piercing candlestick pattern, you need to wait until the high of the first candle is achieved by the previous candle. This is a suitable trade setup when trading with the piercing chart pattern.
The piercing pattern can be used by both day traders and longer-term traders, but its effectiveness is often higher over longer time frames. Day traders can also benefit from it, but they should be cautious and combine it with other indicators.
Advantages and Disadvantages of Piercing Pattern Candlestick
The table below lists the merits and demerits of using the piercing line candlestick pattern for trading purposes:
|
Piercing Pattern |
|
|
Advantages |
Disadvantages |
|
This pattern is a strong bullish reversal signal that shows up specifically after a downtrend. It indicates potential buying opportunities. |
Information from subsequent price actions or indicators needs to be added to reduce false signals. |
|
It is an easy-to-identify pattern, helping traders assess the market quite quickly. |
It is less common compared to other candlestick patterns, which gives it limited utility. |
|
It can provide a clear entry point to enter long positions at the start of an uptrend. |
The pattern will produce false signals in a ranging market, which could lead to potential losses. |
|
By setting a stop-loss below the pattern, you can manage risks. |
The pattern does not offer a price target, and its effectiveness diminishes without complementary analysis. |
|
The pattern shows a shift in market sentiment from bearish to bullish, helping traders gauge market psychology. |
The success of the Piercing Pattern depends on market conditions and several other factors. |
Check More Bullish Candlestick Patterns
|
Bullish Pattern |
Features |
|
A reversal pattern which consists of: - A small bearish candle followed by a - Larger bullish candle. |
|
|
A reversal pattern which consists of: - A small body candle, and - Long lower shadow/wick |
|
|
A reversal pattern which consists of: - It starts with a long bearish candle - Followed by a small-bodied candle (either bullish or bearish) - And ends with a long bullish candle. |
|
|
- It is is a two-candlestick pattern that signals a possible upward trend reversal. - Small bullish candle is completely contained within the body of the previous large bearish candle. |
|
|
- It consists of three long bullish candles with small wicks that appear consecutively one after another. - Each new candle opens inside the previous one’s body and closes higher than the last. |
|
|
A reversal pattern which: - Appears at the bottom of a downtrend - A small body with a long upper shadow and little to no lower shadow. |
|
|
A reversal pattern which consists of: - A single candlestick pattern - A very small body and a long lower shadow that appears at the bottom of a downtrend |
|
|
- It consists of a long bearish candle - Followed by a doji candle that gaps down - And then a long bullish candle that gaps up. |
|
|
A three candlestick pattern with: - A large bearish candle, - A small bullish candle that closes above the 50% level of the first candle and - A third bullish candle that closes above the first candle's open. |
|
|
Starts with a bearish candle - Followed by a bullish candle that engulfs the first candle - Ends with another bullish candle that closes higher. |
|
|
- Starts with a long bearish candle - Followed by an even longer bullish candlestick. The candle opens higher than the previous day's closing price and rises even more. |
|
|
A two-candlestick pattern that includes: - Two equal-sized bullish and bearish candles. |
|
|
It consists of five candles in a continuation pattern - A long bullish candle - Three small bearish candles that trade above the low and below the high of the first candlestick - And another long bullish candle that closes above the high of the first candlestick. |
|
|
It is similar to the rising three methods pattern consisting of five candles - It starts with a long bullish candle - Followed by three small bearish candles (a smaller bearish candles that move lower) that stay within the range of the first candle - And end with another long bullish candle that closes above the high of the first candle. |