Channels in Technical Analysis

Traders in technical analysis often use price channels to see when a move up or down might happen. Channels enable you to identify market trends and select optimal times to open and close your position. Utilising channels can enhance the accuracy of your decisions in all types of trading.
What Are Channels in Technical Analysis?
Channels define a price band that indicates market movements within a trend. This is done by connecting the swing lows and swing highs with two parallel trendlines.
Price channels are part of a trader’s strategy.
- Watch for ongoing trends in the market
- Check for prospective zones where the market may change trends
- Make trade strategy decisions by observing the way prices operate within or beyond the channel
Channel patterns can emerge in any market environment and are typically examined alongside technical indicators.
Types of Channels
There are three major kinds of price channels:
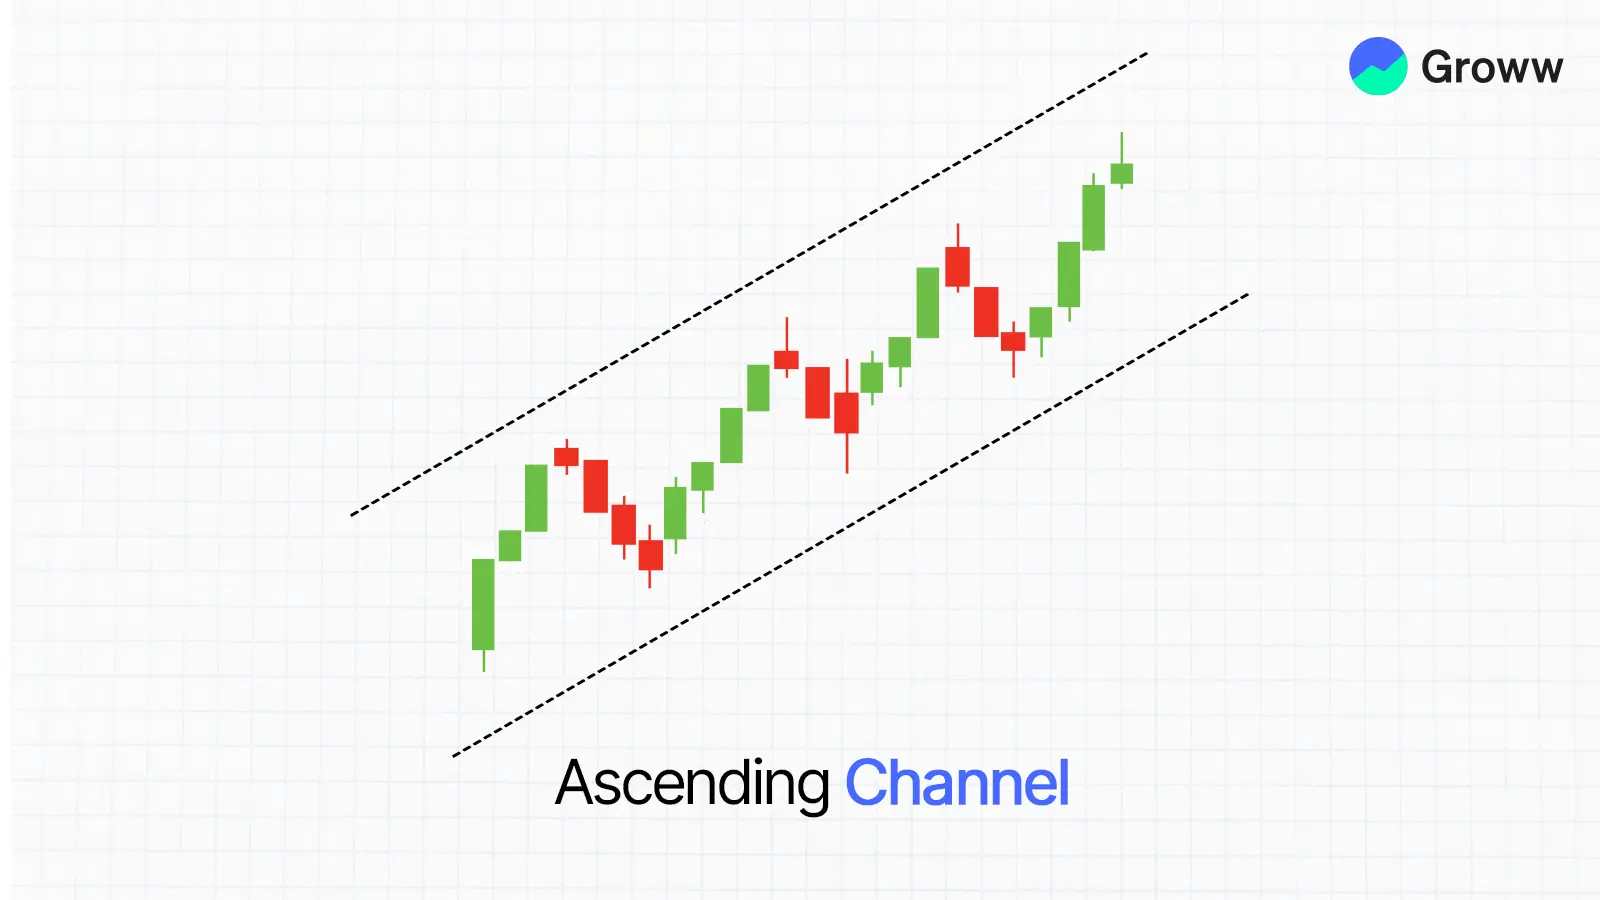
Ascending Channel
- Otherwise called a rising channel, it develops whenever:
- Higher highs and higher lows are formed when the price surges.
- They both move in an upward direction.
This dip in equities shows the market's strength. People involved in trading tend to purchase assets when support is identified and aim to sell when resistance is reached.
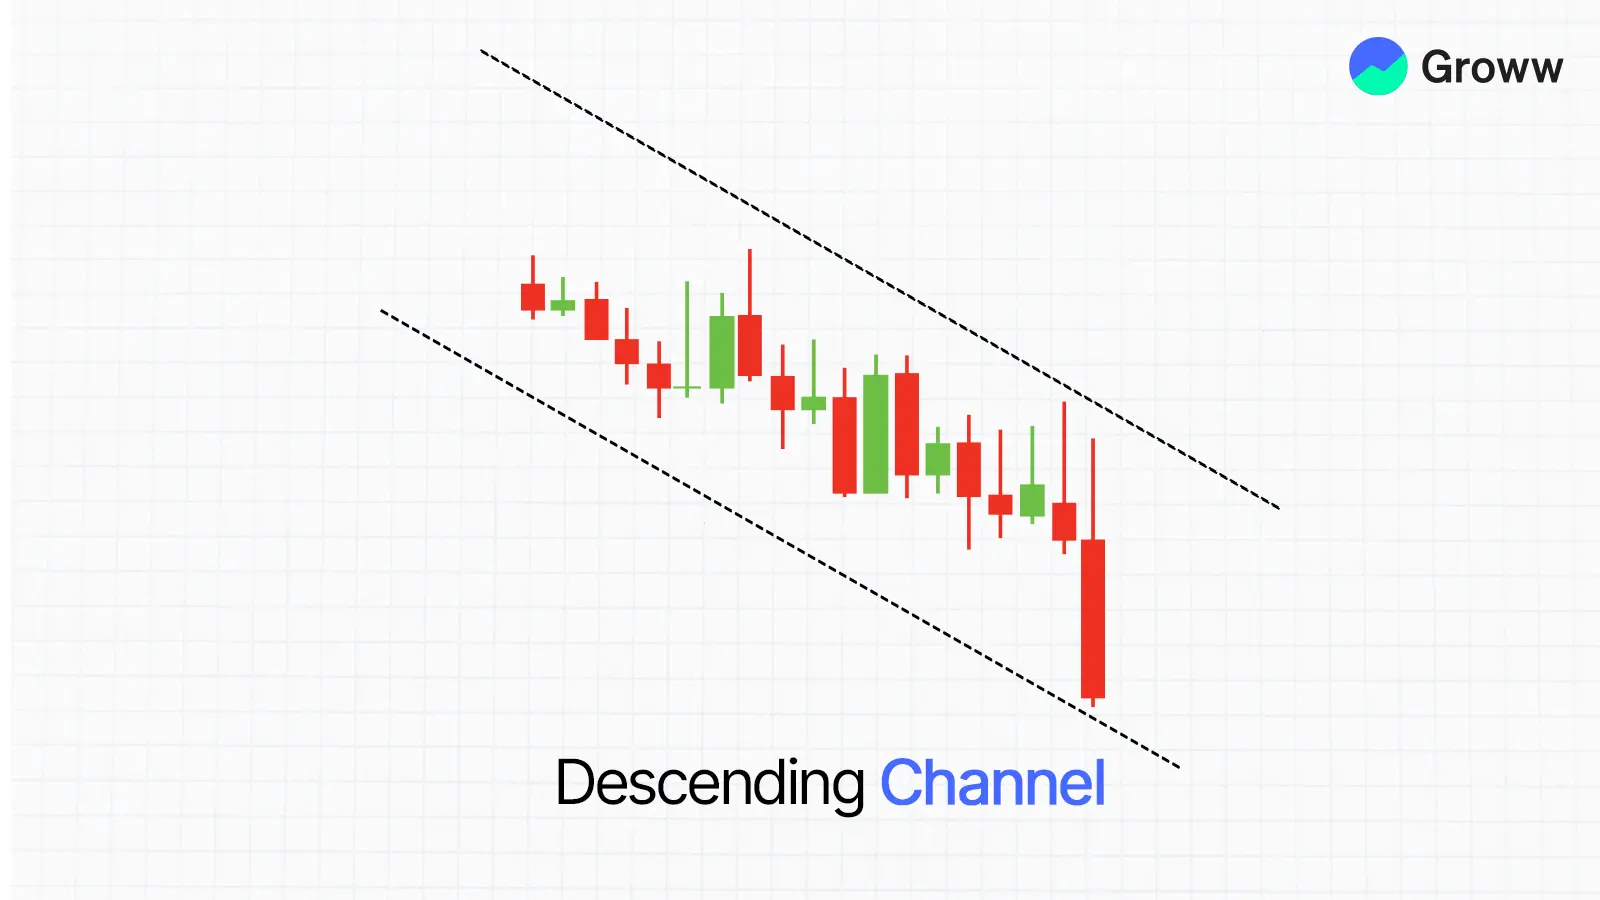
Descending Channel
A downward-sloping channel takes shape when:
- The price of the cryptocurrency fluctuates at both highs and lows.
- They both point in the downward direction.
This indicates a bearish trend. Traders can short at resistance levels and close their positions at support levels.
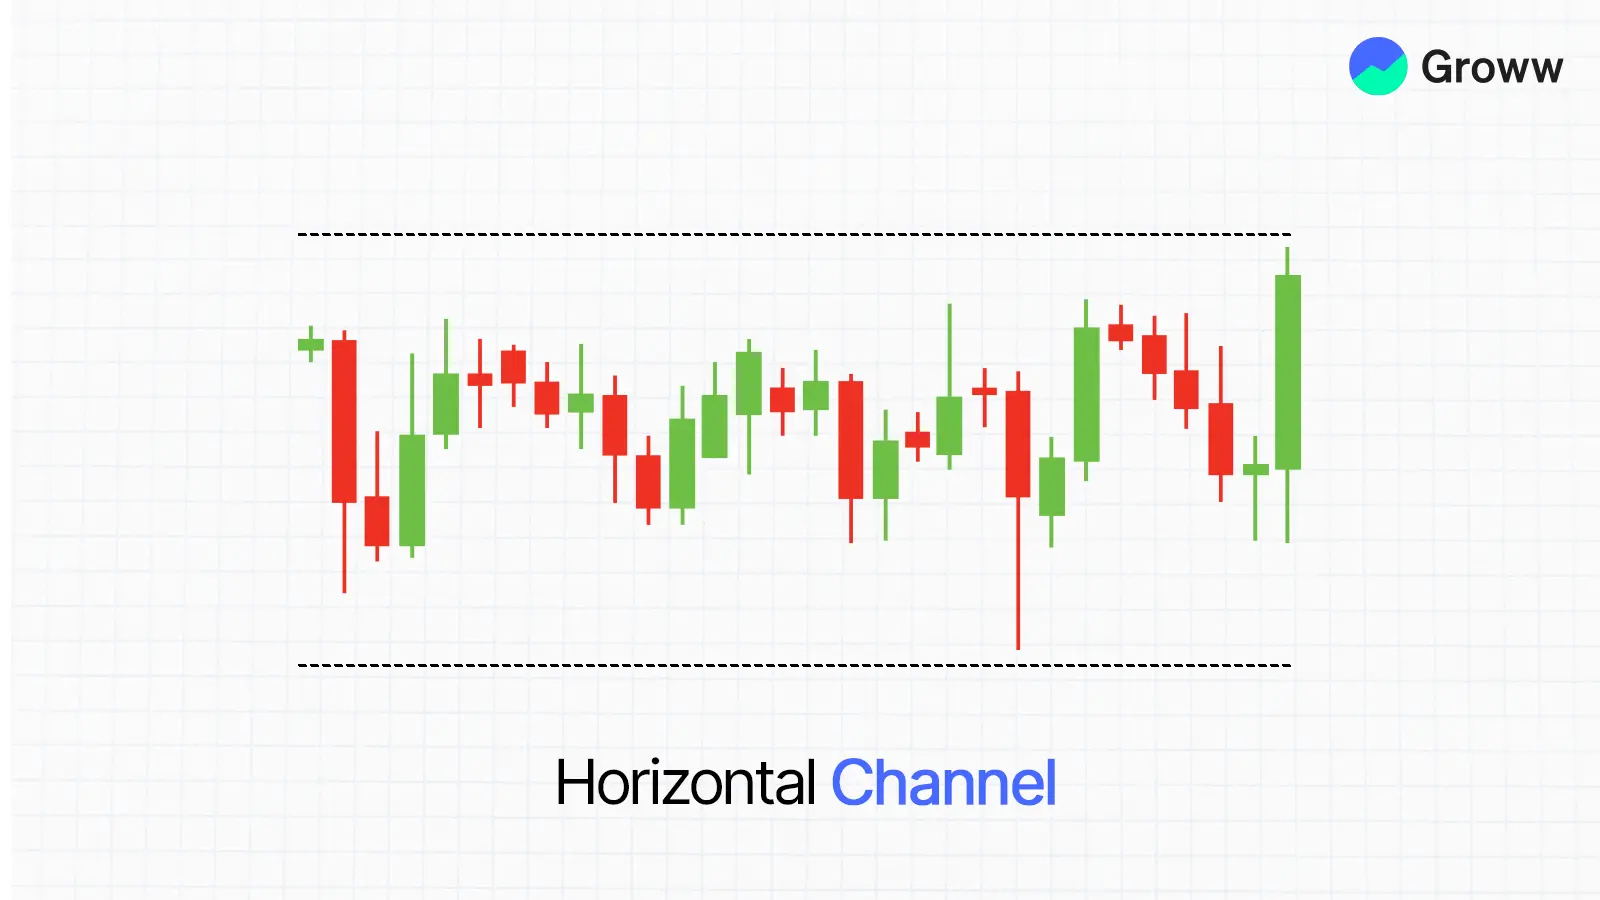
Horizontal Channel
Alternatively, it’s known as a range-bound channel when the following occurs:
- The price is moving near a straight line formed by support on the bottom and resistance above it.
- The stock is not showing any strong signs of increasing or decreasing.
This indicates market indecision, where neither buyers nor sellers are in control. They are perfect for trading ranges.
Envelope Channel
Envelope channels for technical analysis are parallel bands positioned at fixed distances (typically standard or percentage deviations) above and below the central moving average. They also adjust dynamically with price volatility, thereby helping identify oversold or overbought levels and market trends.
- Core components include a central moving average, such as the EMA or SMA, with the lower and upper bands plotted at a consistent offset. They contract or expand with market volatility, unlike more rigid trendlines.
- A price touching the upper band indicates overbought, while a price touching the lower band indicates oversold. On the other hand, breakdowns or breakouts indicate shifts in trends.
Some key types of envelope channels include the following:
- Bollinger bands, which use a Simple Moving Average (SMA) with the lower and upper bands fixed at two standard deviations from the Moving Average (MA)
- Moving Average Envelopes (percentage-based), where the bands are kept at a fixed percentage above and below the specific moving average
- Donchian Channels are based on historical lows and highs over a given period, rather than an MA.
- Keltner Channels make use of an EMA (exponential moving average), with the bands set by the ATR (Average True Range)
How to Draw and Identify Channels
To plot channels with precision, use trendlines.
- Identify two or more swing highs and swing lows that form a consistent upward, downward, or horizontal structure.
- You can use a trendline tool to sketch the trend.
- The line joining two or more swing lows is the support line.
- An additional line is drawn parallel to the support line and passes through swing highs.
- Draw the lines so that the price hits the boundary lines more than once to demonstrate that your Technical Analysis line is effective.
Keep in mind that most price fluctuations occur in the middle of the channel, and prices typically stay within the established limits.
Strategies Using Channels (Breakout, Reversal)
Since they are so flexible, price channels have many different functions.
Confirmation Tools
- Volume spike
- RSI divergence
- Matters such as engulfing or Doji that happen near the time when the breakout occurs
- Enter a position after the candle closes above/below the set resistance or support.
- Stop-loss is placed just within the channel’s lines.
- Within the terminal, note down the channel’s height and draw it from where the channel began.
Reversal Strategy
It occurs when the price approaches channel resistance or support but cannot break through it and instead drops back.
- Try to exit positions at resistance boundaries when the price is trending down or moving sideways.
- Get into an area of support in an ascending or horizontal channel.
This strategy works well for those who like trading within the established boundaries.
Tools to Use: Trendlines, Volume, RSI
Boost your channel trading using various tools available.
Trendlines
- The structure of a channel is based on this very element.
- Be sure to follow the same time frames when you trade, for example, use daily charts for swing trading.
Volume
- When the trading volume rises before a breakout, it typically indicates the strength of the impending move.
- When trading occurs at very low volumes, it may indicate false breakouts or a lack of confidence in the movement.
RSI (Relative Strength Index)
- An overbought RSI near channel resistance = potential sell.
- An oversold RSI near channel support = potential buy.
- Use RSI divergence to spot weakening trends before a breakout.
Common Mistakes and How to Avoid Them
Here are a few mistakes that may occur and how you can avoid them.
Drawing Channels with Only Two Points - Use at least three touchpoints (either on the support or resistance line) to validate a channel.
Ignoring Volume - Breakouts on low volume often lead to false signals. Wait for volume confirmation.
Trading Without Stop-Loss - Even valid-looking channels can break unexpectedly. Always use well-placed stop-loss orders.
Using Channels in Low Liquidity Assets - Illiquid assets may show erratic price movements that don’t respect technical levels.
Why Trading Channels Matter
Trading channels are important because they offer a more systematic framework for identifying market trends, managing risk more effectively, and making more disciplined trading moves based on defined resistance and support levels. You can use them to visualise potential price movements while planning your entry and exit points.
Some of their key benefits include:
- Clear support & resistance levels: The channel graphically indicates major price levels where the price of an asset is likely to reverse or pause. This makes it easier to find better trading opportunities.
- More structured risk management and trade planning: They enable more disciplined trading with in-built guidelines for take-profit levels and stop-loss orders.
- Identifying market volatility and trends: You can quickly determine whether the market is in an uptrend (ascending channel), a downtrend (descending channel), or a horizontal channel (sideways range). The channel width may also indicate the present volatility level.
- Various trading strategies: Channels help you test multiple strategies, including breakout trading, buying low and selling high, and more.
- Versatile application: These channels may be applicable across multiple timeframes, including monthly and intraday, and are helpful for commodities, stocks, and Forex alike.
- Better decision-making: By relying on historical price movements and technical analysis, channels will help you make more data-driven, objective decisions.
- Better confirmation: Channels can be more useful when combined with other technical indicators, such as moving averages or volume, helping you confirm signals and reduce the risk of false breakouts.
Channel Reliability and Confirmations
When assessing the channel's reliability, here are some pointers worth noting.
- Weak: 1-2 touches means it is not a valid or tradeable channel.
- Adequate: 3-4 touches indicate a tradeable channel with decent reliability.
- Strong: 5-6 touches indicate the channel is reliable and has a higher chance of price action within its boundaries.
- Very Strong: 6+ touches indicate a channel that is highly reliable.
A valid channel requires a minimum of 2 touches on each of the upper (resistance) and lower (support) lines for it to be perceived as reliable and tradeable. The longer the channel stays stable with respect to its boundaries, the more reliable the signals are.
When it comes to channel trading, secondary signals are typically used to validate entries, exits, and breakout signals. This helps weed out potentially false signals and other such moves. Some methods include the following:
- Volume Analysis: Any volume spike when prices bounce off a channel line or break out of the same will make any move more credible. Alternatively, low volumes during breakouts indicate weak moves that may fail (false breakouts).
- Indicators for Momentum: Momentum confirmation can be achieved using tools such as the MACD or RSI. If the RSI indicates oversold conditions near the lower channel boundary, it may signal a possible bounce. Also, divergence between the indicator and price movement may indicate a possible reversal.
- Candlestick Patterns and Price Action: Certain candlestick patterns at channel boundaries may help confirm market sentiment and potential reversals.
- Multi-Timeframe Analysis: Analysing the channel at a higher timeframe (e.g., daily) helps determine the overall trend. A shorter timeframe (like hourly) will help confirm entry more precisely.
- Moving Averages: Multiple moving averages can help confirm the trend's direction and overall momentum. This enables additional filters for exit and entry points.
Market Conditions and Timeframes for Channel Trading
Channel trading can be more effective across multiple market conditions, particularly in trending (upward/downward) and sideways markets. They are also applicable for almost all timeframes.
Channel patterns work best in markets where price movements remain contained within specific ranges, thereby respecting the parallel resistance and support lines.
Channel trading is helpful during established trends, where an ascending channel (uptrend) involves buying near the upward-sloping support line and selling near the resistance line. This helps capitalise on the already prevailing bullish sentiment.
In a descending channel or downtrend, traders seek short-selling opportunities near the downward-sloping resistance line, while covering at the support line. This syncs with the bearish momentum.
Sideways markets or horizontal channels are known as rectangles or trading ranges, featuring parallel and flat support and resistance lines. Traders may purchase at support and sell at resistance levels, thereby earning profits as the market oscillates within a narrower band.
Channel trading usually requires medium volatility to ensure sufficient profit potential. In low-volatility scenarios, the channel may be highly narrow, limiting profitable trading, while in high-volatility markets, a cautious approach is needed owing to a higher risk of false breakouts.
Here are the timeframes that may apply in this case:
- Short-Term: Scalpers and day traders may leverage 1-minute, 15-minute, and 5-minute charts for tapping into swift price movements within the channel.
- Medium-Term: Swing traders mainly use 4-hour, hourly, or daily charts to hold positions for several days to even two weeks.
- Long-Term: This is for position traders who usually rely on monthly or weekly charts to find and trade within long-lasting, broader market trends.
Risk Management: Stop-Loss and Take-Profit Using Channels
Here are some aspects to consider when placing stop-loss and take-profit orders using channels.
- Long Positions (Buy low and sell high):
- Entry: Buy when the price reaches the support or bottom of the channel
- Take-profit: Put the take-profit order at the top or resistance level of the channel to lock the gains whenever you reach the price target
- Stop-loss: Set the stop-loss order just below the bottom of the channel to limit potential losses if the price breaks support and moves against the position. It offers more room for normal market fluctuations.
- Short Positions (Sell high and buy low):
- Entry: Short-sell only when the price reaches the resistance or top level of the channel
- Take-profit: Place the take-profit order at the bottom (support) of the channel
- Stop-loss: Place the stop-loss order just above the channel's top to safeguard against losses. This is useful if the price breaks the resistance and rises.
Some risk management principles worth keeping in mind include:
- Target a risk-reward ratio of at least 1:2 or 1:3, which means that the possible profit should be a minimum of 2-3 times higher than the potential loss.
- Calculate the position size based on the distance to the stop-loss and also the percentage of total capital that you can risk for one trade, which is usually 1-2%. This will prevent any single losing trade from significantly affecting your entire account.
- Channels may be wider in volatile markets. You can adjust the stop-loss distance accordingly to avoid being affected prematurely by normal price swings.
- You may consider using trailing stop-loss mechanisms that automatically shift the stop-loss level upwards as market prices move in your favour. This will help you lock in profits while enabling additional gains if the trend continues.