Bullish Engulfing Pattern
The bullish engulfing pattern is a Japanese candlestick pattern that can assist traders in analyzing market sentiment and identifying the start of a new bull trend. Meanwhile, a bearish engulfing pattern confirms that sellers are shorting, indicating a possible trend reversal.
It is simple to recognize the bullish and bearish engulfing patterns once you are familiar with them, offering traders with good risk-to-reward ratios.
Check Here to know How to Read Candlestick Charts.
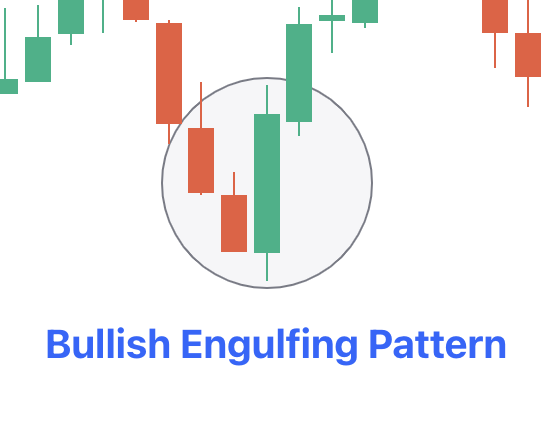
What is a Bullish Engulfing Pattern?
When preceded by a cluster of red or black candlesticks indicating a bearish trend, the bullish engulfing candlestick pattern indicates a positive trend reversal. The bullish green or white candle body completely surrounds or engulfs the previous day's red or black candlestick, signalling the start of a fresh upswing.
When bullish engulfing occurs, it signifies that additional buyers have joined the market, pushing the price higher and causing the trend to reverse. This candle is typically seen towards the bottom of a downtrend.
Importance of the Bullish Engulfing Candlestick Pattern
Only a downward price movement followed by an upward price movement qualifies for bullish engulfing.
Prices must open lower than the prior trading session for a pattern to be called bullish engulfing. Furthermore, regardless of the day's highs and lows, prices must gap down and close at a level higher than their previous close.
- Such can usually be found at the bottom of a downturn in a trending market.
- Bullish engulfing indicates a short-term shift in market sentiment caused by events, announcements, price corrections, or any other positive trigger. To determine whether the reversal is sustained, check to see if the red or black candlestick in the current engulfing pattern is preceded by four red/black candlesticks.
Following the white or green candlestick, another white or green candlestick closes at a high above the bullish engulfing candles. That is, on day three, prices begin at the previous high and rise further. - It depicts the point at which the bulls took over the pricing game from the bears in the market.
How to Identify a Bullish Engulfing Pattern?
Look for the following critical elements to identify this pattern:
- A clear downward trend must be in effect.
- At the bottom of the downtrend, there should be a small black candle.
- A white candle must follow the black candle, and its body must completely cover (engulf) the black candle.
- The top of the white candle must be higher than the top of the black candle, and the bottom must be lower than the bottom of the black candle.
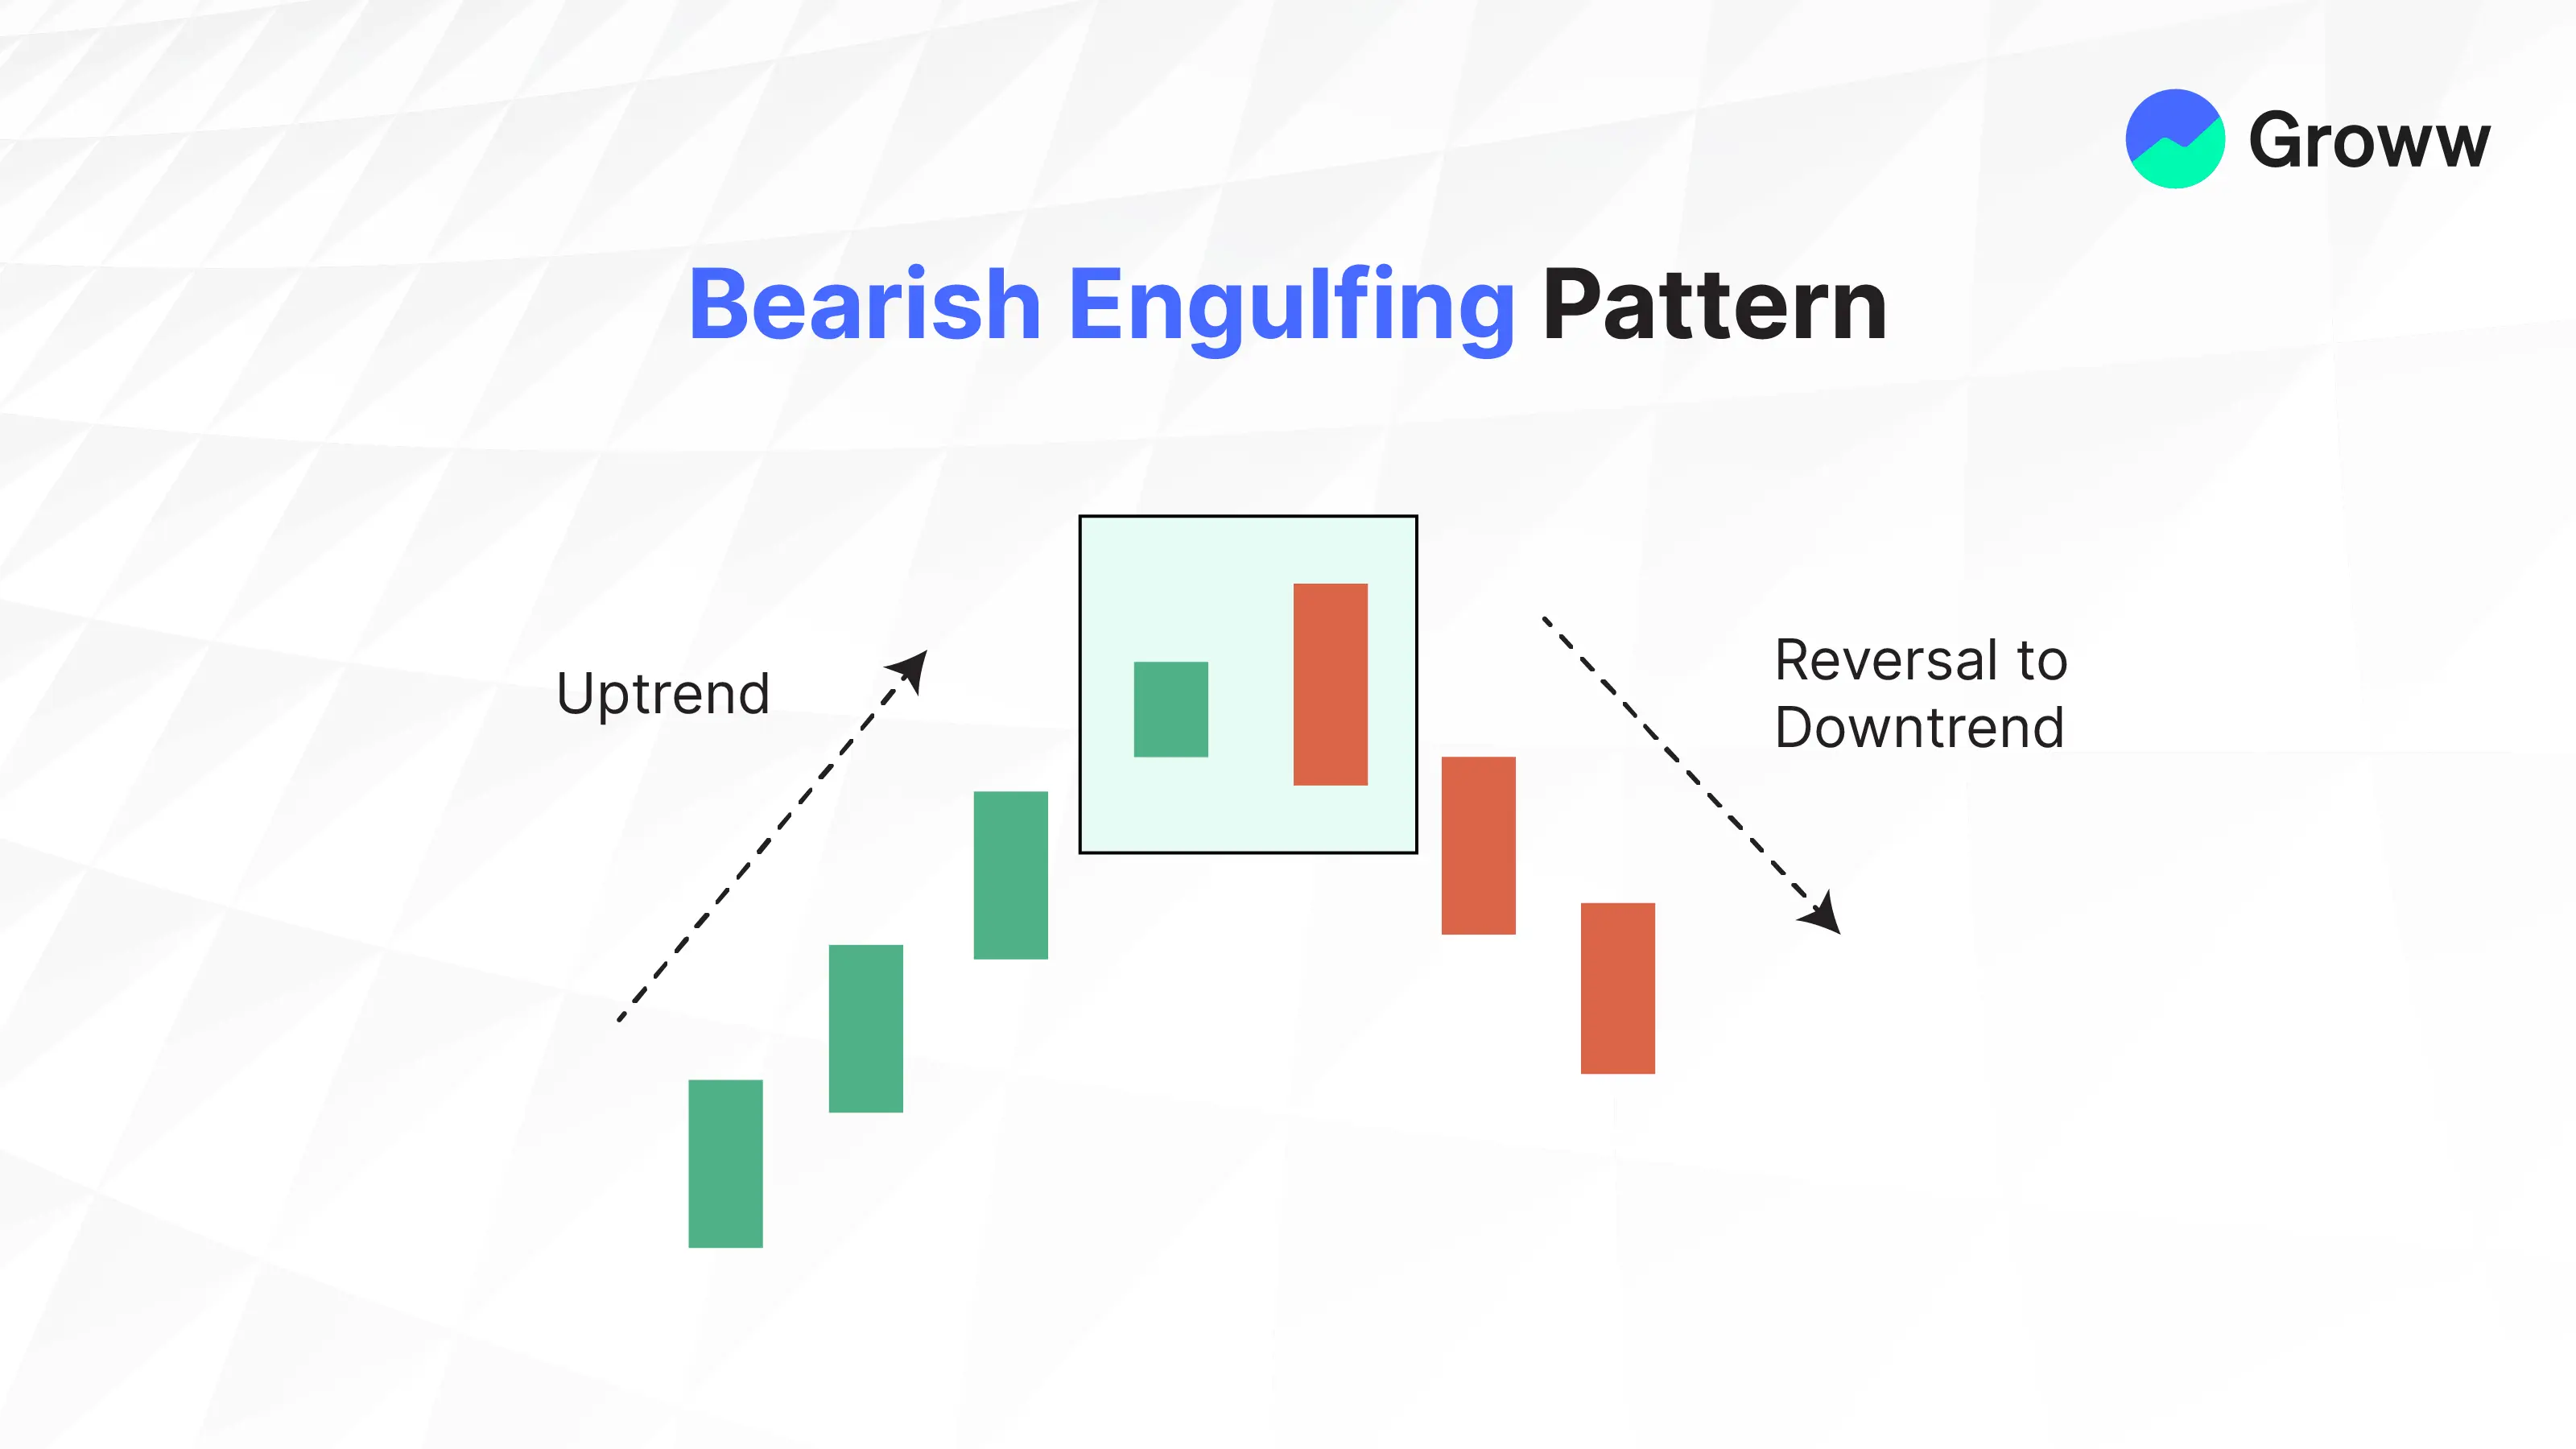
Difference Between Bullish and Bearish Engulfing Pattern
These two designs are diametrically opposed. A bearish engulfing pattern appears after a price rise higher and implies that lower prices are on the way.
In this two-candle arrangement, the first candle is an up candle. The 2nd candle is a larger down candle with a true body that completely envelops the smaller up candle.
Limitations
Since candlesticks do not provide a price target, engulfing patterns can make determining the potential reward difficult. Instead, traders will need to use alternate tactics, such as trend analysis or indicators, to determine a price target or when to exit a winning trade.
Although not perfect, such patterns can be a powerful indicator, especially when combined with the current trend. Following a sharp price decline, engulfing patterns are especially useful because they indicate when momentum is shifting upward. Even though the price is generally rising, the engulfing pattern's impact is diminished because it is a fairly common signal.
The enclosing candle or second candle could also be massive. If they choose to trade the pattern, the trader may be left with an extraordinarily large stop loss. The possible profit from the trade may not justify the risk.
Check More Bullish Chart Patterns
|
Bullish Pattern |
Features |
|
A reversal pattern which consists of: - A small body candle, and - Long lower shadow/wick |
|
|
A reversal pattern which consists of: - It starts with a long bearish candle - Followed by a small-bodied candle (either bullish or bearish) - And ends with a long bullish candle. |
|
|
- A strong bearish candle followed by a bullish candle. - Second candle opens below the previous candle's close but closes above the midpoint (50%) of the previous bearish candle. |
|
|
- It is is a two-candlestick pattern that signals a possible upward trend reversal. - Small bullish candle is completely contained within the body of the previous large bearish candle. |
|
|
- It consists of three long bullish candles with small wicks that appear consecutively one after another. - Each new candle opens inside the previous one’s body and closes higher than the last. |
|
|
A reversal pattern which: - Appears at the bottom of a downtrend - A small body with a long upper shadow and little to no lower shadow. |
|
|
A reversal pattern which consists of: - A single candlestick pattern - A very small body and a long lower shadow that appears at the bottom of a downtrend |
|
|
- It consists of a long bearish candle - Followed by a doji candle that gaps down - And then a long bullish candle that gaps up. |
|
|
A three candlestick pattern with: - A large bearish candle, - A small bullish candle that closes above the 50% level of the first candle and - A third bullish candle that closes above the first candle's open. |
|
|
Starts with a bearish candle - Followed by a bullish candle that engulfs the first candle - Ends with another bullish candle that closes higher. |
|
|
- Starts with a long bearish candle - Followed by an even longer bullish candlestick. The candle opens higher than the previous day's closing price and rises even more. |
|
|
A two-candlestick pattern that includes: - Two equal-sized bullish and bearish candles. |
|
|
It consists of five candles in a continuation pattern - A long bullish candle - Three small bearish candles that trade above the low and below the high of the first candlestick - And another long bullish candle that closes above the high of the first candlestick. |
|
|
It is similar to the rising three methods pattern consisting of five candles - It starts with a long bullish candle - Followed by three small bearish candles (a smaller bearish candles that move lower) that stay within the range of the first candle - And end with another long bullish candle that closes above the high of the first candle. |