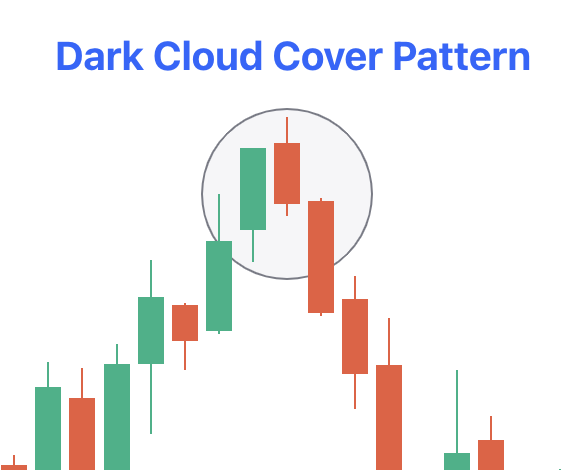
Dark Cloud Cover Pattern
The Dark Cloud Cover pattern is a major candlestick pattern indicating a probable trend change – from an uptrend to a downtrend. It forms when a bullish candle is followed by a bearish candle that closes below the midpoint of the prior bullish candle.
This pattern indicates a shift in momentum from the upside to the downside following a price rise. Hence, it is an important pattern that is considered by traders to gauge whether the candle following the bearish candle also shows declining prices. Here we have covered information related to the dark cloud cover candle pattern in detail.
Check Here to know How to Read Candlestick Charts.
What is a Dark Cloud Cover Candlestick Pattern?
A Dark Cloud Cover candlestick pattern occurs when one big black candle forming a ‘dark cloud’ overlaps the previous day's candle. The price opens higher on buying strength, then drops because sellers take control, forcing it lower. This transition from buying to selling may be an indication of a reversal into a downtrend.
This pattern is considered most useful by traders at the end of an uptrend since it indicates a potential drop in price. However, where the market is highly unstable, this pattern has little reliability, and prices continue changing.
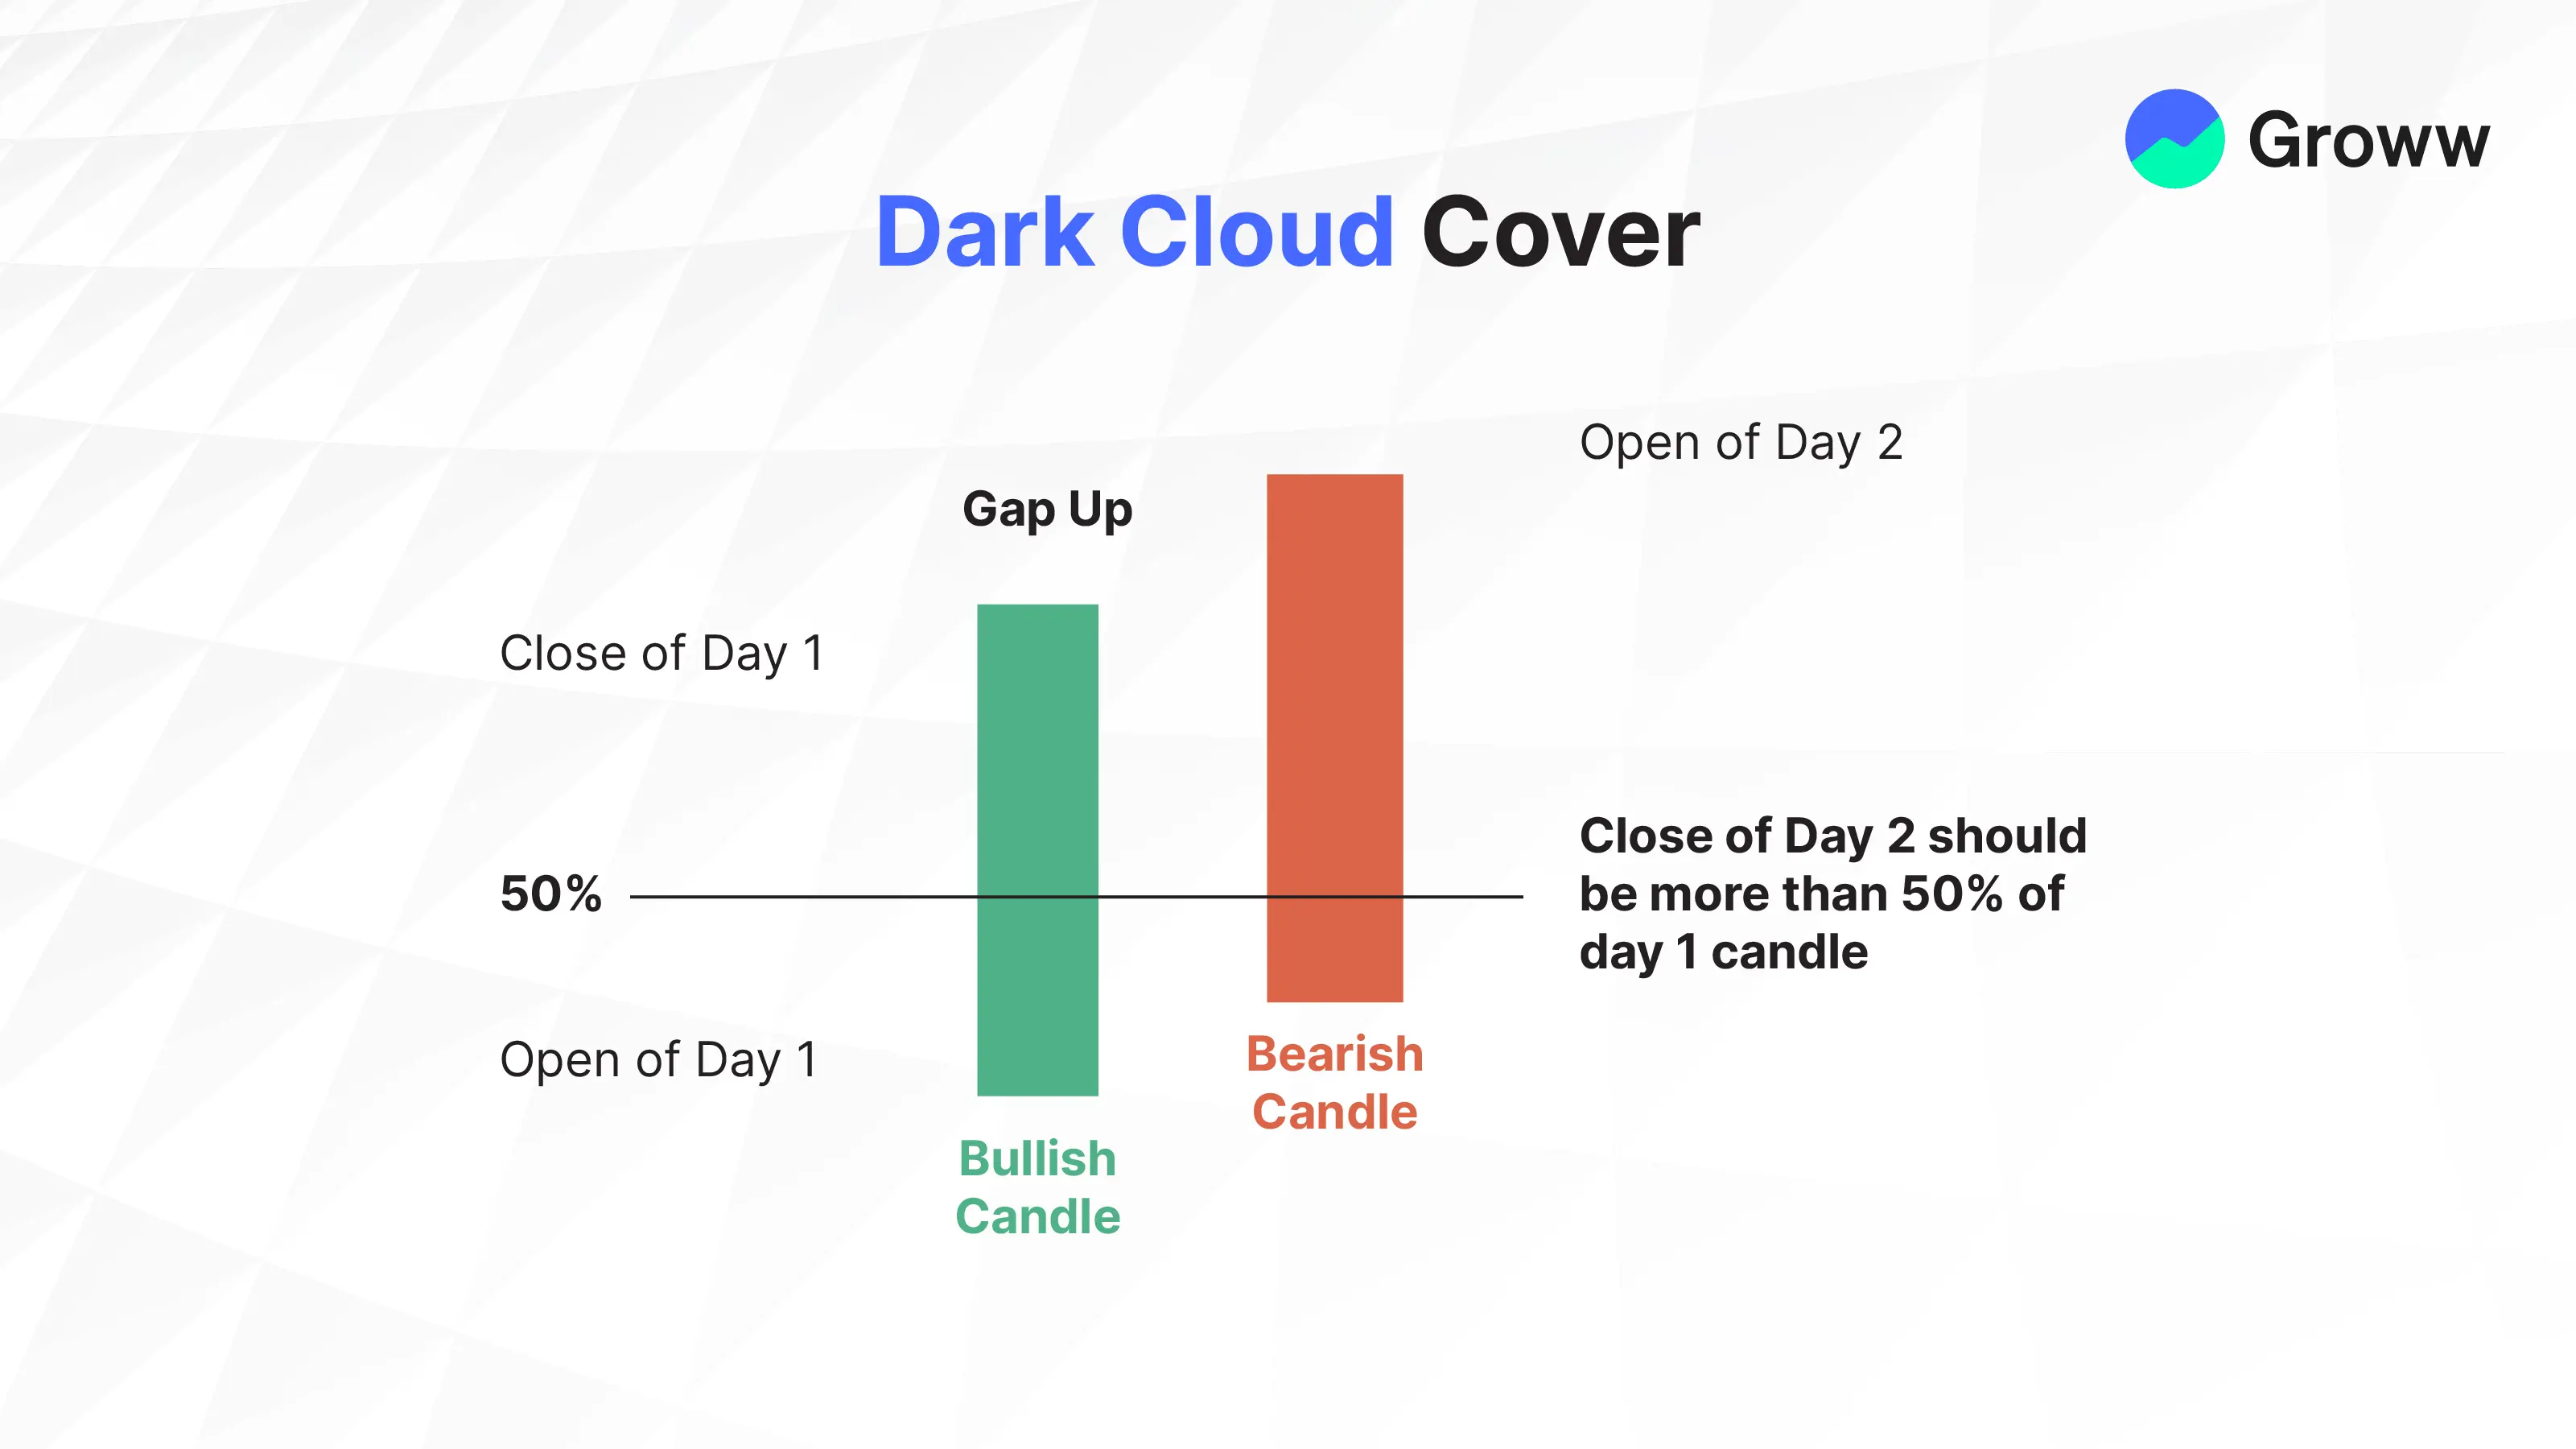
The Dark Cloud Cover pattern has five key conditions:
- A rising price trend.
- A bullish candle in that trend.
- A gap up the next day.
- The gap up turns into a bearish candle.
- The bearish candle closes below the middle of the previous bullish candle.
How is Dark Cloud Cover Pattern Formed?
The Dark Cloud Cover candle pattern appears after a price rise and includes a big bearish candle that covers the previous day's candle. It appears at the top of an uptrend and involves a large green candle, which is a bullish candle. This bullish candle is followed by a red candle that creates a new high before closing lower than the mid-point of the previous green candle.
Here’s how a dark cloud cover chart pattern is formed:
- It starts with a bullish candle during an uptrend.
- The price opens higher the next day, but then a bearish candle appears.
- This bearish candle closes below the middle of the previous bullish candle.
- Both candles should be large with short or no shadows.
When trading with dark cloud cover pattern, one should keep the following points in mind:
- The trend should be going up because this pattern signals a possible drop.
- The size of the candles helps show the potential strength of the reversal.
- The gap between the candles indicates the potential strength of the reversal.
- The bearish candle should close below the mid-point of the previous bullish candle.
- Both candles should have large bodies.
How to Use Dark Cloud Cover Pattern in Trading?
This pattern generally appears after a price rise, indicating a possible change from buying to selling. This pattern is more common in unstable markets and might suggest traders change their approach. In steady markets, it happens less often because strong trends usually last longer before changing direction.
To trade with the dark cloud cover candlestick pattern, follow these three easy steps:
- Find the Pattern: Look for a big bearish candle right after a big bullish candle.
- Check the Trend: Use a tool like RSI to see if the trend matches the pattern.
- Take Action: Since the pattern signals a possible drop, consider shorting or selling to avoid losses.
Advantages & Disadvantages of Dark Cloud Cover Pattern
The table below shows the advantages and disadvantages of dark cloud cover candlestick pattern:
|
Dark Cloud Cover Pattern |
|
|
Advantages |
Disadvantages |
|
Early Entry: This pattern helps you spot a possible drop early. Therefore, investors can profit by entering a trade when a drop in price is signalled as a strategic move through short-selling, buying put options, and inverse ETFs. |
False Signals: It might give wrong signals if not backed by other tools, which could lead to losses. |
|
Easy to Spot: It’s easy to recognise and therefore, is great for beginners. |
Not Reliable in Volatile Markets: It may not work well in markets with sudden price changes. |
|
Risk Management: It can warn you to take profits or manage risks if you’re already in a trade. |
Lagging Indicator: It might show a trend reversal only after it starts. So, you might need other indicators for better timing. |
|
Confirmation: It can support other analysis tools, giving you more confidence in your trades. |
|
The Dark Cloud Cover pattern is useful, especially for beginners, because it’s easy to identify, helps with early trades, risk management, and confirms other analyses. However, it can sometimes give false signals, may not work well in unstable markets, and might show trends after they start.
Check More Bearish Chart Patterns
|
Bearish Pattern |
Features |
|
It forms when a small bullish candle is followed by a large bearish candle that completely engulfs the previous green candle |
|
|
It is formed when three consecutive long-red candles with small wicks are visible |
|
|
It appears at the top of the uptrend as a single candle with a small body and a long lower shadow |
|
|
It is a three-candlestick pattern that - Starts with a long bullish candle - Followed by a small-bodied candle that gaps up - And ends with a long bearish candle that closes well into the body of the first candle |
|
|
It is a reversal strategy which: - Is a single candlestick pattern with a small body, a long upper shadow, and little to no lower shadow |
|
|
It is a two-candlestick pattern that: - Starts with a long bullish candle followed by a Doji (a candle with a very small body) |
|
|
It is a two-candlestick pattern where: - A small bearish candle is completely engulfed within the body of the previous large bullish candle |
|
|
- It consists of two or more candles with matching highs and appears at the top of an uptrend. - The first candle is usually bullish - And the second candle is bearish |
|
|
- It starts with a long bullish candle - Followed by a long bearish candle that opens below the previous candle’s opening price and closes lower |
|
|
It is a three-candlestick pattern that: - Starts with a bullish candle - Followed by a smaller bearish candle that is completely within the first candle - And ends with another bearish candle that closes lower |
|
|
It is a three-candlestick pattern that - Starts with a bullish candle - Followed by a bearish candle that engulfs the first candle - And ends with another bearish candle that closes lower |
|
|
it is a five-candlestick pattern that: - Starts with a long bearish candle - Followed by three smaller bullish candles that stay within the range of the first candle - And ends with another long bearish candle that closes below the first candle |
|
|
It is a three-candlestick pattern that - Starts with a long bullish candle - Followed by a Doji that gaps up from the previous candle - And ends with a long bearish candle that gaps down from the Doji. |