What Are Bollinger Bands? Meaning, Formula & Trading Strategy
Bollinger Bands are both versatile and one of the most widely used technical indicators in the trading world. Whether you are trading stocks, options, or futures, Bollinger Bands help you visualise price action for volatility, potential breakouts, or reversals defined by solid numbers.
In this guide, we will cover the basics of Bollinger Bands, how to use them, common errors, and real-world trading strategies.
Introduction to Bollinger Bands
Bollinger Bands are a volatility-based technical analysis indicator that consists of three calculation lines:
- A Simple Moving Average (SMA)
- An upper band
- A lower band
The distance between the bands expands or contracts based on market volatility: when volatility is high, the bands expand, and when volatility is low, they narrow. Traders commonly use Bollinger Bands to identify overbought or oversold levels, pattern breakouts, and low-volatility areas that may signal future momentum.
Who Created Bollinger Bands?
Bollinger Bands are named after their creator, John Bollinger, who developed them in the 1980s. John utilised a dynamic technical indicator that could adapt to underlying market conditions, rather than the static trading ranges regularly used by traders. Currently, Bollinger Bands are a standard indicator on nearly all trading platforms.
How Bollinger Bands Are Calculated
The calculation of Bollinger Bands is done with a Simple Moving Average or SMA for the middle band and the standard deviations for the lower and upper bands. It is typically done over 20 periods, with the Middle Band being the 20-day SMA and the Upper Band being the SMA plus 2 standard deviations. The Lower Band in this case is the SMA, which is two standard deviations below the price to track price volatility.
Here are the steps for the calculation:
- Middle Band (SMA): For the set period (say 20 days), sum the closing prices and then divide them by the number of periods. This will calculate the 20-day Simple Moving Average.
- Standard Deviation: Work out the standard deviation for the exact price figures (say 20 days) used for the SMA. This measures the price volatility.
- Upper Band: Add the standard deviation (multiplied by the set factor, mostly 2) to the Middle Band. So, it is the Standard Deviation x 2 + Middle Band.
- Lower Band: Deduct the standard deviation (multiplied by the same factor, mostly 2) from the Middle Band. So, in this case, it is Middle Band - Standard Deviation x 2.
Components of Bollinger Bands
Here are some of the main components of Bollinger bands.
➤ Middle Band (Simple Moving Average)
- Usually, a 20-period Simple Moving Average (SMA).
- It is primarily helpful for establishing a baseline or trend for the indicator.
➤ Upper and Lower Bands (Standard Deviations)
- Plotted two standard deviations below and above the middle SMA line
- representation of price volatility with st. Dev. indicating volatility: wider bands = high; narrower bands = low
Formula:
- Upper Band = SMA + (2 × Standard Deviation)
- Lower Band = SMA - (2 × Standard Deviation)
How to Interpret Bollinger Bands
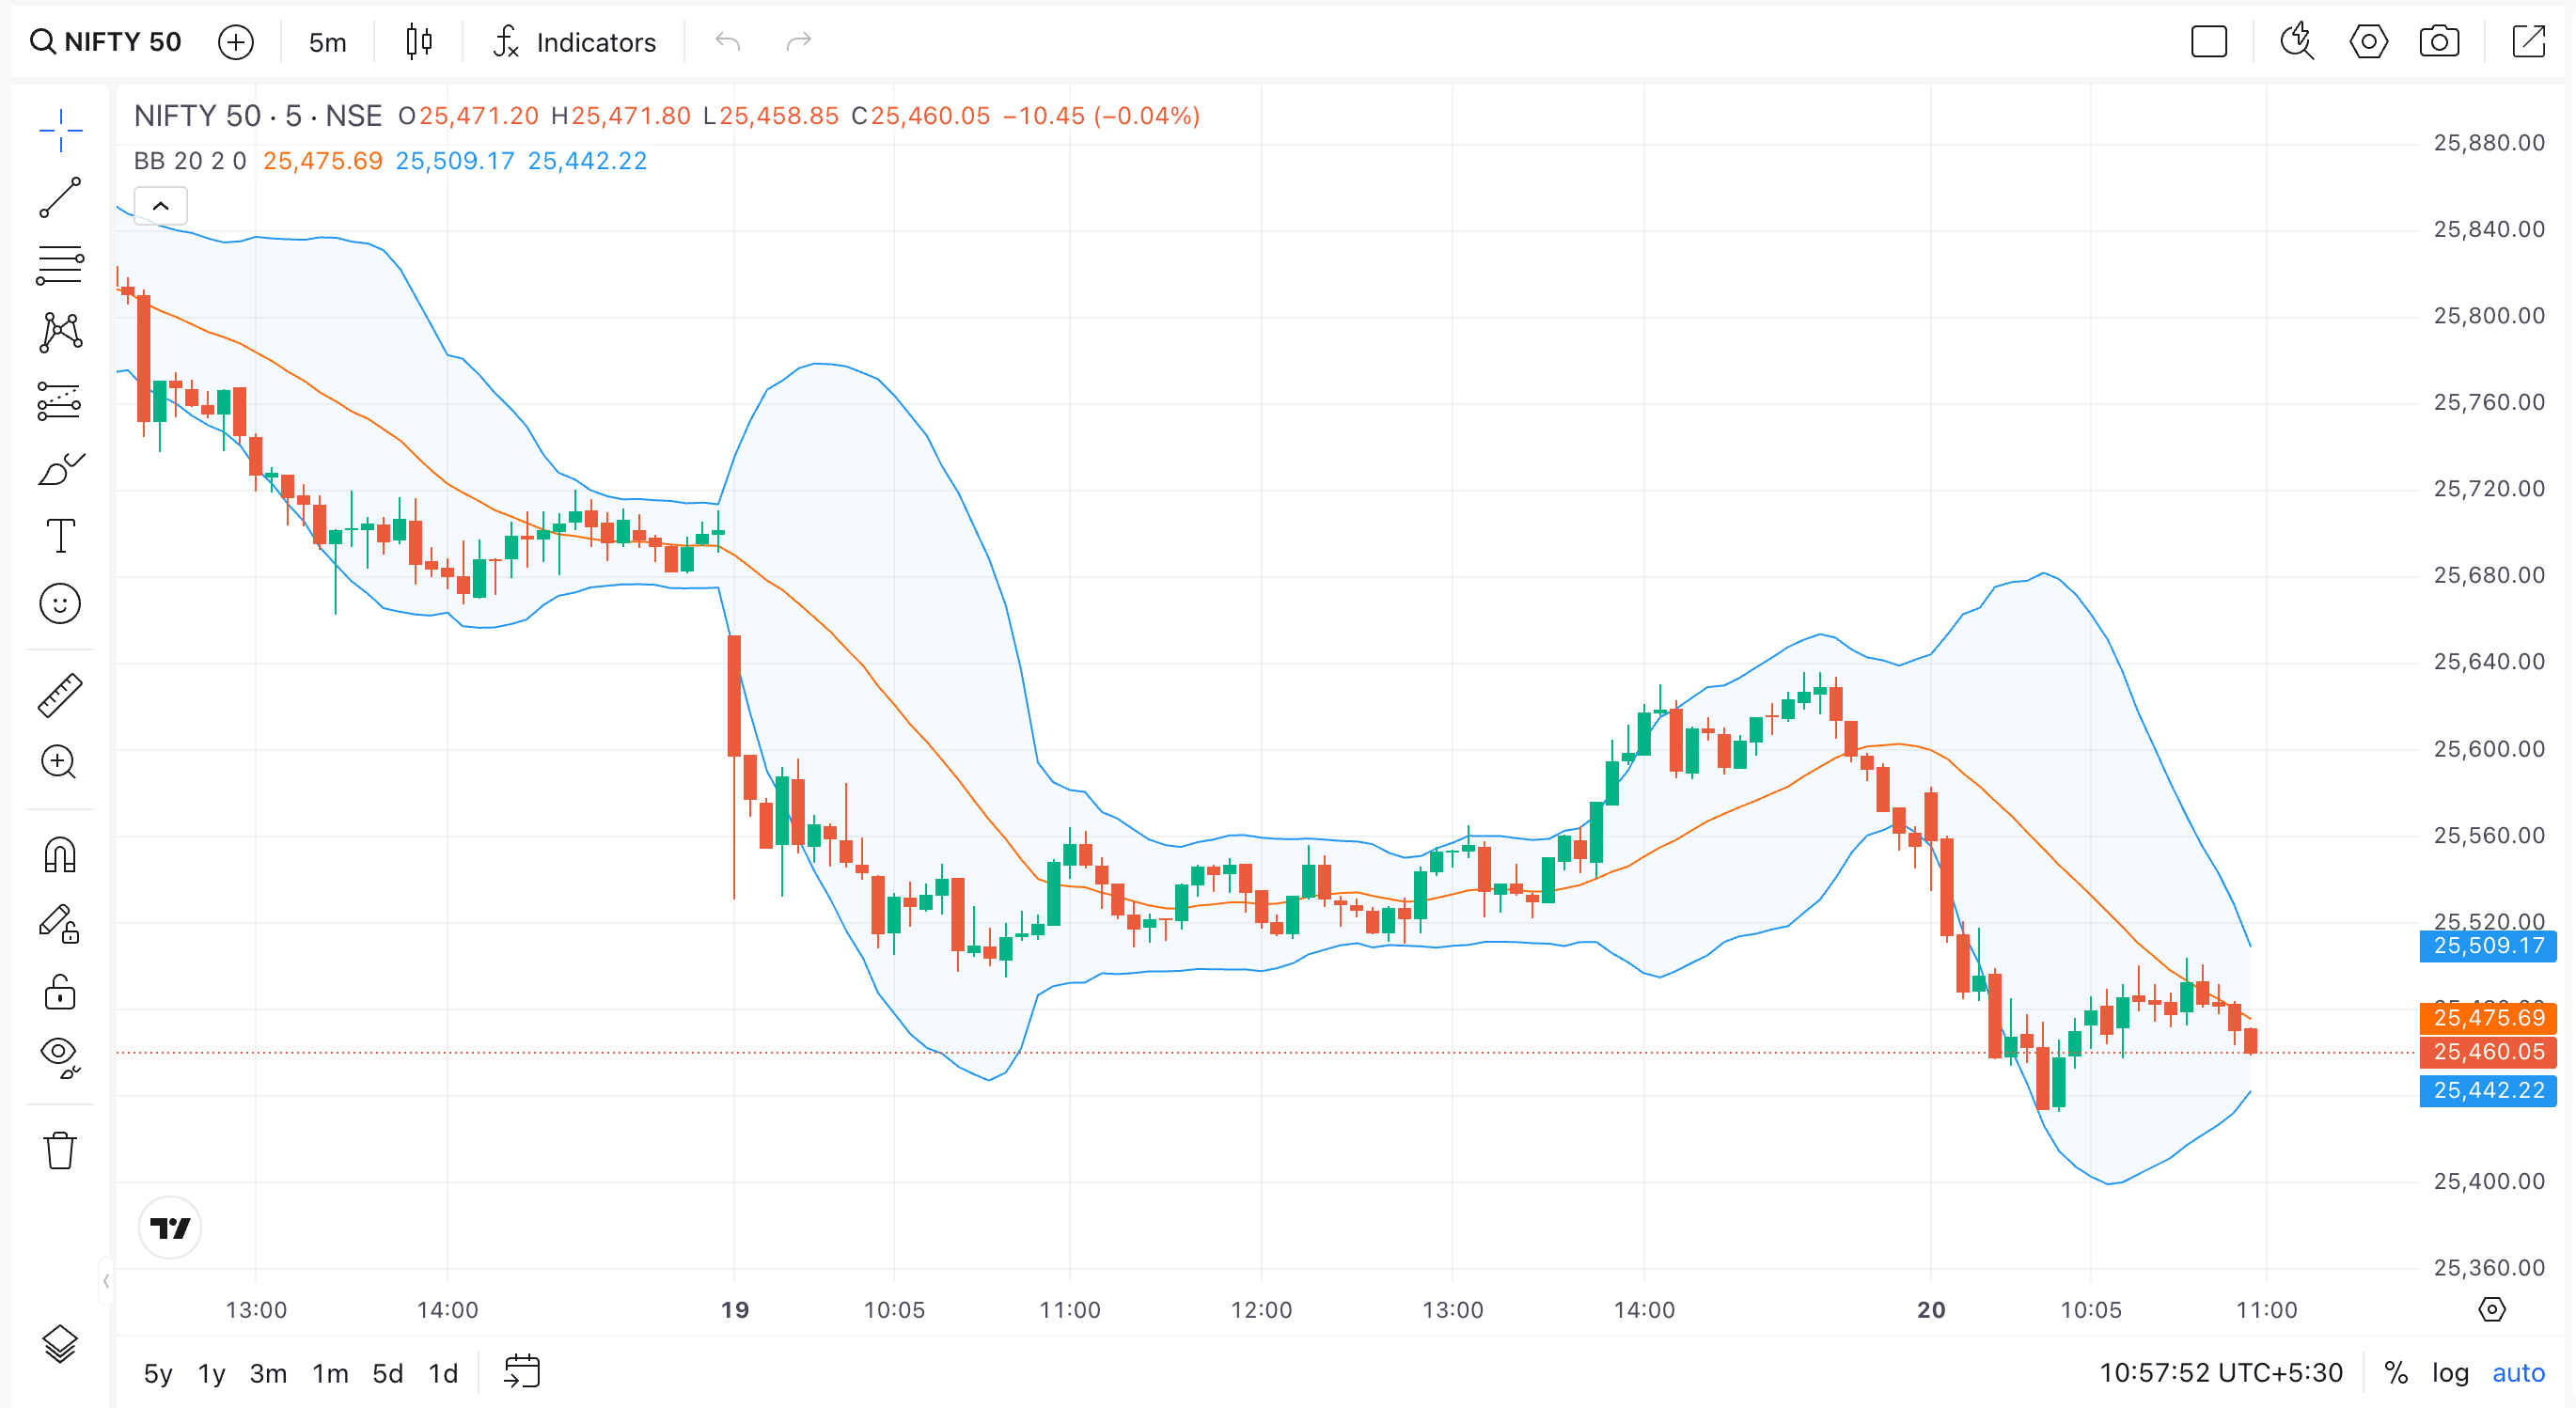
Bollinger Bands are an effective technical indicator that helps traders visualise price squeezes, low volatility, and gaps, as well as potential trading opportunities. A Bollinger Band is made up of three bands: a central band (the default setting is a 20-period Simple Moving Average), and two outer bands that are two standard deviations away from the central band. Here is how to correctly interpret a Bollinger Band:
- When the bands come together and contract closely, it signals a Bollinger Band squeeze, a sign of low volatility. Typically, this is viewed as a warning to traders that a sharp price movement or breakout is imminent, either up or down. Traders keep a close eye on squeezes because they can quickly develop into a profitable trade setup.
- When price comes in contact with, or breaches, an upper or lower band, it indicates that price is either overbought (upper band) or oversold (lower band). However, it is important to note that just because the price is touching the upper or lower band, it does not mean it is an automatic signal for price reversal; price can and often will continue up or down in the direction of the trend, especially in a strong bullish or bearish market.
- When the price can ride the upper band, it indicates strong bullish momentum. When price consistently trades in the lower band, it should be viewed as bearish momentum.
- Traders use volume to confirm a breakout (or potential reversal). To increase projections, traders often add Bollinger Bands alongside other indicators, such as RSI, MACD, or Moving Average crossovers.
- In summary, while Bollinger Bands can identify squeezes, breakouts, and overextensions, it is always a good idea to have other confirmation tools to make your profits more reliable!
Trading Strategies Using Bollinger Bands
Here are some of the trading strategies you can deploy with Bollinger bands.
Mean Reversion Strategy
- Assumes price will revert to the middle band after reaching the upper or lower band
- Ideal for range-bound or sideways markets
Entry: Buy near the lower band, sell near the upper band
Stop-loss: Just outside the bands
Take profit: Near the middle band (SMA)
Trend Following Strategy
- Enter trades in the direction of a confirmed breakout
- Works best in strong trending markets
Entry: On breakout with volume confirmation
Stop-loss: Inside the band
Take profit: Ride the trend, using trailing stops.
For options, Bollinger Bands can pair well with strategies like straddles or strangles, especially when anticipating volatility expansion.
Common Mistakes to Avoid
Here are some common errors worth avoiding.
- Assuming all breakouts are sustainable: Many of them are false without volume confirmation.
- Ignoring trend direction: Bollinger Bands work best when combined with trend analysis.
- Using fixed settings for all assets: Adjust the moving average period and standard deviation to suit different instruments or timeframes.
- Forcing trades in a low-volatility market: Sometimes, the best trade is no trade.
Combining Bollinger Bands with Other Indicators
To improve accuracy, combine Bollinger Bands with:
- Moving Average Crossover Patterns
- Relative Strength Index (RSI) to confirm overbought or oversold conditions
- MACD to track momentum shifts
- Golden Crossover Strategy for long-term trend confirmation (Golden Crossover Strategy)
- Option Chain and Implied Volatility to optimise options trades (Option Chain, Implied Volatility in Options)
Risk Management & Position Sizing with Bollinger Bands
When managing risks with Bollinger Bands, use the band width for position sizing: a smaller size for high volatility/wider bands and a larger size for lower volatility/narrower bands. You also have to set stops below the lower band for long trades or above the upper band for shorter trades. Here are some key aspects worth noting in terms of risk management and position sizing:
- Placing Stop-Loss: Put stops right outside the bands, i.e. below the lower band for a long trade and above the upper band for a short trade.
- Volatility-based Position Sizing: You can adjust the trade size based on the volatility bandwidth. In this case, it equates to smaller positions during wide bands or high volatility, and possibly larger positions during narrow bands or low volatility periods.
- Dynamic Resistance or Support: The upper band may be used as resistance, while the lower band can be used as support for any mean-reversion trades. However, being careful about breakouts is necessary in this case.
- Position Sizing for High Volatility: For wide bands, lower the position size to restrict possible losses arising from bigger price swings.
- Position Sizing for Low Volatility: In the case of narrow bands, it suggests a potential big move. You may take slightly larger positions with tighter stops, or wait until the breakout is confirmed.
- Considerations: Ensure your potential reward justifies your overall risk, using the band levels to set targets. Always use Bollinger Bands in conjunction with added indicators, such as the RSI (Relative Strength Index) or the MACD (Moving Average Convergence Divergence).
- Bollinger Squeeze: Watch for narrow-band periods that precede volatility. However, strict stops are necessary, since breakouts may eventually be false in such cases.