What is Rising Three Methods Candlestick Pattern?
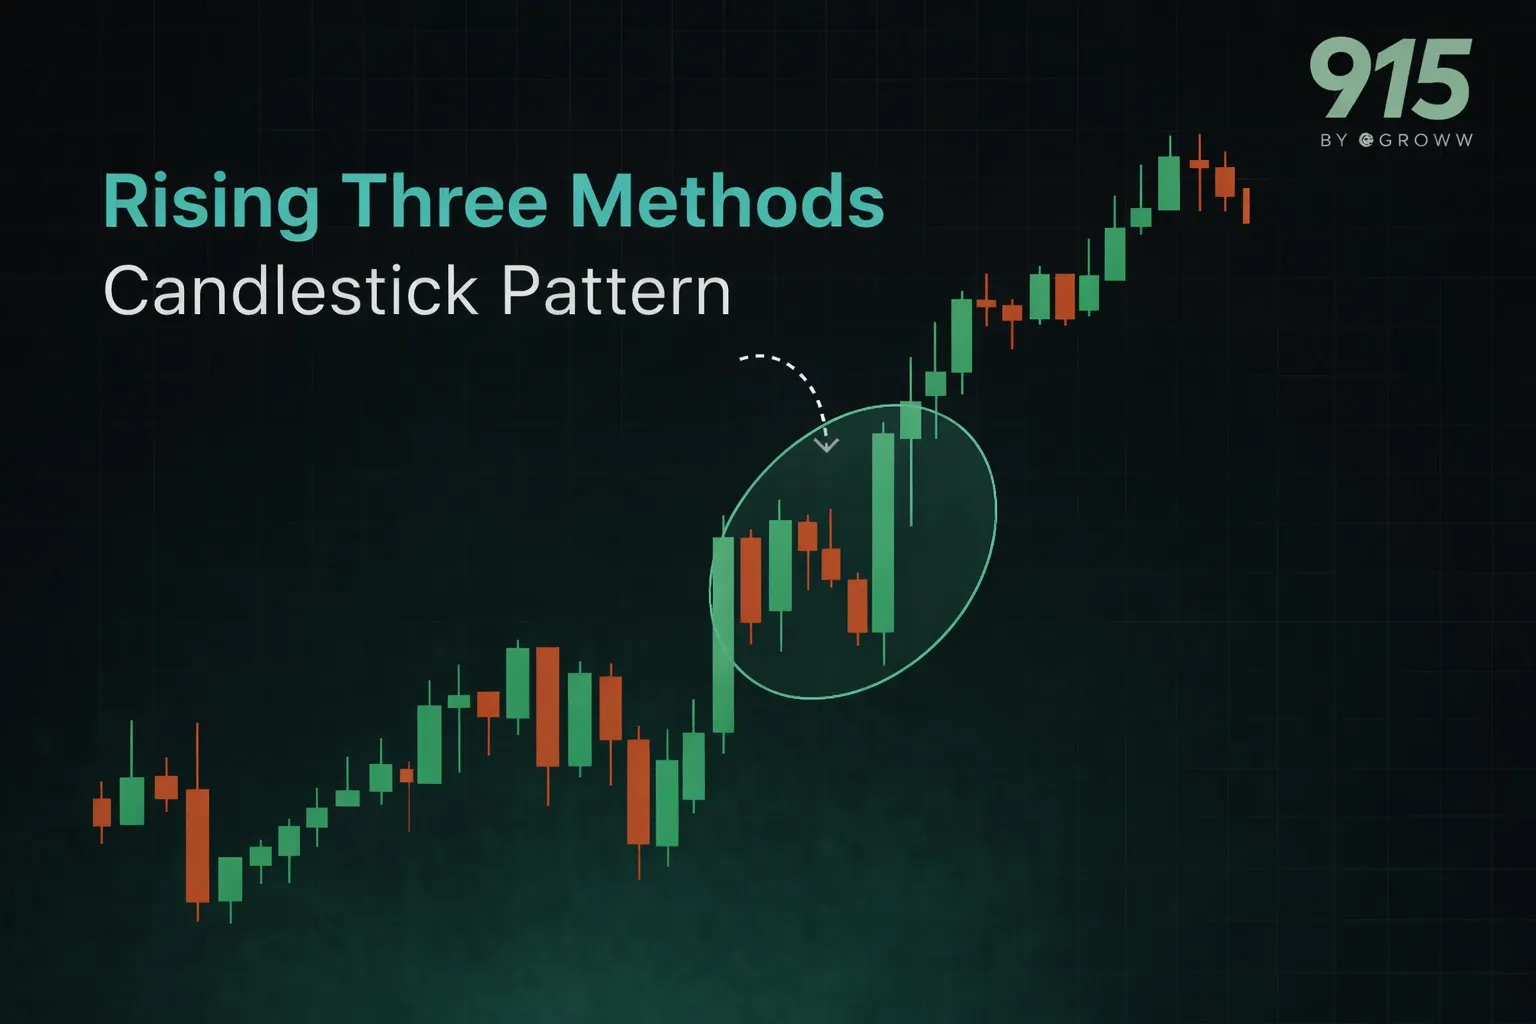
The rising three methods candlestick pattern is a sequence of three distinct candlesticks, where a bullish and long candle is followed by three smaller bearish candles and then a final long candle, which indicates the bullish pattern’s continuation. You can identify this pattern and leverage it to plan your trading strategies. Let us learn more about it below.
Let’s find out more about this pattern below.
Rising Three Methods Candlestick Pattern - What it Means & Ways to Identify
Check Here to know How to Read Candlestick Charts.
Here are a few aspects regarding the rising three methods candlestick pattern that will help you understand what it is and some key attributes.
- It means a sequence of three distinct candlesticks
- You can call them a bullish continuation pattern that forms only when share prices are going up and there is an uptrend in the market
- The first candlestick is a strong and long bullish candle, indicating how buyers are currently dominating the market (green)
- Three smaller bearish candles are then seen, which indicates the correction stage (red). Their lows and highs are within the first candle’s range
- The fifth and final long candle (green) ends this pattern and indicates the continuation of the bullish trend observed earlier, opening and closing above the initial bullish candle’s closing high and low
- So, while prices may fall temporarily, they will again rise in the future, with the uptrend/bullish pattern continuing
Example:
Suppose a stock closes at a high of ₹500 after having jumped from a low of ₹350 on day one. Yet, it suddenly comes down to ₹472, ₹450, and then ₹430 in the next three days. On day five, you will see the formation of the rising three methods candlestick pattern with the fifth candle opening at ₹455 and closing at ₹505.
So, it’s the reading by the investor that matters here; you’ll have to swiftly identify the pattern and plan your moves accordingly.
Also check : Scalper Mode on 915 | Straddle Chart
How Can the Rising Three Methods Candlestick Pattern Influence Your Trading Strategy
Trading with the knowledge of the rising three methods candlestick pattern is a new ball game for most market players. Here are the key steps worth noting in this case.
Step 1 - Analysing the Trend:
You have to first analyse the stock trend, i.e., whether there are indications of the initial candle hitting the peak or an uptrend, within which there is temporary consolidation through the small bearish candles and the indications of a final bullish candle.
Step 2 - Identifying the Pattern:
Pattern identification is very important. Keep following the stock and identify whether the fifth and final candle has formed.
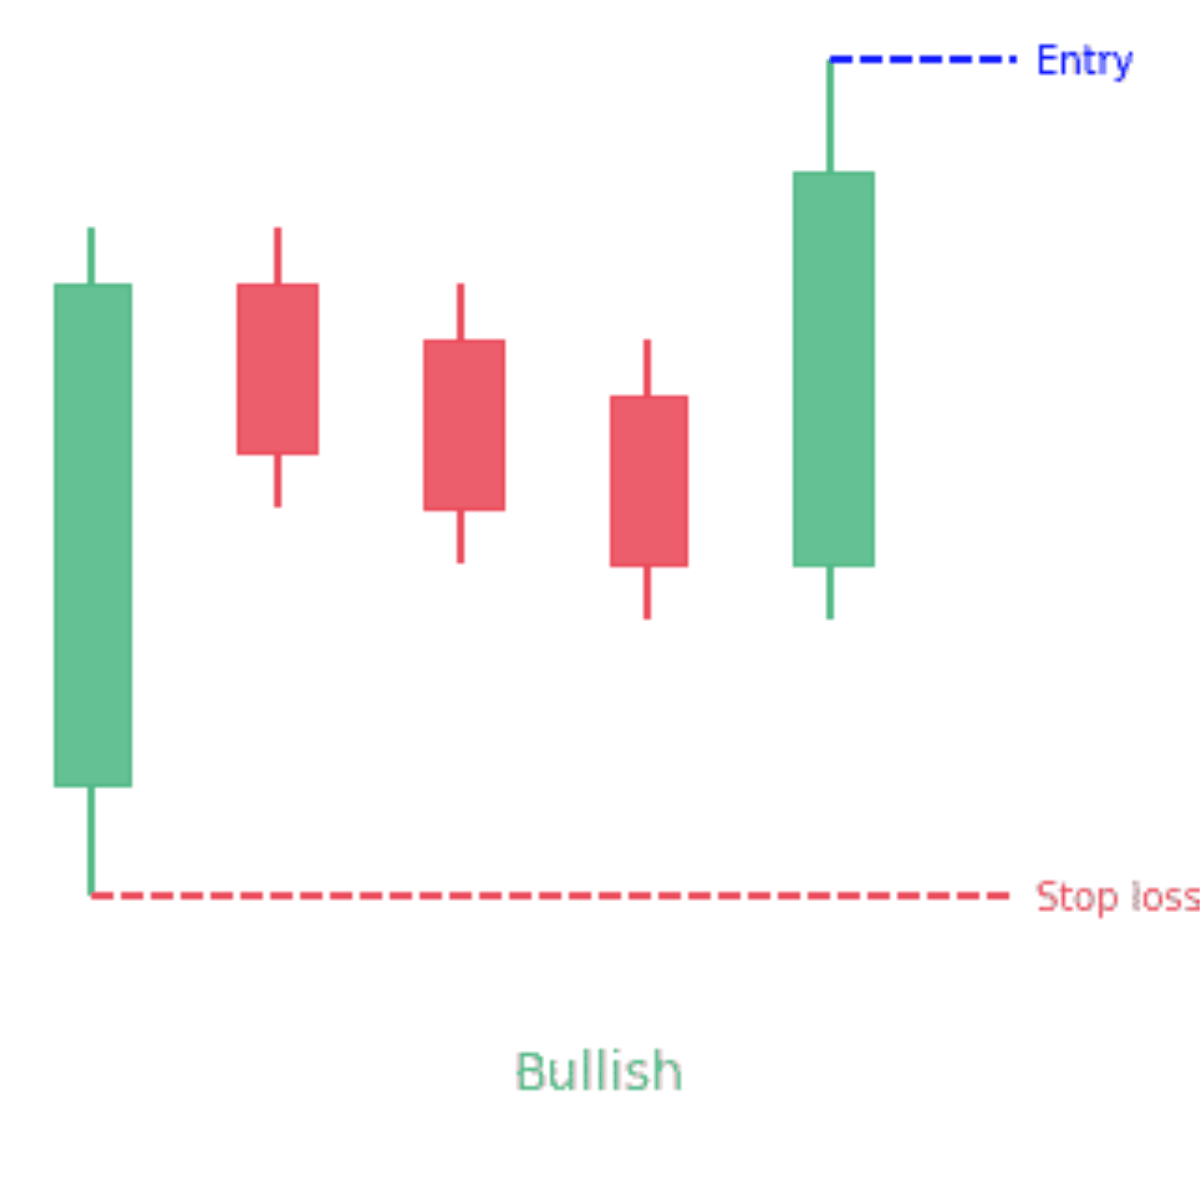
Step 3 - Deciding the Entry Point:
The point of entry matters a lot. You can enter after the closing of the fifth candle since it will indicate the continuation of the bullish trend and further rise of prices. However, the trade entry is also possible once the price movement is above the high of the fifth and final candle. If you have a higher risk tolerance, you may enter prior to the final fifth candle, although you should be ready to exit in case the last one fails to go with the pattern.
Step 4 - Placing a Stop-Loss:
This has to be below the lowest point of consolidation. Place the stop-loss below the fifth candle’s low or the second short candle’s low. You may place it instantly below the first bullish candle in case you wish to give some room to the trade. It boils down to your appetite for risk and the profit potential that you wish to leave for the trade when working out the right stop-loss placement.
Step 5 - Profit Target:
You should target the previous resistance level. Whenever you’re trading the rising three methods candlestick pattern, it’s vital not to identify the same below the key resistance threshold. It ensures that the bullish pattern can not only continue but also sustain itself post the fifth long candle. Also, the pattern is likely to be more successful in case the wicks of the first candle, indicating the period’s low and high prices, are shallow and form over a whole number.
The first and second candles in the pattern may sometimes be marubozu candlesticks, i.e. they may not have shadows/wicks above or below. The opening price of the trading session will be low in this case, while the closing price will be higher in comparison. The fifth candlestick should not break the first candlestick’s low. The high of the fifth should be more than the high of the first one. The fifth one should also have more volume than the first one.
Benefits and Limitations of the Rising Three Methods Candlestick Pattern
Here is a lowdown on the key benefits and limitations of the rising three methods candlestick pattern.
Benefits:
- The pattern’s biggest advantage is that it works as a bullish phase signal that is robust enough. The solid bullish candle, followed by the correction phase and the final bullish candle, indicates the resilience of buyers in the market.
- The pattern can be used in conjunction with several other technical indicators to help traders get better confirmation regarding their trading decisions. It adds to a multilayered approach for more assurance and is a reliable tool for any trader.
- You can use the pattern to gain valuable insights and knowledge about the sentiments prevailing in the market. It indicates that temporary corrections aside, buyers remain resilient and dominant above all else. This market knowledge can be vital in understanding the health of the trend and also for making strategic decisions depending on the present dynamics.
Limitations:
- The pattern is not reliable on its own, although it has moderate accuracy levels. You still have to use it with other technical indicators like moving averages for better decision-making
- There are sometimes false signals that conceal potential trend reversals
- The rising three methods candlestick pattern still depends majorly on the broader context of the market and overall trends, which may be hard to assess properly
- Identification of the pattern by different people may be based on varying criteria, leading to analytical discrepancies
Psychology Behind the Rising Three Methods Candlestick Pattern
It’s not hard to read the psychology behind the rising three methods candlestick pattern. It’s a pullback strategy that’s quite simple whenever any stock sees an increase in value. So, it’s mostly institutional traders or market players taking strategic or vantage positions to ride along with the market trends. On the other hand, it could also be weak hands that exit before the final move if you look at it that way. It all depends on how the investor is positioned.
Mistakes to Avoid While Using Rising Three Methods Pattern
When it comes to trading with the rising three methods candlestick pattern, one may end up committing quite a few errors if not careful. These include:
- Not confirming the volume while trading the pattern would be a big miss. This means that you’ll only depend on the price action resulting from the three candles that form the pattern. It is regarded as a risky move and should be used carefully since it may lead to false or misleading signals and subsequent poor trading decisions. You should thus use volume as the confirmation tool for your trade, along with the pattern evaluation.
- Ignoring the overall strength of the trend - that’s another no-no for trading with this pattern. It is a robust indicator of the trend, which would help you identify the pattern and enter it at the right time.
- Misinterpretation of the individual candlesticks - This is another common error where trades may give more importance to one bearish candle in the correction phase. It may be misinterpreted as a reversal trend despite a healthy correction that is within the uptrend. It will only lead to poor trading decisions on your part.
Conclusion
Now that you’ve got an extensive understanding of the rising three methods candlestick pattern and its key attributes, you can incorporate this knowledge into your trading strategies. What’s the basic takeaway for you in this case? You’ve got to identify the continuing bullish phase or uptrend and not get misled by the temporary corrections within its fold. You can enter strategically after the fifth and final candle signals the price rise while avoiding misinterpretations and false signals along the way.
On that note, here’s to some great trades through the successful identification of this pattern.
Check More Bullish Candlestick Patterns
|
Bullish Pattern |
Features |
|
A reversal pattern which consists of: - A small bearish candle followed by a - Larger bullish candle. |
|
|
A reversal pattern which consists of: - A small body candle, and - Long lower shadow/wick |
|
|
A reversal pattern which consists of: - It starts with a long bearish candle - Followed by a small-bodied candle (either bullish or bearish) - And ends with a long bullish candle. |
|
|
- A strong bearish candle followed by a bullish candle. - Second candle opens below the previous candle's close but closes above the midpoint (50%) of the previous bearish candle. |
|
|
- It is is a two-candlestick pattern that signals a possible upward trend reversal. - Small bullish candle is completely contained within the body of the previous large bearish candle. |
|
|
- It consists of three long bullish candles with small wicks that appear consecutively one after another. - Each new candle opens inside the previous one’s body and closes higher than the last. |
|
|
A reversal pattern which: - Appears at the bottom of a downtrend - A small body with a long upper shadow and little to no lower shadow. |
|
|
A reversal pattern which consists of: - A single candlestick pattern - A very small body and a long lower shadow that appears at the bottom of a downtrend |
|
|
- It consists of a long bearish candle - Followed by a doji candle that gaps down - And then a long bullish candle that gaps up. |
|
|
A three candlestick pattern with: - A large bearish candle, - A small bullish candle that closes above the 50% level of the first candle and - A third bullish candle that closes above the first candle's open. |
|
|
Starts with a bearish candle - Followed by a bullish candle that engulfs the first candle - Ends with another bullish candle that closes higher. |
|
|
- Starts with a long bearish candle - Followed by an even longer bullish candlestick. The candle opens higher than the previous day's closing price and rises even more. |
|
|
A two-candlestick pattern that includes: - Two equal-sized bullish and bearish candles. |
|
|
It is similar to the rising three methods pattern consisting of five candles - It starts with a long bullish candle - Followed by three small bearish candles (a smaller bearish candles that move lower) that stay within the range of the first candle - And end with another long bullish candle that closes above the high of the first candle. |