Single Candlestick Patterns - Doji, Hammer, Marubozu & More
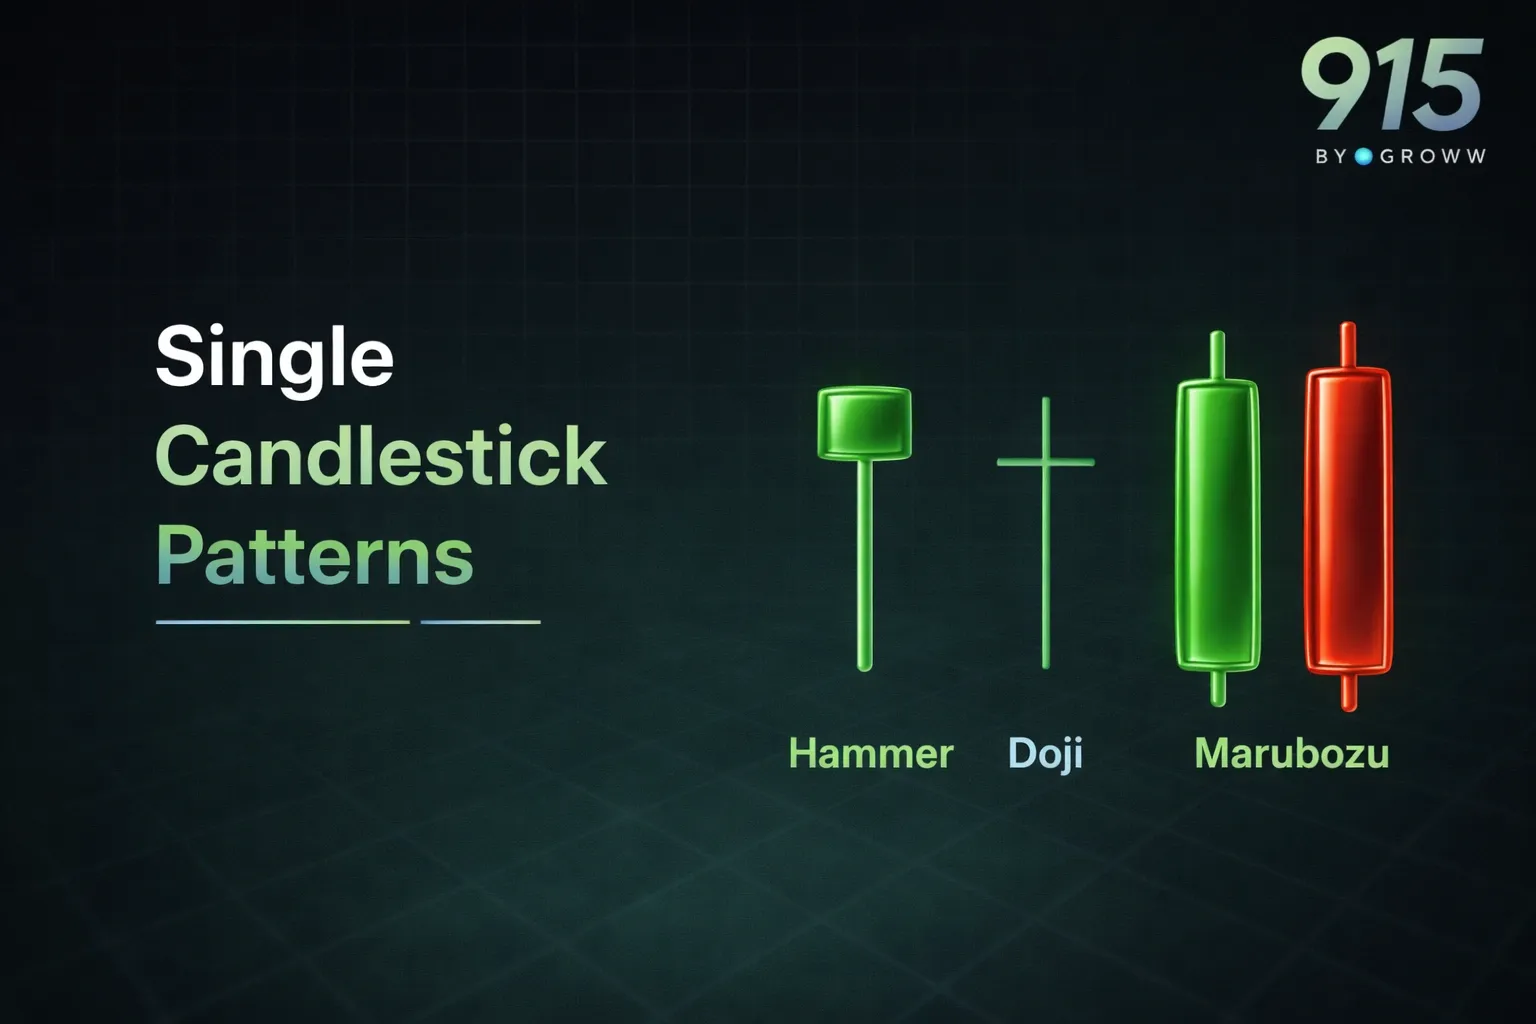
Single candlestick patterns are visual formations created by a single candle, offering valuable insights into potential continuation or reversal of trends. Some examples of such patterns include the Shooting Star, Inverted Hammer, Hammer, Hanging Man, Spinning Top, and more. These are patterns that indicate possible shifts in prevailing market sentiments, including the end of the downtrend (bullish reversal) or even the start of an uptrend (bearish reversal).
You can use these patterns to understand price movements better while identifying signals carefully. This is where intensive candlestick analysis becomes important, where you can focus on understanding the market sentiments better and analysing the patterns created by candlesticks. The size, shape, and colour of the wicks and body may indicate whether the market is bearish, bullish, or even indecisive. Candlesticks may also indicate varying timeframes – from weekly to intraday or even monthly.
Also check : Scalper Mode on 915 | Straddle Chart
Key Single Candlestick Patterns
The following are some major single candlestick patterns:
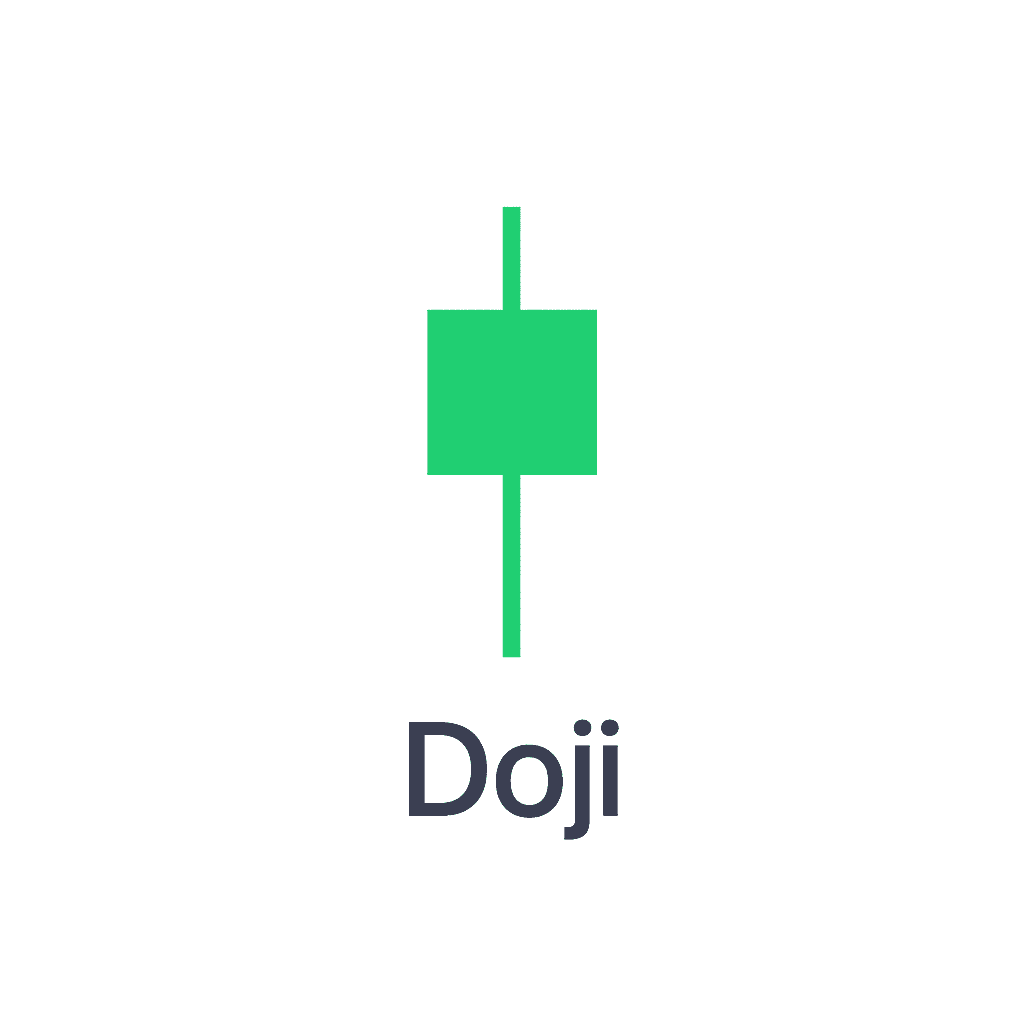
Doji
This is a neutral pattern that has an open price equal to/very close to the close price. This represents an atmosphere of indecision in the market. Gravestone Doji is a pattern that has a long upper shadow and also no/a little lower shadow, mostly viewed as a bearish signal at resistance. On the other hand, Dragonfly Doji has a long lower shadow and a little or no upper shadow. It is often perceived as a bullish signal at support.
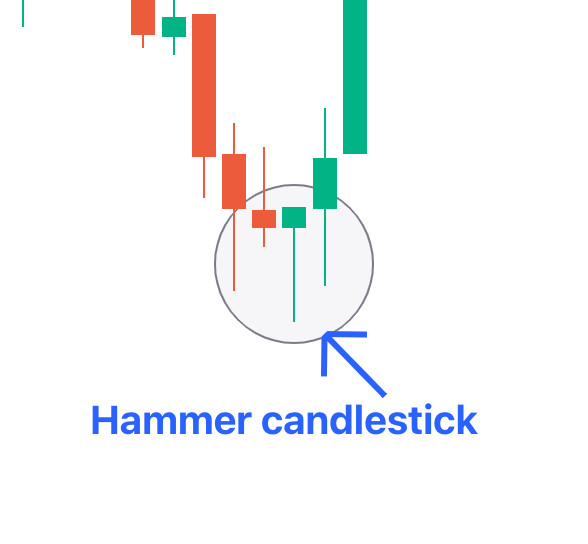
Hammer
Bullish reversal pattern that has a small body and a long lower wick. It often comes at the bottom of the downtrend.
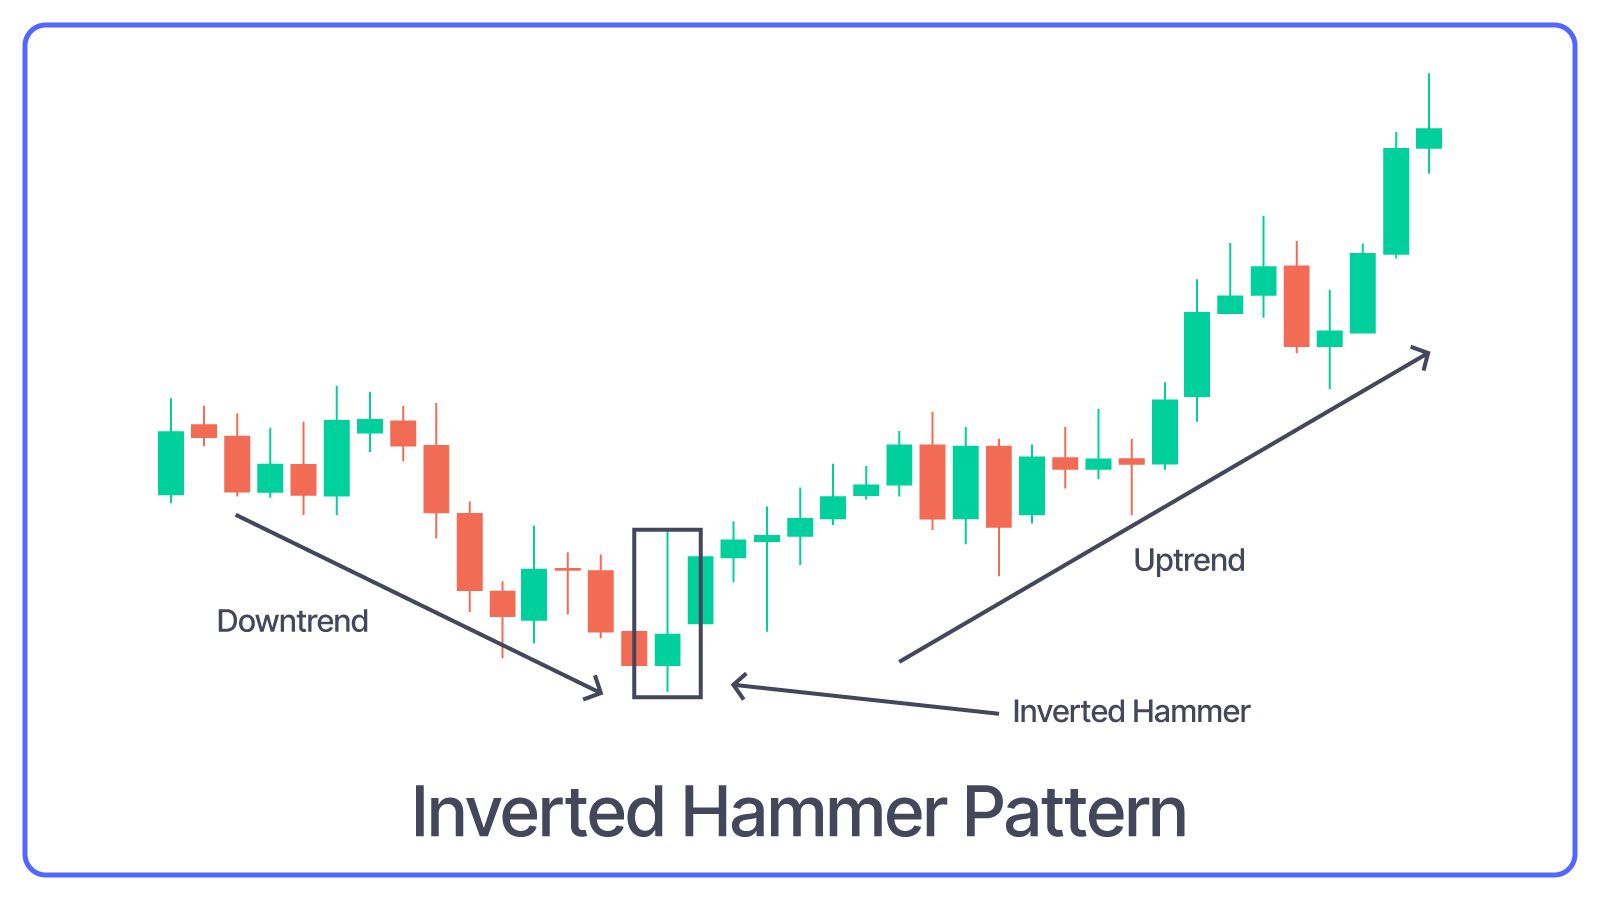
Inverted Hammer
It is a bullish reversal pattern with a long upper wick and small body, just like the Hammer. However, the position is upside-down.
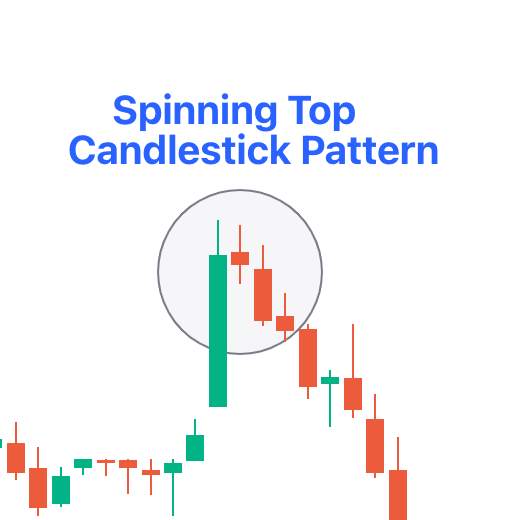
Spinning Top
This is a neutral pattern that has a smaller body and relatively equal lower and upper shadows. It may also indicate indecision in the market.
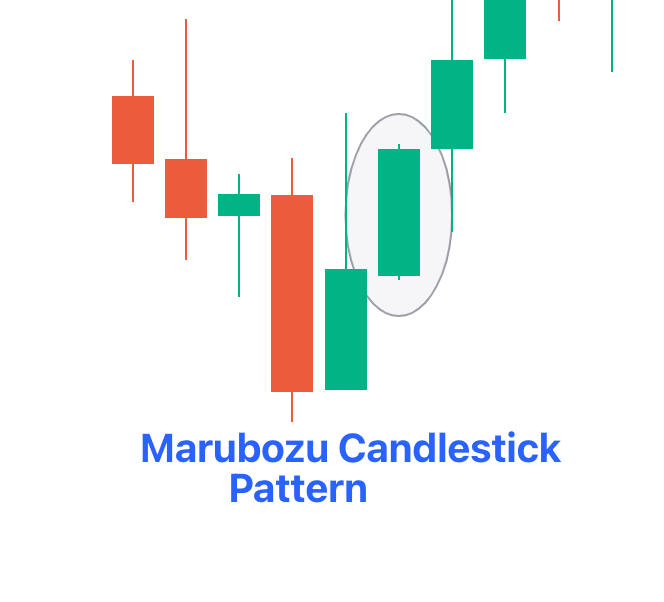
Marubozu
There are no lower or upper shadows in this candlestick pattern. It may be an indicator of strong buying/selling pressure.
Shooting Star
This is a bearish reversal pattern that has a long upper wick and a small body. It mostly comes at the end of an uptrend.
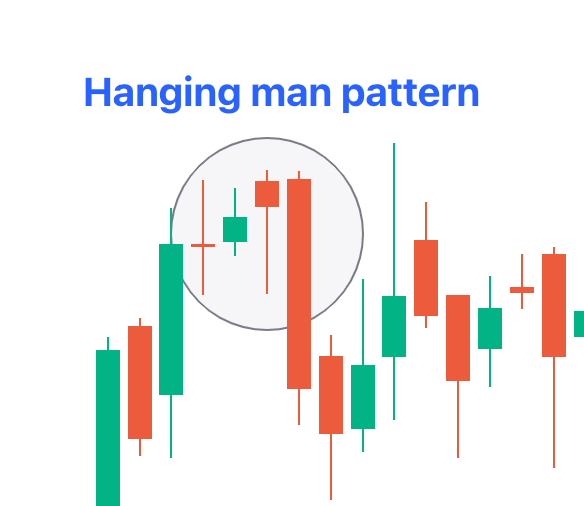
Hanging Man
Bearish reversal pattern that has a long lower wick and small body, often coming at the top of an uptrend.
How to Interpret Them
Here’s how you can correctly interpret single candlestick patterns:
- Evaluate these patterns within the context of the overall trend and the earlier candlesticks.
- Before taking a trading decision, confirm the pattern through helpful technical indicators.
- The length of the candle wicks and body can help you gain insights into the buying/selling strength in the market.
- Avoid trading muted short candles with little/no shadows. They may indicate more subdued trading in the market.
- Always look at the size and colour of the wicks’ bodies. A large green (bullish) body indicates strong buying pressure, and a large red (bearish) body indicates strong selling pressure.
- Long upper wicks are indicators of price rejections at higher levels, while long lower wicks are indicators of stronger rebounds from lower prices.
- The candlestick position within the trend is vital for interpretation. For instance, an inverted hammer after the downtrend is a more indicative signal than one that appears in any sideways market.
- Volume spikes during the single candle pattern formation may confirm a stronger sentiment change.
- The shadow-to-real body ratio is also essential, where the length of the wicks relative to the body may give you insights into the intensity of the selling or buying pressure.
Use in Entry and Exit Decisions
Here’s how you can use your understanding of this pattern to make entry and exit decisions.
- Some patterns, like the Hammer or Doji, may indicate a potential market trend shift, especially showing a change from a downtrend to an uptrend or vice versa.
- The Doji pattern may reveal indecision in the market, making it useful for evaluating the present market scenario and anticipating a reversal in trend.
- The Marubozu patterns indicate strong market entry/exit pressure, thereby indicating the potential reversal/continuation of the trend.
- Understand the market context and use technical analysis to confirm the pattern. The timeframe choice (daily or hourly) may also affect the reliability of the pattern.
Limitations and Confirmation Techniques
Here are some limitations of this pattern:
- The pattern may generate false signals at times, i.e., reversals that do not take place and lead to major losses.
- The exact size/shape of the candlestick is open to interpretation. Hence, traders may interpret it differently and witness misleading signals.
- Volatile/rapid markets may also invalidate the signal of the single candlestick pattern. It may not give you the whole picture regarding market trends or sentiments.
- You should confirm the pattern with other patterns/indicators for greater reliability for making trading decisions.
Confirmation techniques for single candlestick patterns include:
- Look for confirmation from the patterns in the earlier days. In case the earlier day’s pattern is a hammer and the following day confirms the reversal, then such confirmation will boost your confidence in decision-making.
- Combine single candlestick pattern readings with other momentum indicators like MACD/RSI. This will help you evaluate whether the market is oversold/overbought, enabling higher context for the single candlestick.
- Undertake thorough volume analysis where higher volume during a single candlestick pattern may boost the signal.
- Always identify major support and resistance levels on the chart. Consider any fundamental event/news that may be affecting the market.
- Don’t neglect the overall market trend. A single candlestick pattern that appears in the trend direction is expected to be valid in comparison to one that goes against the same.