What is a Harami Candlestick Pattern?
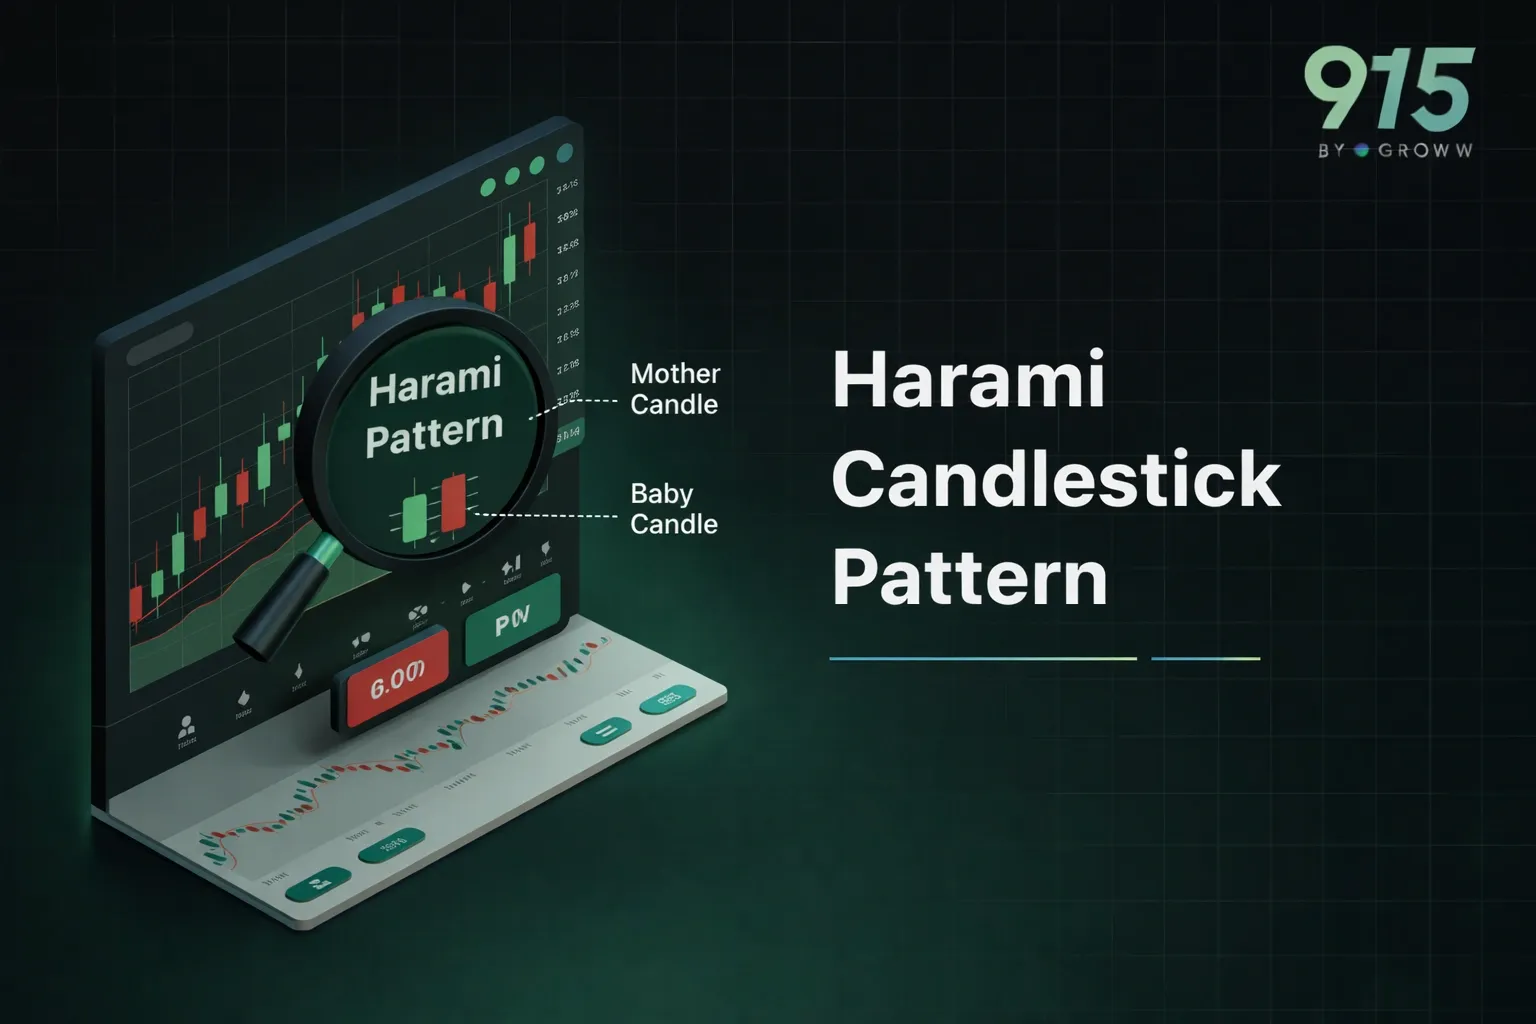
The Harami candlestick pattern is a Japanese candlestick formation indicated by two bodies. The pattern indicates a change in trends or a potential reversal of prices. It can be bearish or bullish, based on the direction of the price action in this case. Let’s learn more about it below.
Harami Pattern- Meaning & Key Traits
Here is all you need to know about the Harami pattern:
- The name of the pattern comes from the Japanese word Harami meaning pregnant, since the formation usually resembles a pregnant woman’s shape.
- The pattern indicates changing trends or potential price reversals. It can be either bearish or bullish, depending on the direction of the price movement.
- The key defining factor is the appearance of the small candle which is enclosed within the body of the earlier big candle. Each pattern has two candlesticks occurring on two successive days.
Also check : Scalper Mode on 915 | Straddle Chart
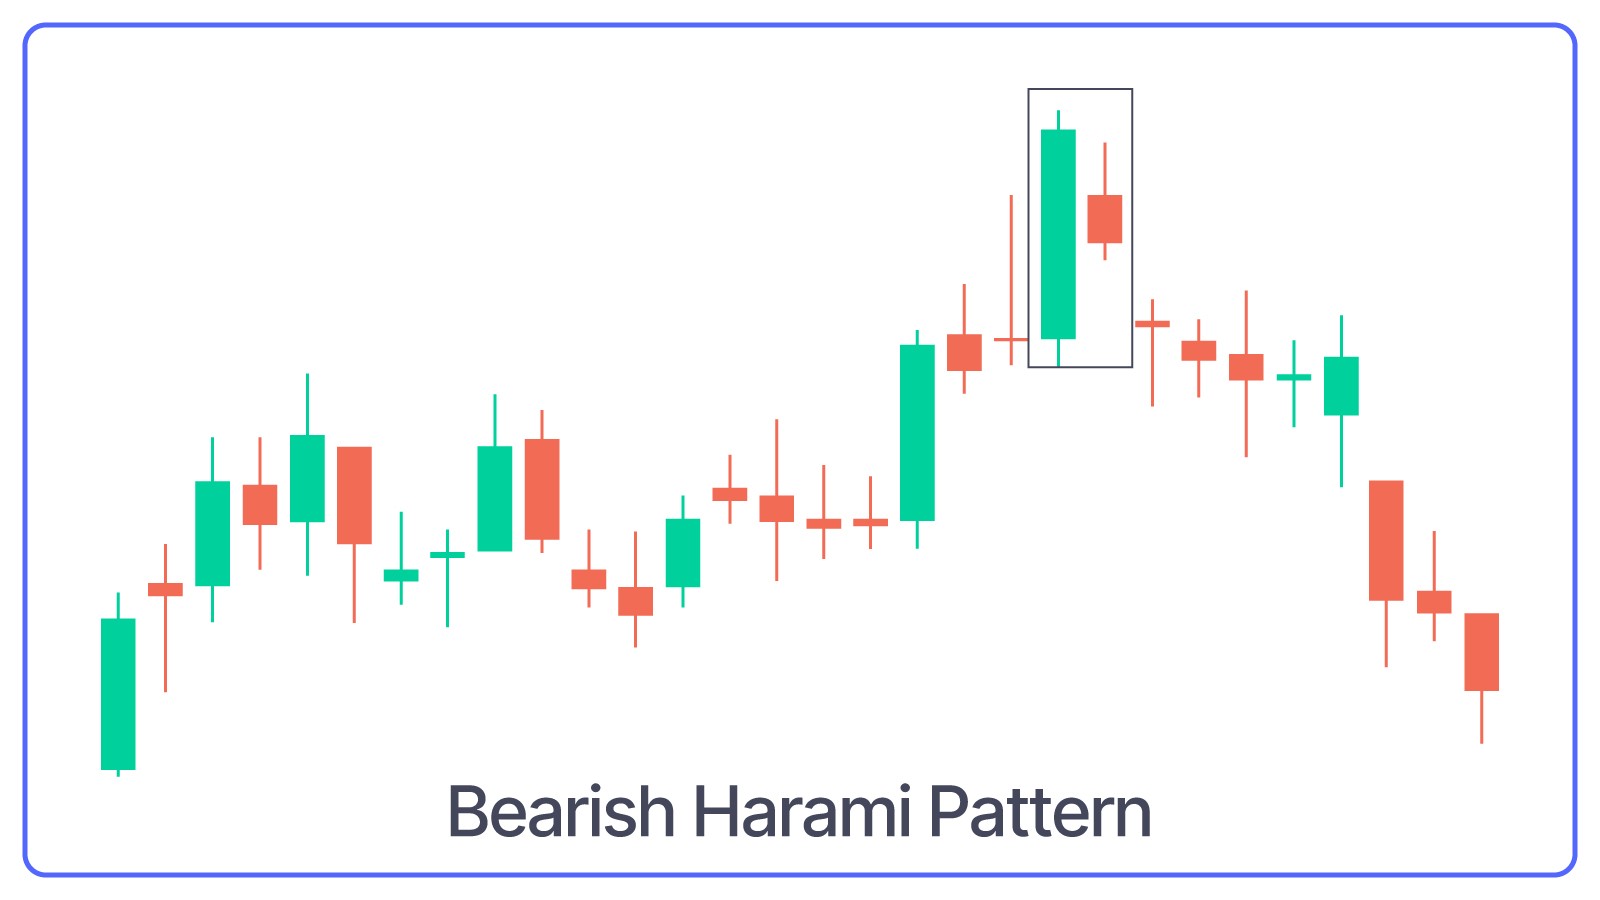
- A Bearish Harami pattern takes place at the very top of the uptrend whenever there is a big bullish green candle on the first day, followed by a smaller bullish or bearish candle on the second day. The key thing here is that prices came down on the second day and could not shift back upwards to the day one closing. It indicates possible uncertainty in the market.
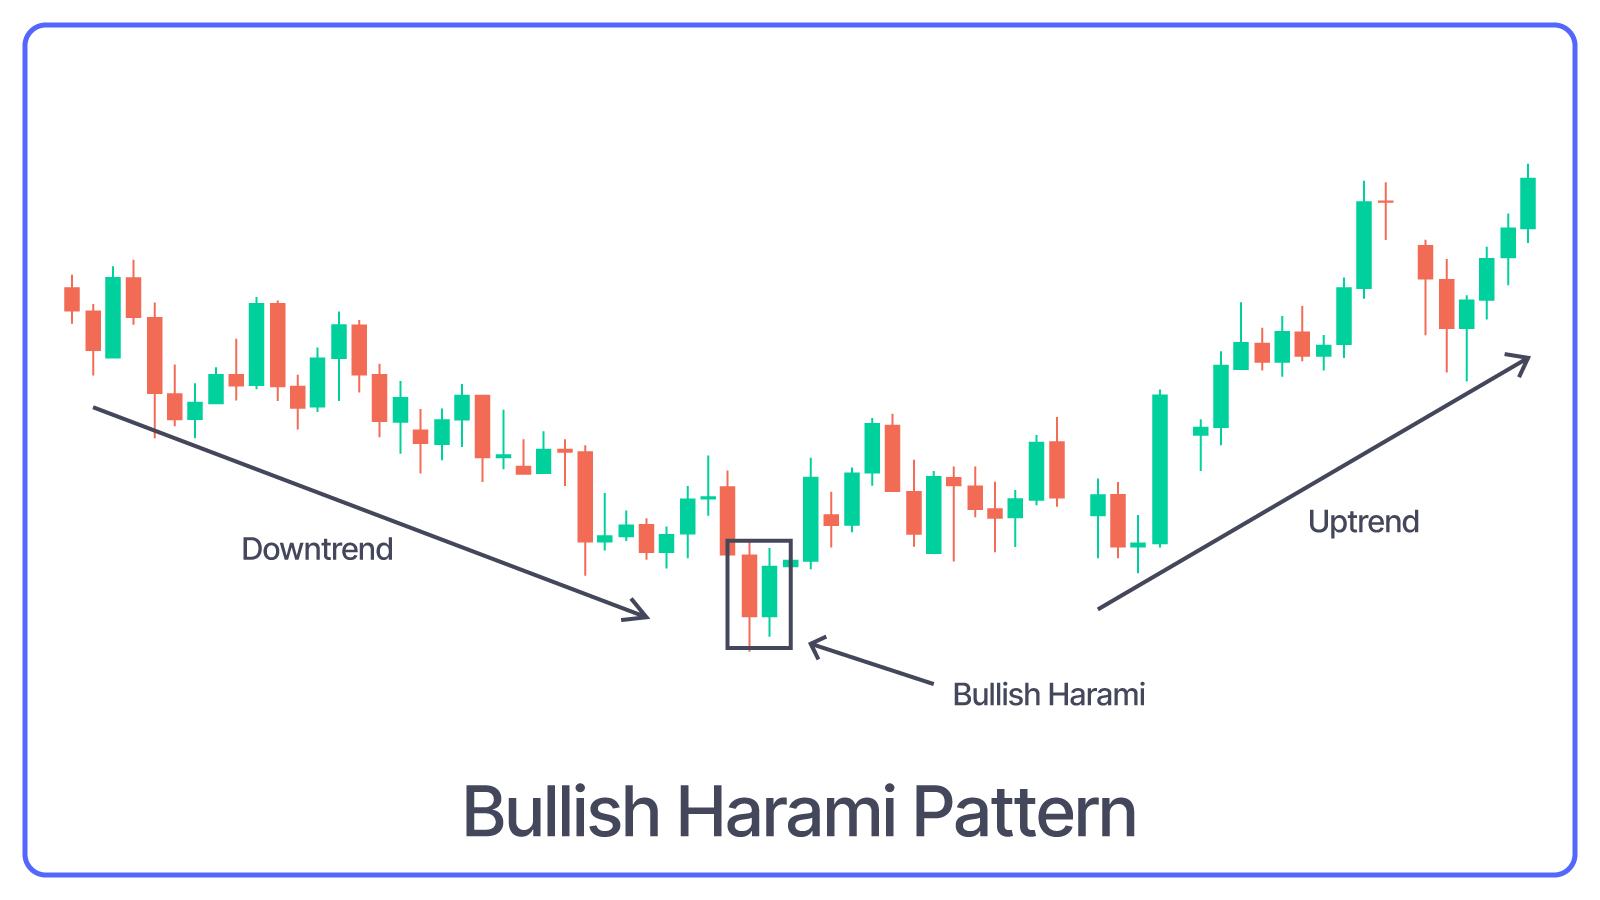
- A Bullish Pattern is at the very bottom of the downtrend, when there is a big bearish red candle on the first day, followed by a smaller bullish or bearish candle on the second day. The core element here is that prices went up on the second day and got held up, while being unable to shift lower back to the bearish close of the first day.
- Another potential pattern is the Hidden Harami which takes place whenever the second candle closes a little outside the first candle’s body, but within its overall range. You should also watch out for the belt hold Harami where the second candle is fully engulfed by the real body of the first candle, indicating the trade signal clearly. A rare one is the Harami cross, where the second candle fully crosses over the first one, thereby indicating a robust potential reversal.
- So, key traits include two consecutive candlesticks, i.e. a typically long first candle, which indicates robust short or long pressure and a second smaller candle, which is fully engulfed in the body of the first one. The colour of the second candle is mostly opposite to the first one, indicating a potential market sentiment change.
Also here is a blog on How to Read Candlestick Patterns.
How to Confirm a Harami Pattern
You’ll know that confirming or properly identifying a Harami pattern is essential in order to plan your trades accordingly. Here are some aspects worth noting in this regard.
- You can use the Relative Strength Index (RSI) or Stochastic indicators for confirming any such pattern formation. StochRSI, for instance, is a momentum oscillator that you can use to identify oversold or overbought scenarios. It is based on the RSI with more sensitive and finer signals for confirming the bullish Harami formation. The Stochastic RSI usually oscillates between 0 and 1, with readings higher than 0.8 taken as overbought and those below 0.2 taken as oversold.
- Checking volume changes is also vital, since higher trading volumes on the day of the completion of the pattern may indicate additional confirmation of any changes in trends.
- For bearish Harami pattern confirmation, look for the strong uptrend and a long green candlestick, followed by a smaller red candlestick engulfed by the first one’s body. It will signal a bearish reversal and the opening and closing price of the second one will be within the first candle’s body.
- For bullish Harami pattern confirmation, look for the robust downtrend first, along with the first long bearish candlestick in either black or red. Then, there will be a small green or white bullish candlestick within the first one’s body. The closing and opening of the second candle should be within the first candle’s body.
Trading Strategy Based on the Harami Pattern
Trading based on your knowledge of the Harami pattern requires careful strategizing and decision-making. Here are the steps worth following in this case.
Step 1- Identify the Trend:
The first step is carefully identifying the trend. The bullish pattern will appear during the downtrend and the bearish one during a strong uptrend. Your goal should be to buy after the confirmation candle breaks above the high in a bullish setup or to sell when the price breaks below the low of the small candle in a bearish setup.
Step 2- Using Technical Indicators for Confirmation:
You can analyze the volumes once the pattern forms. A lowering volume indicates a weakening bearish movement while increasing volumes indicate weakening bullish trends. You may use RSI or MACD to confirm the same.
Step 3- Enter Your Position:
It is now time to enter the trade and you can take up a short position once the price breaks below the low point of the second candlestick. Alternatively, you can take a long position as the price breaks above the high point of the second candlestick.
Step 4- Set Your Stop-Loss:
Set the stop-loss level carefully while trading. For the bullish Harami pattern, put the stop-loss right below the low of the first bearish candlestick. You can put the stop-loss above the high of the first bullish candle for the bearish version of the pattern.
Step 5- Take Profit:
You can set your take-profit levels depending on the ratio of risks to rewards. It will be placed below the support level or entry point during the bullish pattern formation and vice versa.
You should also keep tracking the market movements continuously for any volume, price, or other changes. Remember that the Harami pattern is not fully reliable on its own and you should use other technical tools or confirmation. Always watch out for trend exhaustion signs like decreasing indicators of momentum or long wicks and integrate moving averages into your analysis for confirming pattern validity. The relative candle size in the pattern may also offer valuable hints.
Benefits and Limitations of the Harami Pattern
The Harami pattern has its own set of limitations and advantages that you should know more about.
Benefits:
- The pattern indicates a potential reversal in trends and traders can often get comparatively low-risk entry price points than entering trades at the peak of any moving trend.
- One can combine the pattern with Fibonacci extension or retracement levels for identifying potential gain targets or reversal zones, thereby enabling higher accuracy for trading.
- These patterns are dynamic and can be applied throughout multiple kinds of currency pairs and even other asset classes like CFDs, equities, etc. You can thus leverage their insights to trade in various asset classes across different timeframes and markets.
- You may find these patterns forming just before the release of major economic updates, news, and other developments, indicating a potential market sentiment change. This will help those who are into Forex trading, where news and related events often lead to sudden price movements.
Limitations:
- The pattern is not reliable on its own and you should use it with other technical tools like moving averages and RSI for better decision-making.
- Volume analysis is required to understand the market sentiment change fully.
- These patterns may generate false signals and may lead to wrong decisions.
- You have to depend on the market context while leveraging these patterns, while they are also perceived as short-term signals that may not offer sustained long-term trends.
Common Errors to Avoid with the Harami Pattern
You should not end up making some common mistakes while trading based on your understanding of the Harami pattern. Here are the errors you need to avoid.
Going ahead with trades in low-volume markets -
Don’t make the mistake of leveraging the Harami pattern to trade in a low-volume market. It can be less accurate and reliable due to the chance of erratic movements in prices. Ensure there’s sufficient volume to confirm whether the pattern is valid.
Not using other technical indicators -
This is the biggest mistake that you can make, i.e. relying only on the formation of the pattern. You should combine the pattern with other technical indicators and use stop-loss orders to limit possible losses.
Not watching out for false signals within strong trends -
At times, the pattern may appear within a strong downtrend or uptrend. It could be a false signal that hints at a trend reversal and you should watch out for the same.
Ignoring the market context -
You should thoroughly evaluate the market context and trends before going ahead with the trade.
Not placing your stop-loss order properly -
Avoid issues with price fluctuations by putting the stop-loss order at a certain level, which gives your trade ample room for movement. In this case, it should not be too close to the point of entry.
Final Thoughts
The Harami pattern is one of the most versatile and dynamic candlestick patterns that you will come across. However, you have to watch out for the bullish/bearish formation and the strong trend reversal indicator before trading. The key aspect here is to confirm the pattern carefully before moving ahead, since it is highly susceptible to false signals.
Check Other Bullish Patterns
|
Bullish Pattern |
Features |
|
A reversal pattern which consists of: - A small bearish candle followed by a - Larger bullish candle. |
|
|
A reversal pattern which consists of: - A small body candle, and - Long lower shadow/wick |
|
|
A reversal pattern which consists of: - It starts with a long bearish candle - Followed by a small-bodied candle (either bullish or bearish) - And ends with a long bullish candle. |
|
|
- A strong bearish candle followed by a bullish candle. - Second candle opens below the previous candle's close but closes above the midpoint (50%) of the previous bearish candle. |
|
|
- It consists of three long bullish candles with small wicks that appear consecutively one after another. - Each new candle opens inside the previous one’s body and closes higher than the last. |
|
|
A reversal pattern which: - Appears at the bottom of a downtrend - A small body with a long upper shadow and little to no lower shadow. |
|
|
A reversal pattern which consists of: - A single candlestick pattern - A very small body and a long lower shadow that appears at the bottom of a downtrend |
|
|
- It consists of a long bearish candle - Followed by a doji candle that gaps down - And then a long bullish candle that gaps up. |
|
|
A three candlestick pattern with: - A large bearish candle, - A small bullish candle that closes above the 50% level of the first candle and - A third bullish candle that closes above the first candle's open. |
|
|
Starts with a bearish candle - Followed by a bullish candle that engulfs the first candle - Ends with another bullish candle that closes higher. |
|
|
- Starts with a long bearish candle - Followed by an even longer bullish candlestick. The candle opens higher than the previous day's closing price and rises even more. |
|
|
A two-candlestick pattern that includes: - Two equal-sized bullish and bearish candles. |
|
|
It consists of five candles in a continuation pattern - A long bullish candle - Three small bearish candles that trade above the low and below the high of the first candlestick - And another long bullish candle that closes above the high of the first candlestick. |
|
|
It is similar to the rising three methods pattern consisting of five candles - It starts with a long bullish candle - Followed by three small bearish candles (a smaller bearish candles that move lower) that stay within the range of the first candle - And end with another long bullish candle that closes above the high of the first candle. |
Check More Bearish Chart Patterns
|
Bearish Pattern |
Features |
|
It forms when a small bullish candle is followed by a large bearish candle that completely engulfs the previous green candle |
|
|
It is formed when three consecutive long-red candles with small wicks are visible |
|
|
It appears at the top of the uptrend as a single candle with a small body and a long lower shadow |
|
|
It is a three-candlestick pattern that - Starts with a long bullish candle - Followed by a small-bodied candle that gaps up - And ends with a long bearish candle that closes well into the body of the first candle |
|
|
It is a reversal strategy which: - Is a single candlestick pattern with a small body, a long upper shadow, and little to no lower shadow |
|
|
It is a two-candlestick pattern that: - Starts with a long bullish candle followed by a Doji (a candle with a very small body) |
|
|
- It consists of two or more candles with matching highs and appears at the top of an uptrend. - The first candle is usually bullish - And the second candle is bearish |
|
|
- It starts with a long bullish candle - Followed by a long bearish candle that opens below the previous candle’s opening price and closes lower |
|
|
It is a three-candlestick pattern that: - Starts with a bullish candle - Followed by a smaller bearish candle that is completely within the first candle - And ends with another bearish candle that closes lower |
|
|
It is a three-candlestick pattern that - Starts with a bullish candle - Followed by a bearish candle that engulfs the first candle - And ends with another bearish candle that closes lower |
|
|
it is a five-candlestick pattern that: - Starts with a long bearish candle - Followed by three smaller bullish candles that stay within the range of the first candle - And ends with another long bearish candle that closes below the first candle |
|
|
It forms a long green candle followed by a red candle that opens above the previous high but closes below the midpoint of the green candle. |
|
|
It is a three-candlestick pattern that - Starts with a long bullish candle - Followed by a Doji that gaps up from the previous candle - And ends with a long bearish candle that gaps down from the Doji. |