38 Candlestick Patterns Every Trader Should Know
While doing Technical analysis, candlestick patterns are used by traders to predict future price movements based on historical price data. Each candlestick provides a visual summary of the stock’s price action, displaying the opening, closing, high, and low prices.
In this blog, we’ll cover the most popular candlestick patterns that every trader must know.
Bullish Candlestick Patterns
Bullish candlestick patterns signal potential reversals in downtrends and indicate a shift towards upward price movements.
Bullish Engulfing Pattern
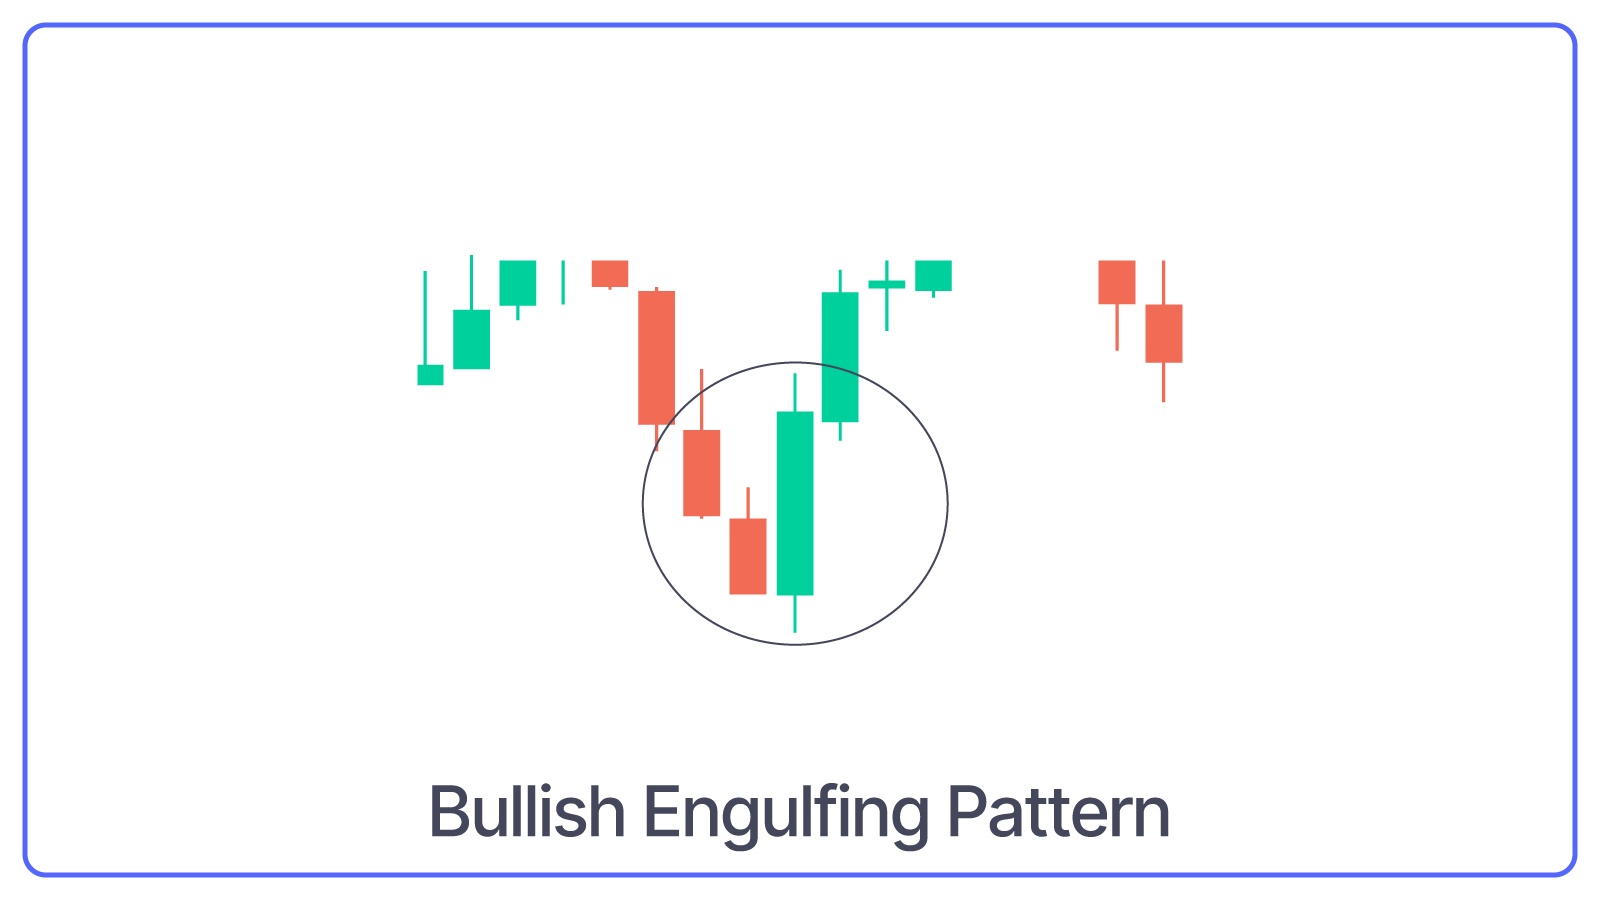
The Bullish Engulfing Pattern consists of two candles:
- A small bearish candle followed by a
- Larger bullish candle.
What Bullish Engulfing Pattern Indicates: The body of the bullish candle completely engulfs the body of the bearish candle, indicating strong buying strength.
Also here is a blog on How to Read Candlestick Patterns.
Hammer Pattern
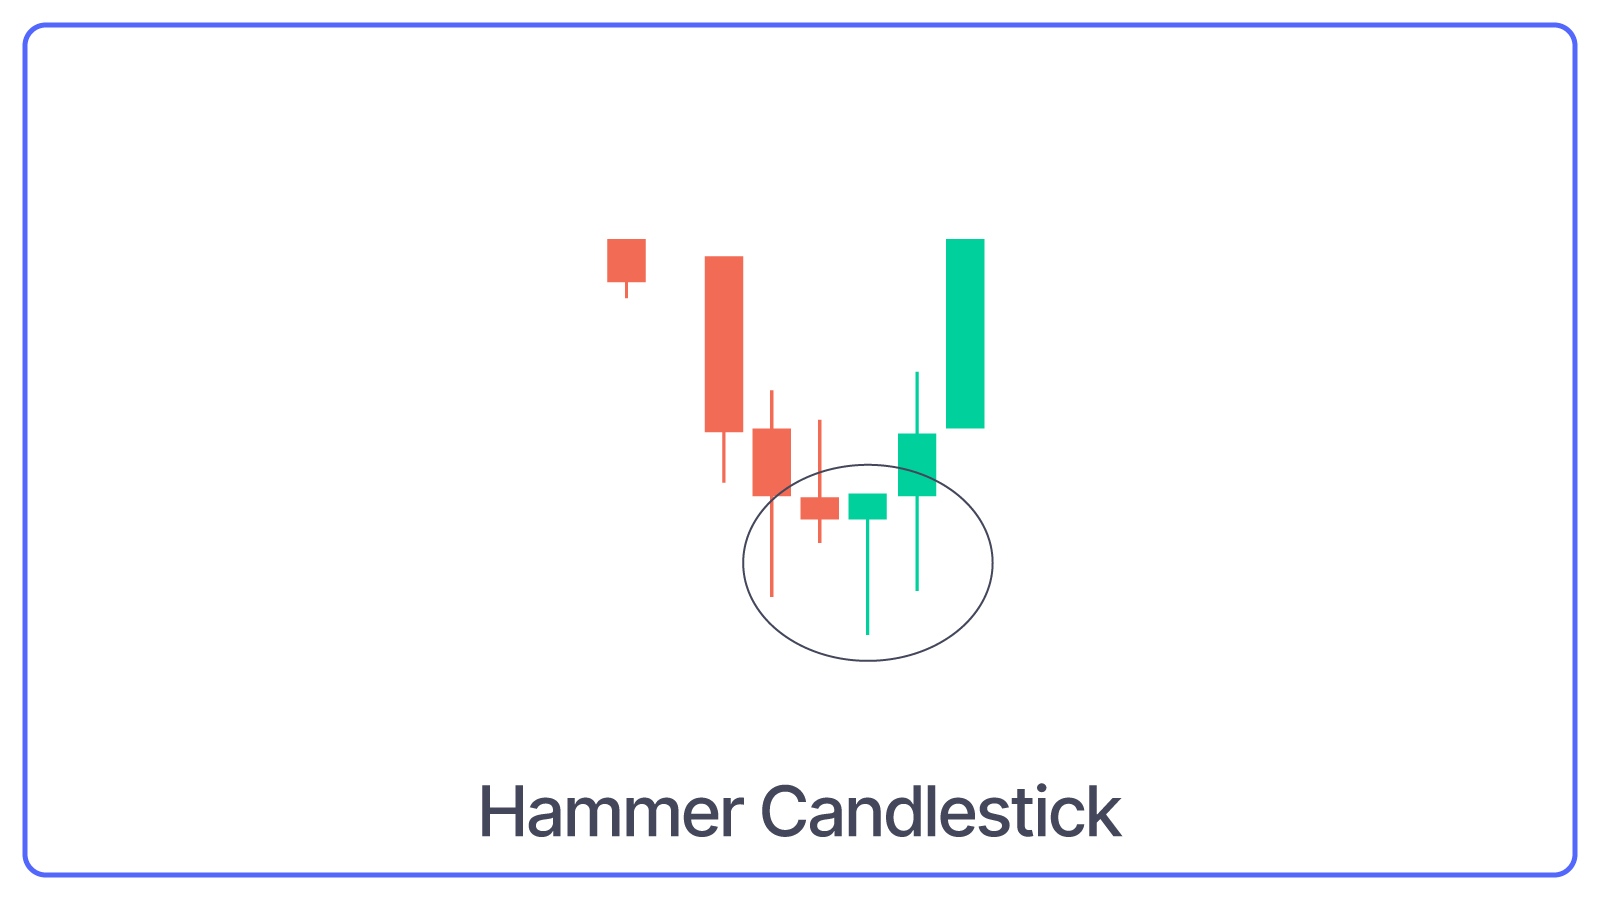
Hammer is a single candlestick pattern with
- A small body candle, and
- Long lower shadow/wick
What Hammer Pattern Indicates: Whenever the chart is in a downtrend, and a Hammer candlestick is made, it indicates that the share price might go up because the buyers have become more dominant or active.
Also Read: Multi-Candle Patterns for option trading.
Morning Star Pattern
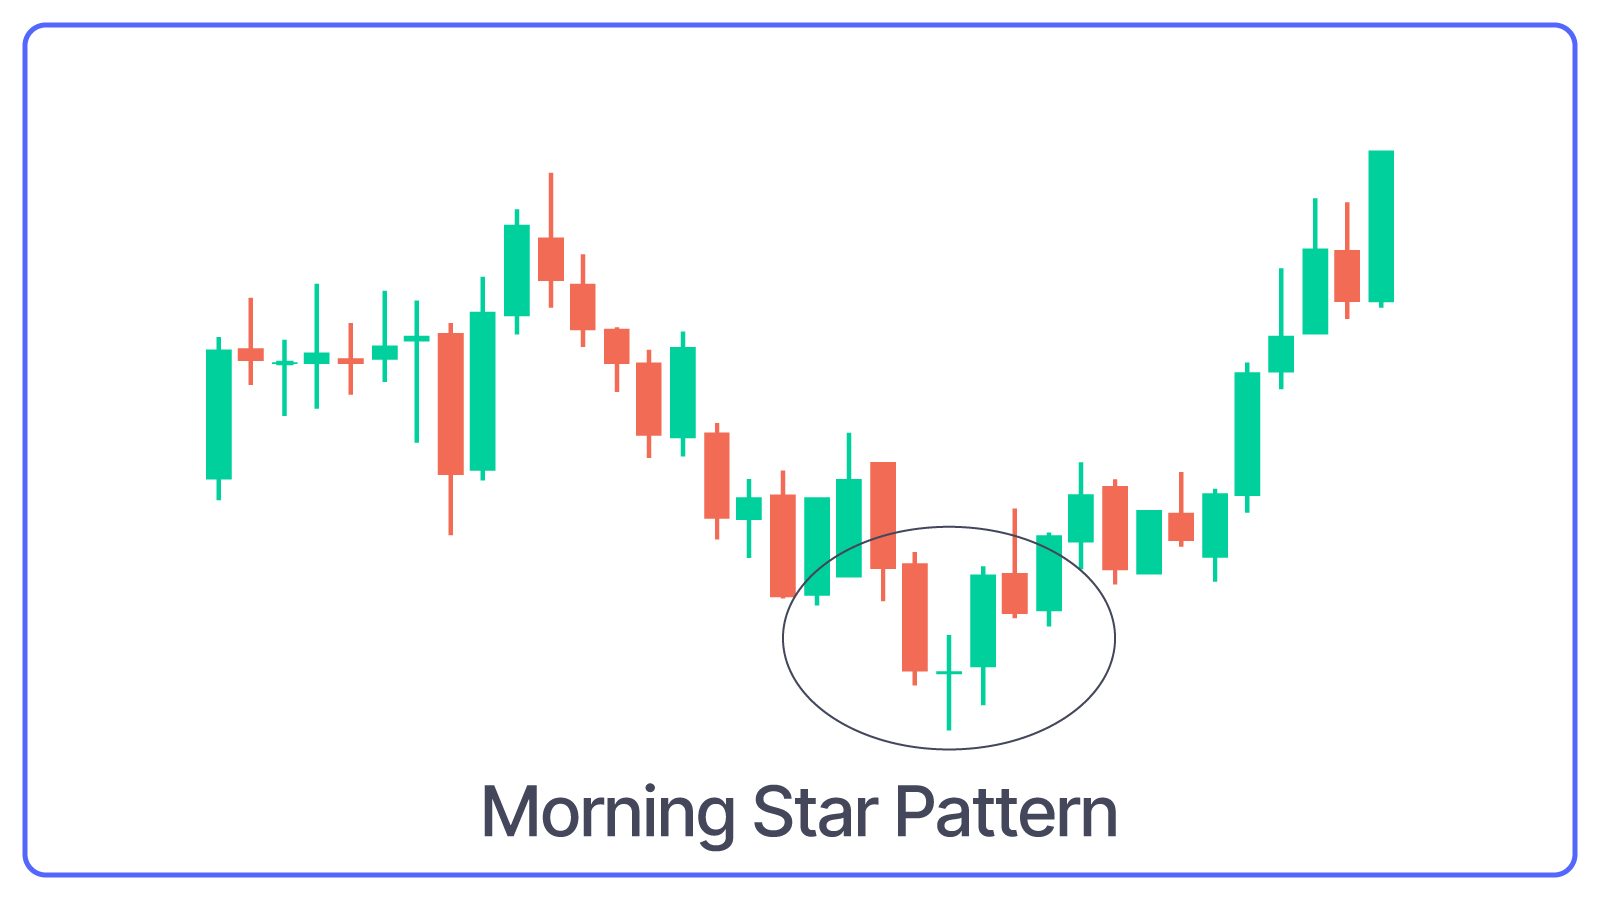
The Morning Star is a three-candlestick pattern that converts downtrend to uptrend. It starts with a long bearish candle, followed by a small-bodied candle (either bullish or bearish) and ends with a long bullish candle.
What Morning Star Pattern Indicates: This pattern signifies a strong reversal signal, as it shows that the sellers are losing control and the buyers are taking over.
Piercing Line Pattern
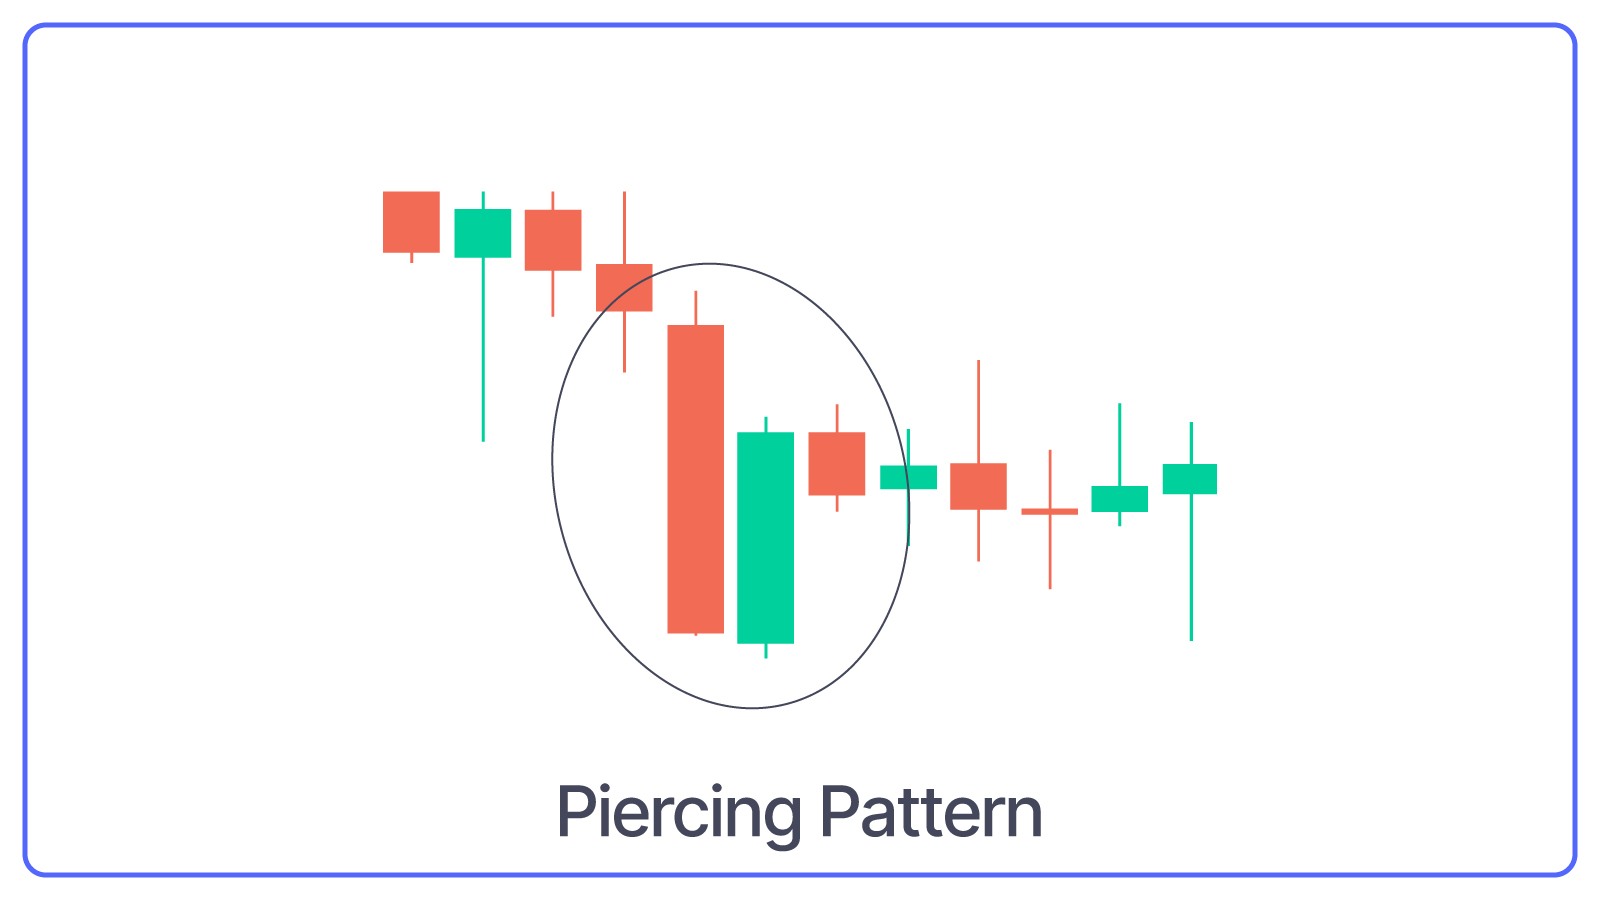
The Piercing Line is a two-candlestick pattern that begins with a strong bearish candle followed by a bullish candle. The second candle opens below the previous candle's close but closes above the midpoint (50%) of the previous bearish candle.
What Piercing Line Pattern Indicates: This pattern indicates a Bullish reversal signal, which means buyers are stepping in and reversing the downtrend.
Bullish Harami Pattern
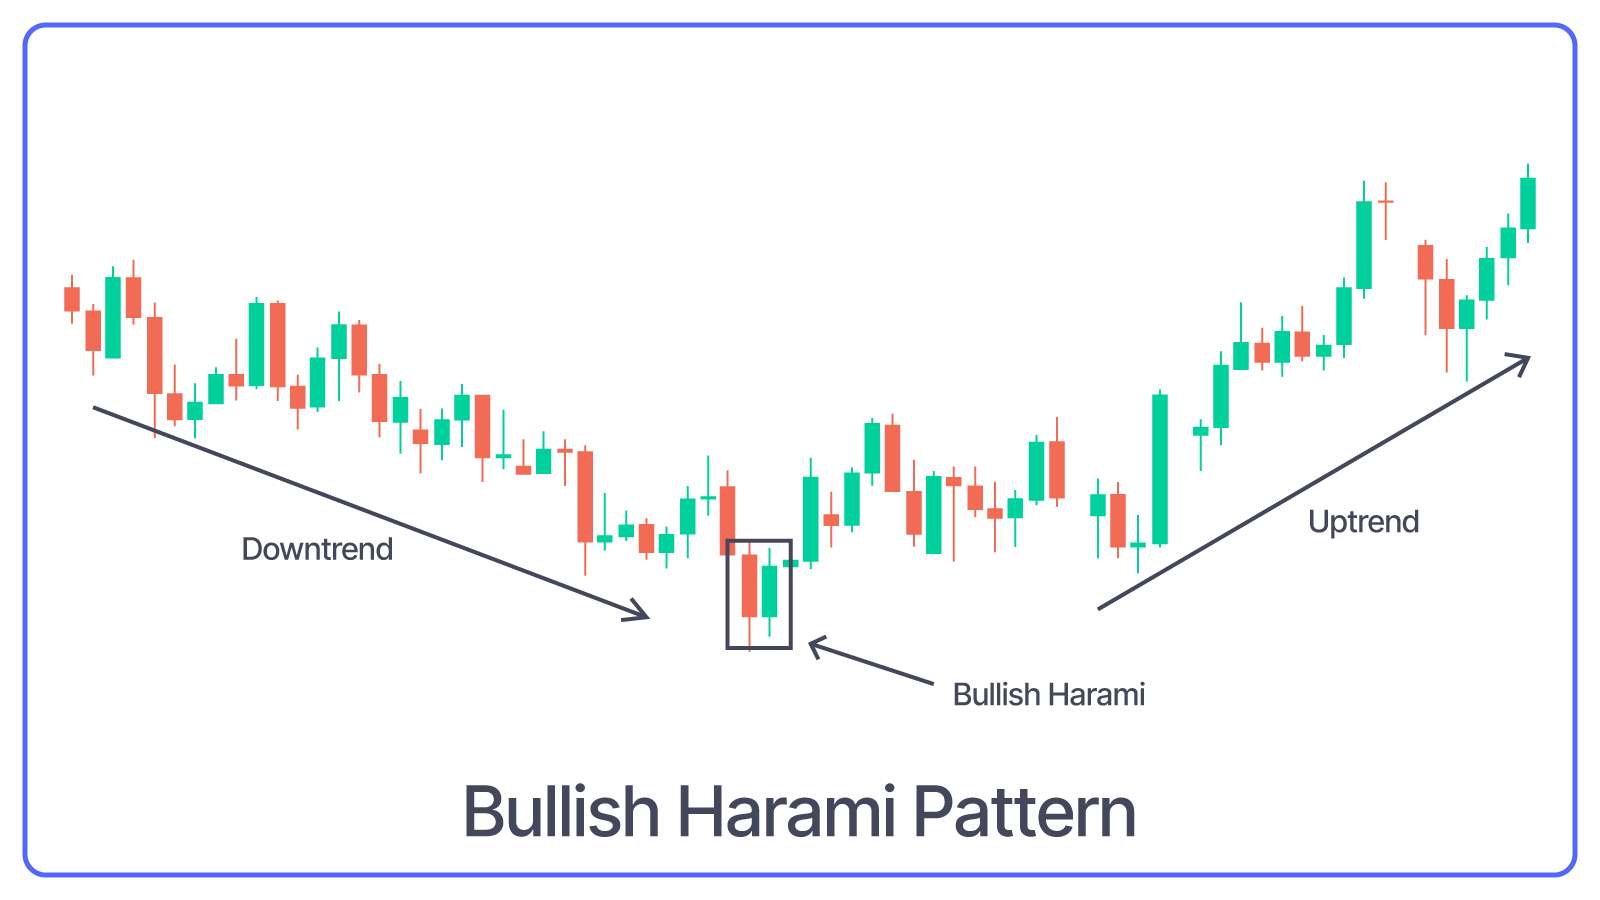
The Bullish Harami is a two-candlestick pattern that signals a possible upward trend reversal. Here, a small bullish candle is completely contained within the body of the previous large bearish candle.
What Bullish Harami Pattern Indicates: This pattern suggests a decrease in selling pressure and the possibility of a bullish reversal.
Three White Soldiers Pattern
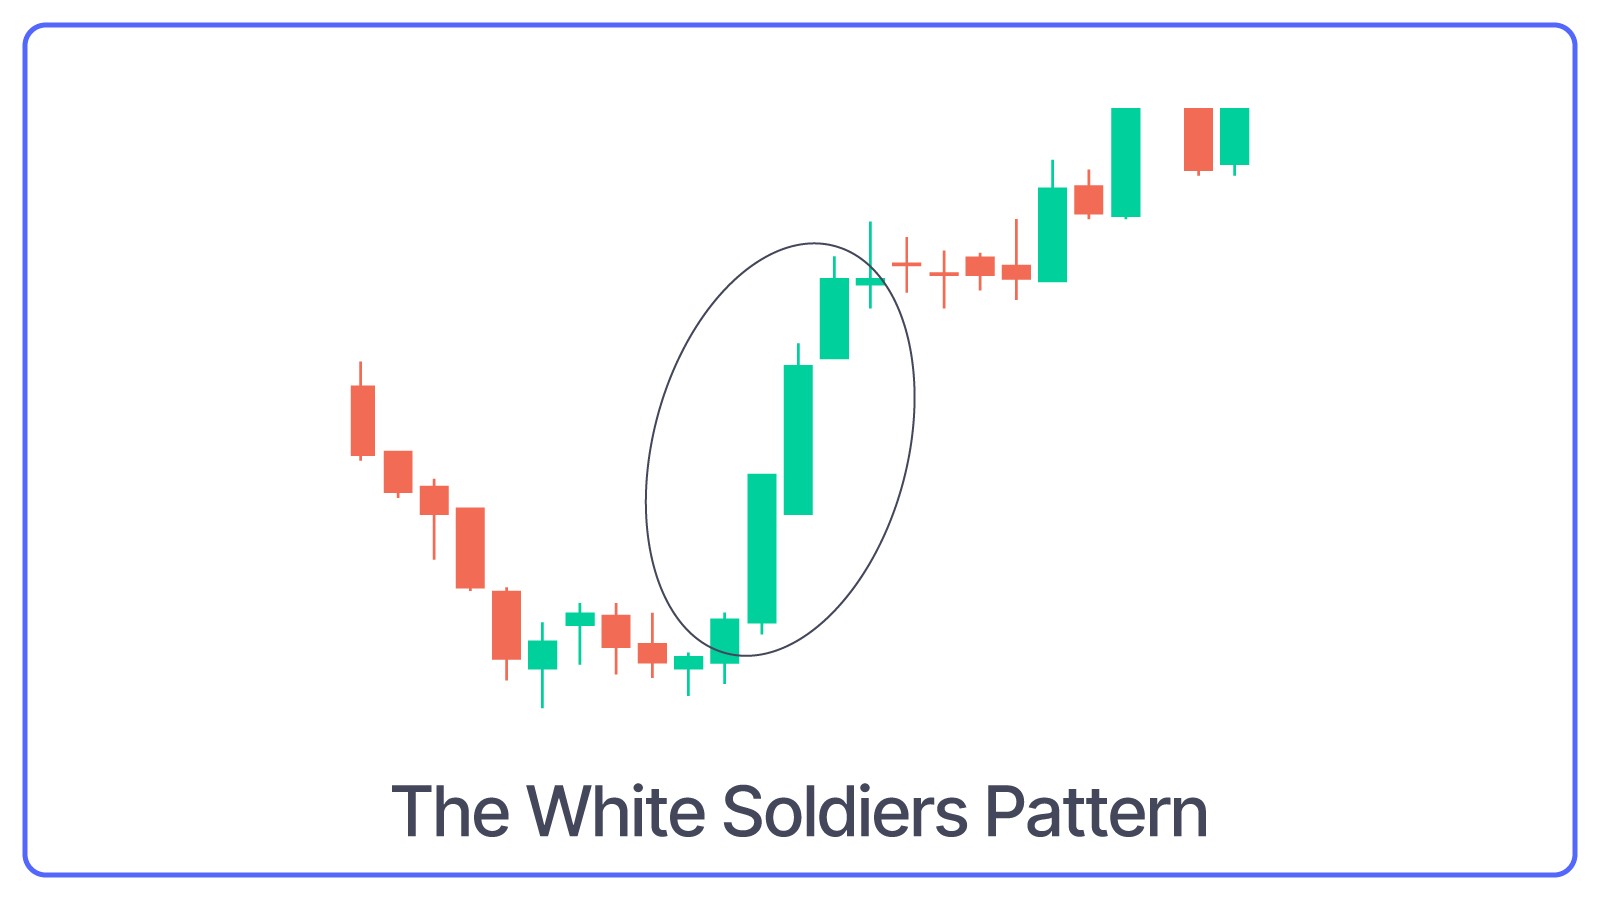
The Three White Soldiers pattern consists of three long bullish candles with small wicks that appear consecutively one after another. Each new candle opens inside the previous one’s body and closes higher than the last.
What Three White Soldiers Pattern Indicates: This candlestick pattern indicates that the market is moving from a downtrend (falling prices) to an uptrend (rising prices).
Inverted Hammer Pattern
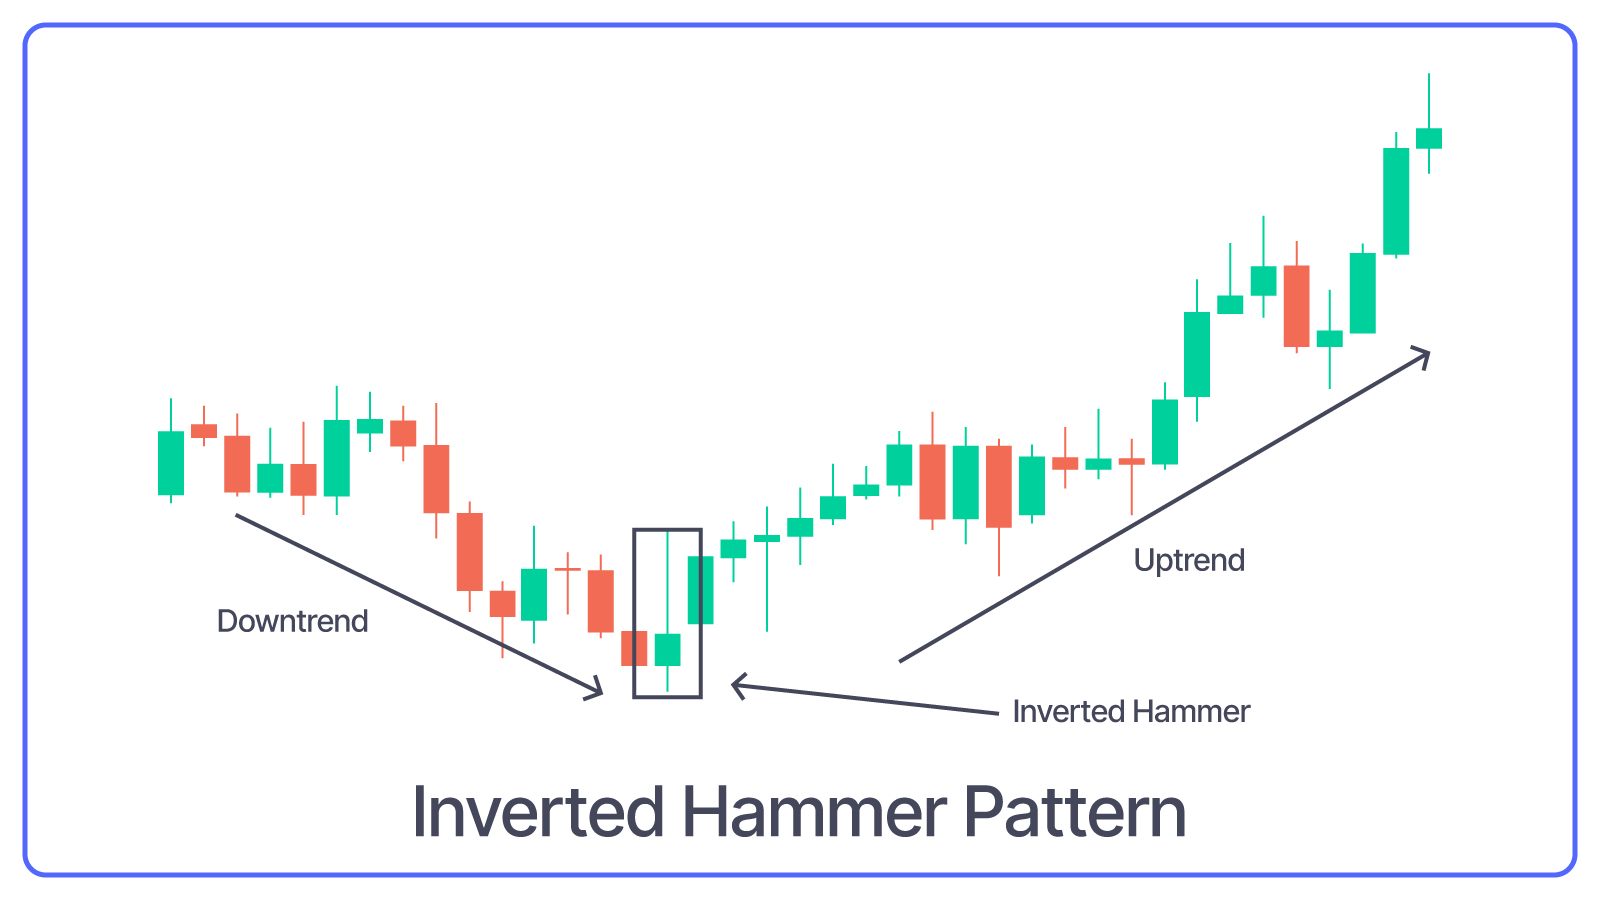
The Inverted Hammer Pattern appears at the bottom of a downtrend and features a small body with a long upper shadow and little to no lower shadow.
What Inverted Hammer Pattern Indicates: This pattern suggests that buyers attempted to push prices higher during the session.
Dragonfly Doji Bullish Pattern
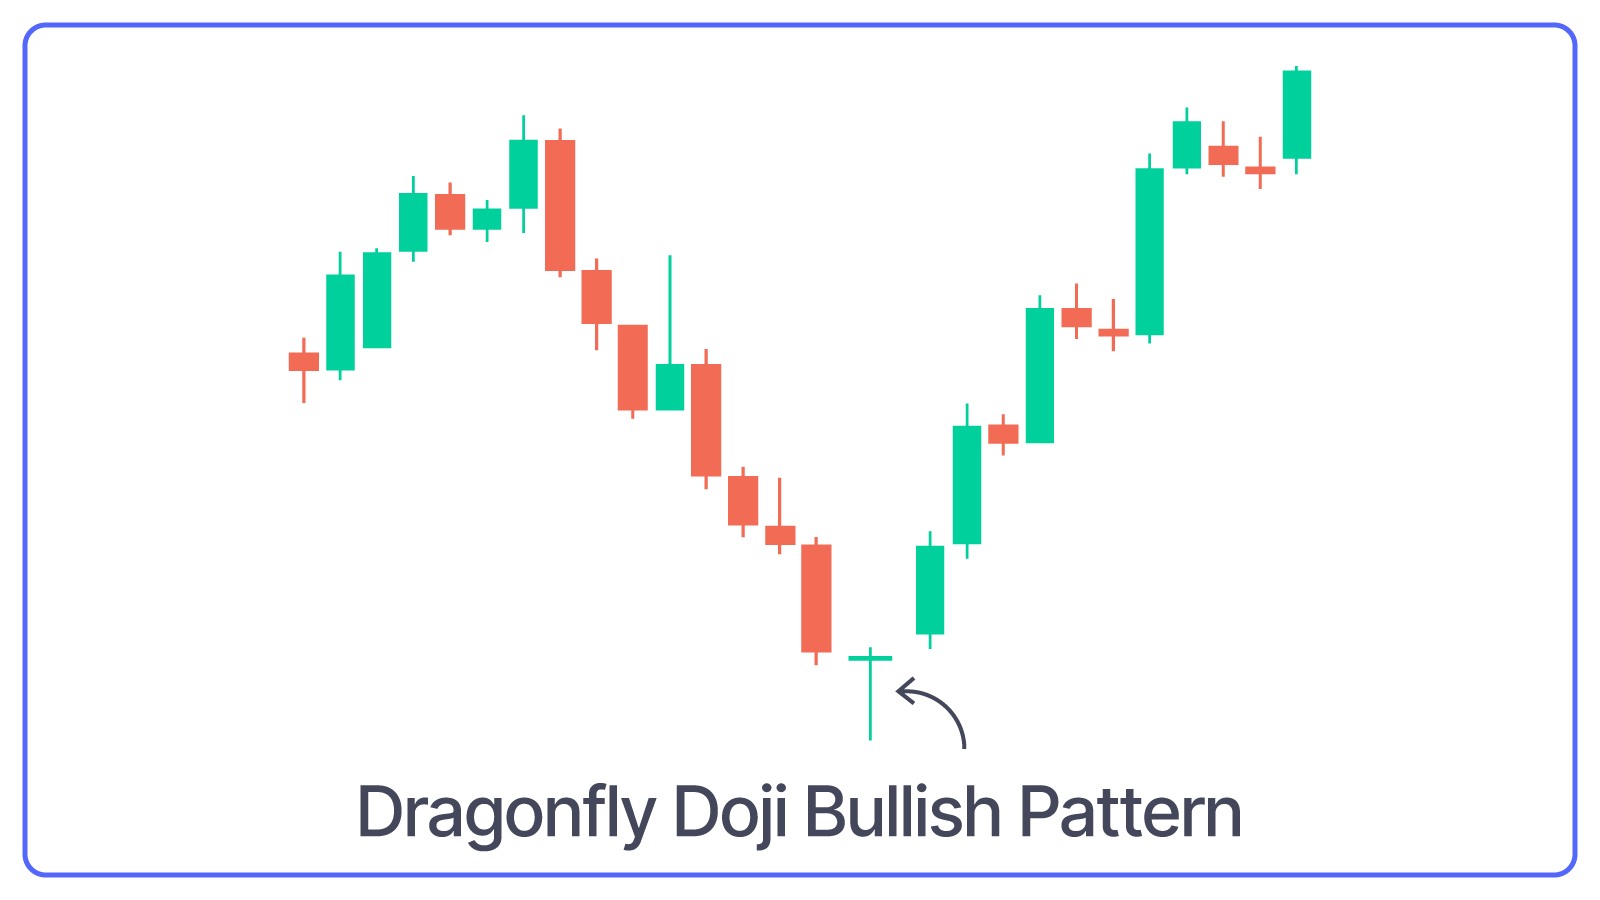
The Dragonfly Doji is a single candlestick pattern with a very small body and a long lower shadow that appears at the bottom of a downtrend.
What Dragonfly Doji Bullish Pattern Indicates: It indicates that a stock's open, high, and close prices are all near the same level. Dragonfly Doji Bullish Pattern might seem similar to Hammer Pattern but Dragonfly Doji has no body, while Hammer has a small body at the top.
Bullish Abandoned Baby Pattern
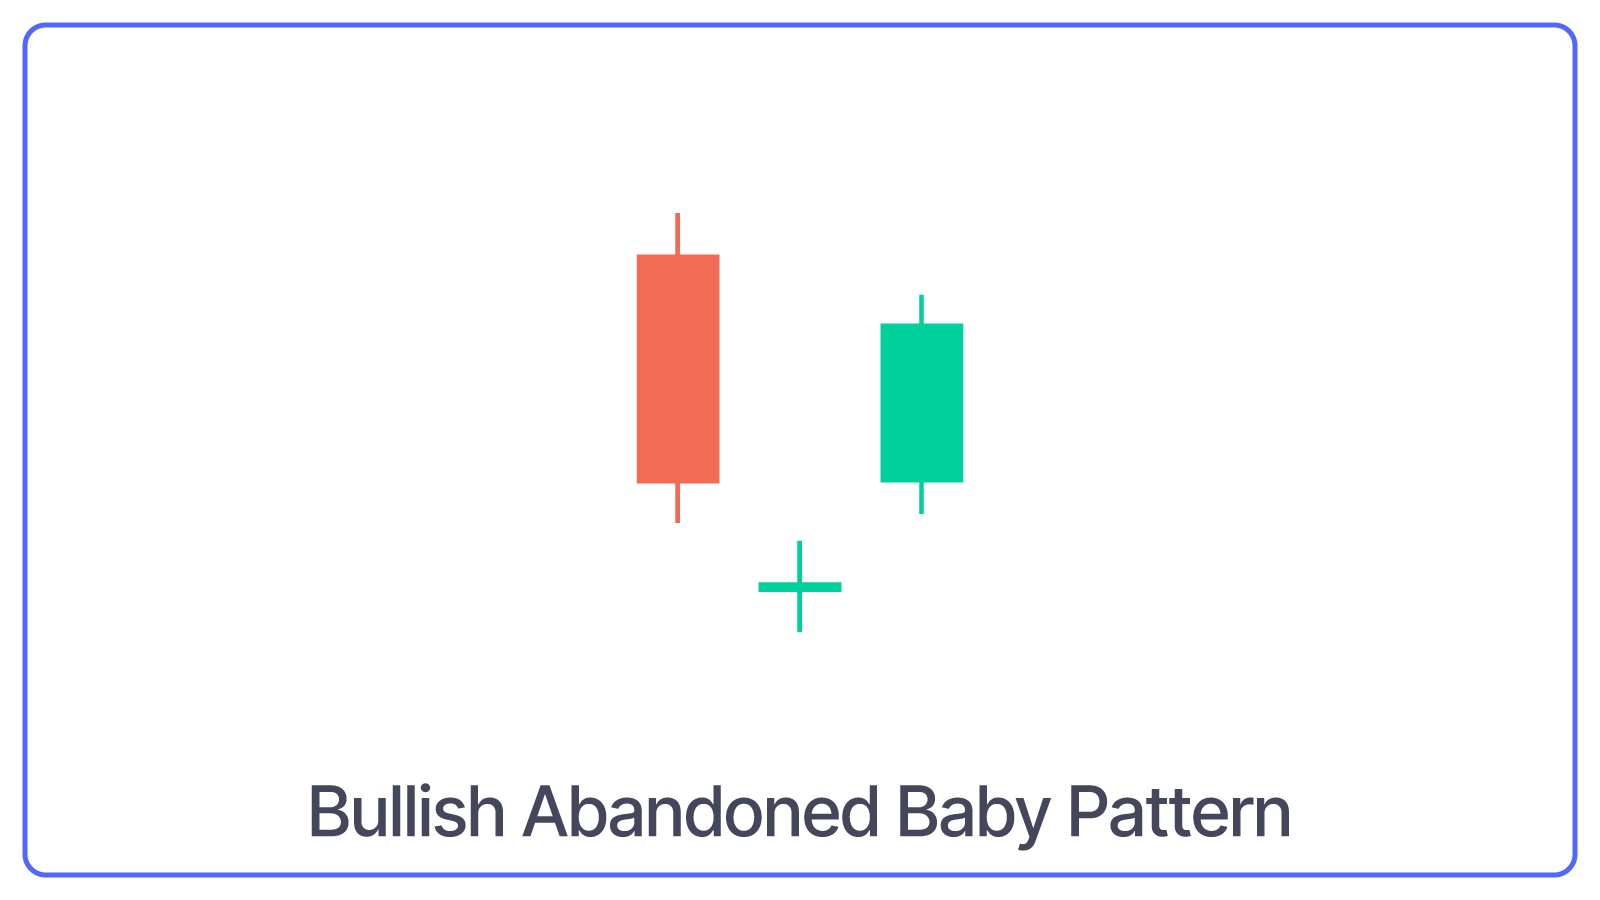
The Bullish Abandoned Baby is a three-candlestick pattern. It consists of a long bearish candle, followed by a doji candle that gaps down, and then a long bullish candle that gaps up.
What Bullish Abandoned Baby Pattern Indicates: This pattern signals a strong reversal and a significant shift from bearish to bullish sentiment.
Three Inside Up Pattern
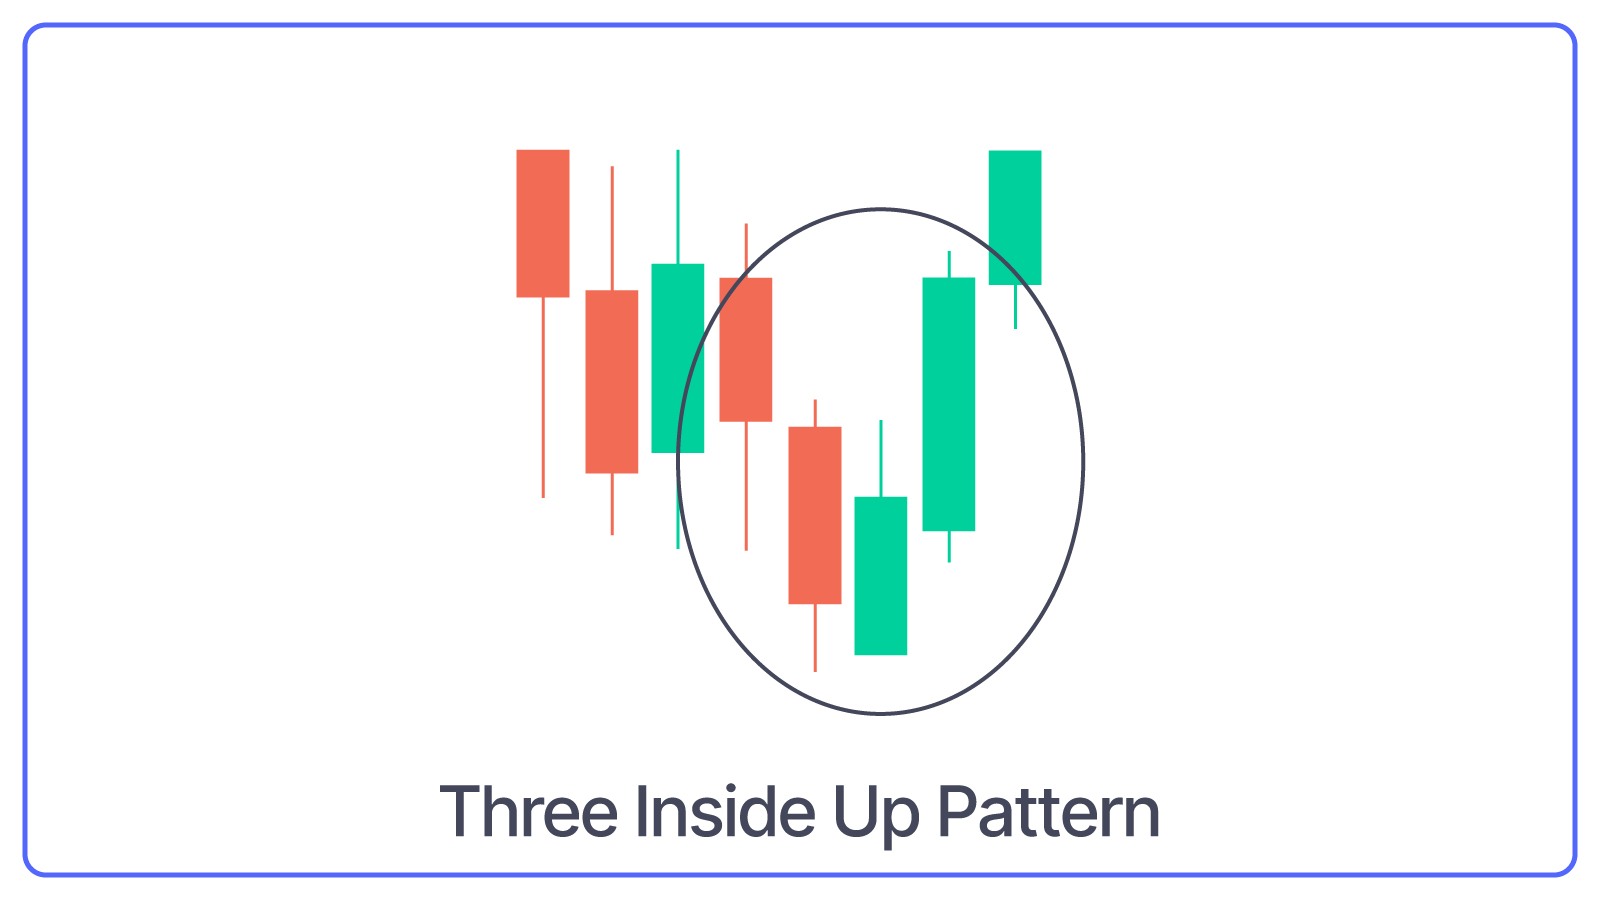
The Three Inside Up pattern consists of three candles:
- A large bearish candle,
- A small bullish candle that closes above the 50% level of the first candle and
- A third bullish candle that closes above the first candle's open.
What Three Inside Up Pattern Indicates: This pattern indicates a potential reversal in the chart/share/stock.
Three Outside Up Pattern
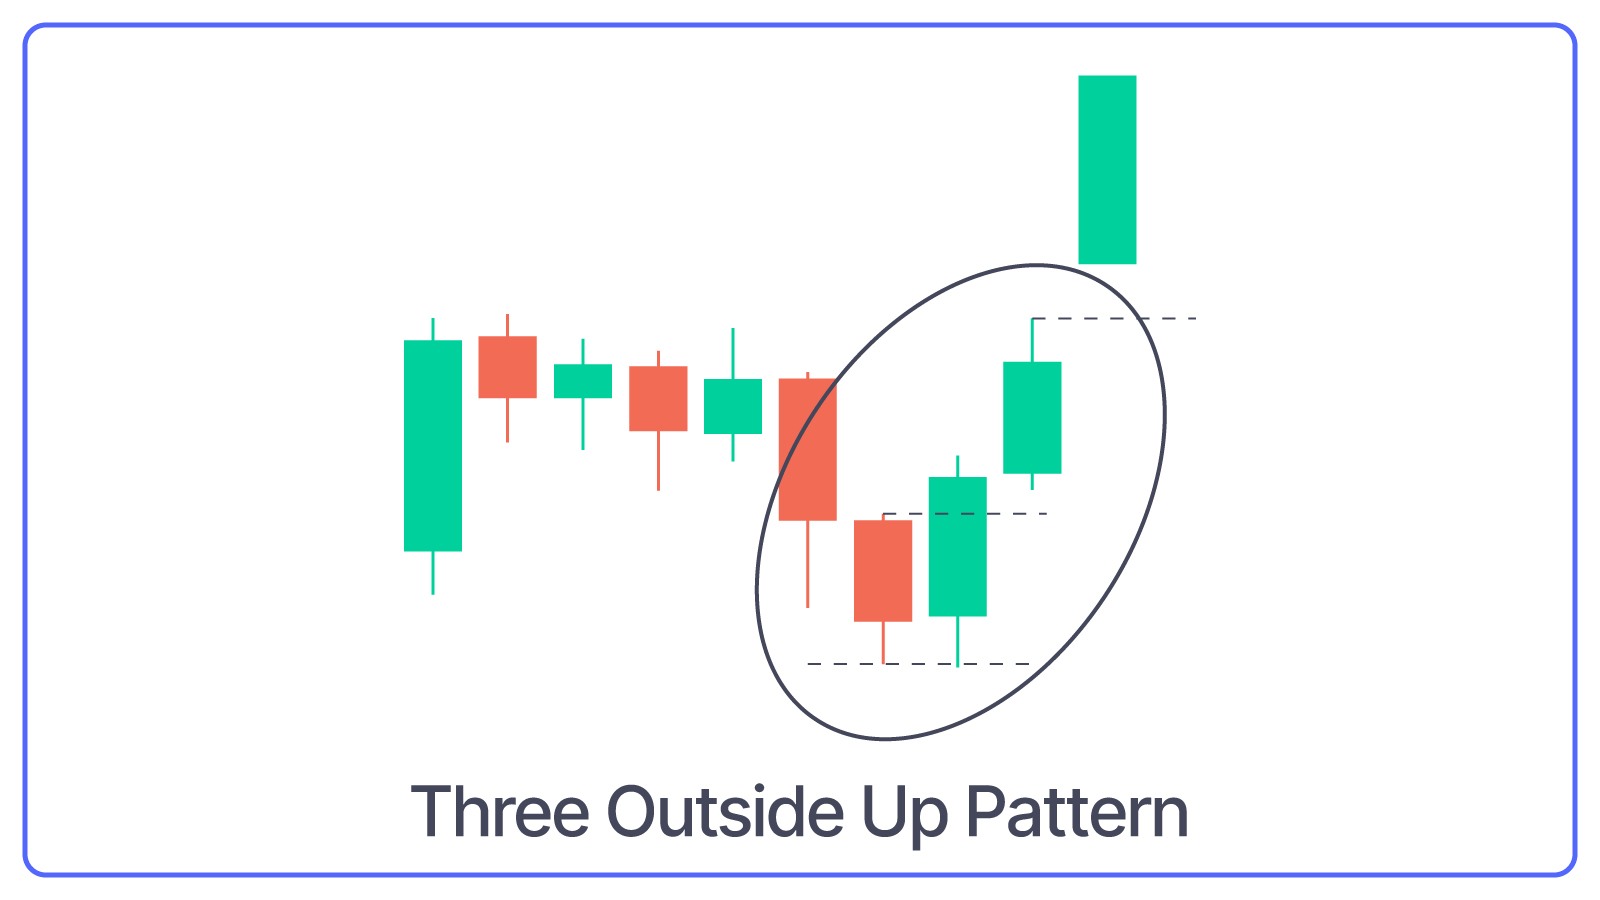
As the name suggests, the three outside up pattern is a three candlestick pattern that starts with a bearish candle, followed by a bullish candle that engulfs the first candle and ends with another bullish candle that closes higher.
What Three Outside Up Pattern Indicates: This pattern confirms the strength of the bullish reversal.
Bullish KickerPattern
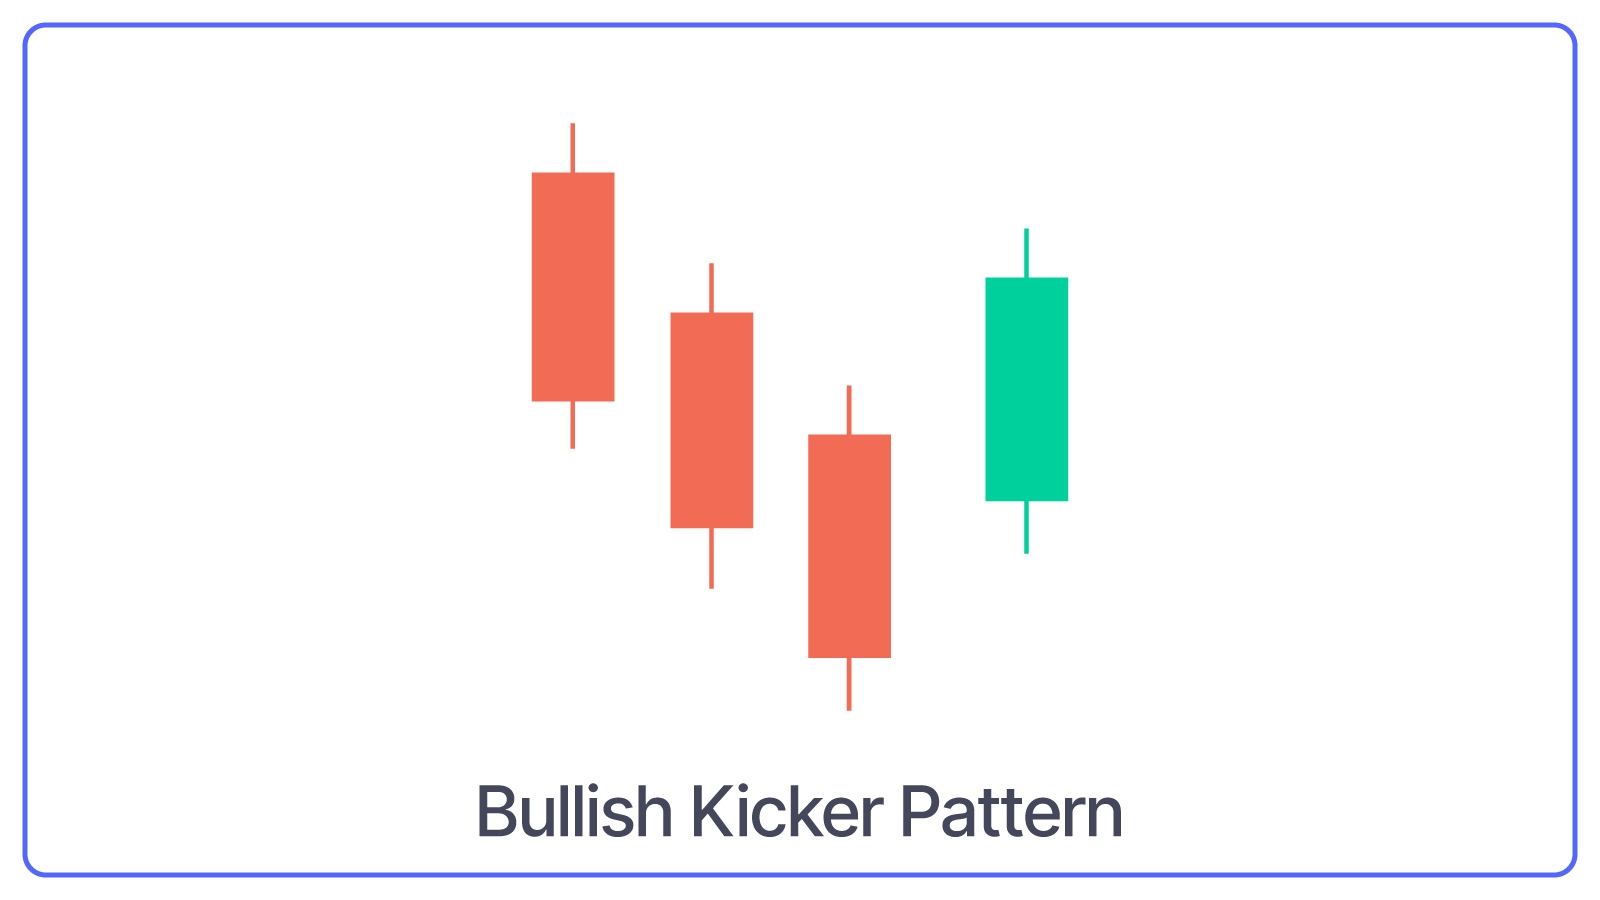
The Bullish Kicker pattern starts with a long bearish candle followed by an even longer bullish candlestick. The candle opens higher than the previous day's closing price and rises even more.
What Kicker Pattern Indicates: Signals a strong reversal in market sentiment. This pattern shows that even though the market was down the day before, buyers suddenly took control and pushed the price up quickly.
Tweezer Bottom Pattern
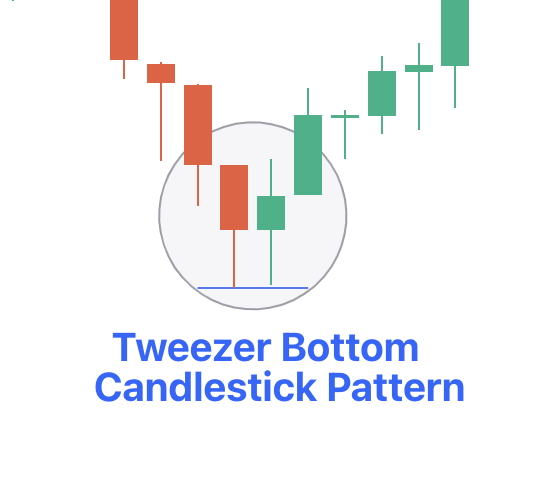
Tweezer Bottom Pattern is a two-candlestick pattern that includes two equal-sized bullish and bearish candles.
What Tweezer Bottom Pattern Indicates: This pattern indicates that the market has found a support level.
Rising Three Methods Pattern
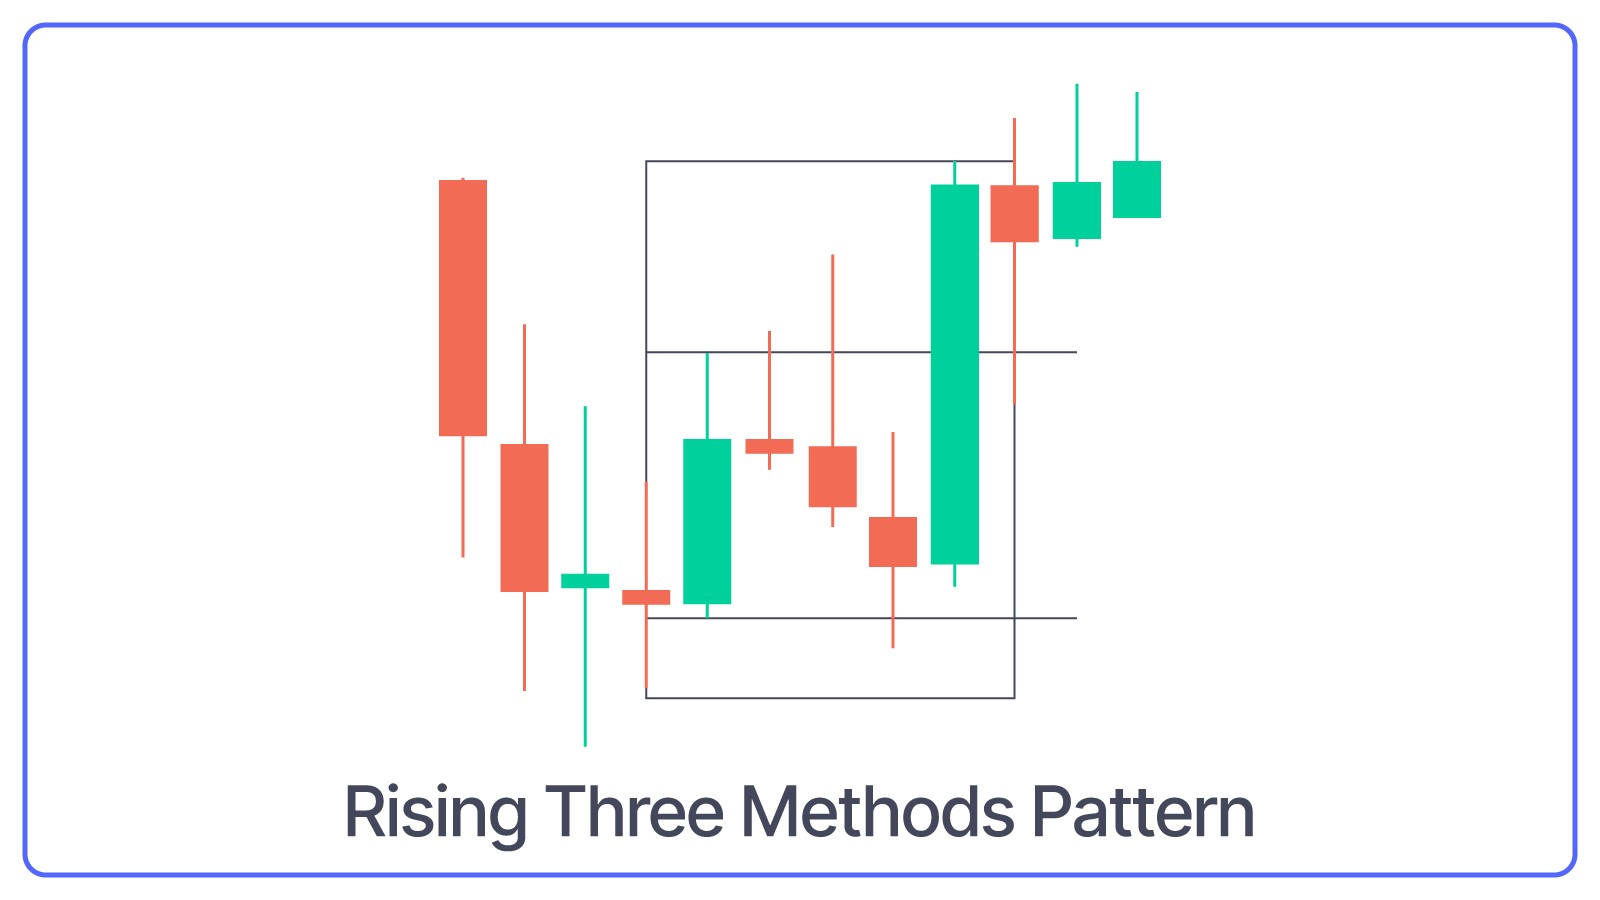
The Rising Three Methods Pattern consists of five candles in a continuation pattern, i.e., a long bullish candle, three small bearish candles that trade above the low and below the high of the first candlestick, and another long bullish candle that closes above the high of the first candlestick.
What Rising Three Methods Pattern Indicates: Uptrend is likely to continue. It means the price takes a short break or goes slightly down before it moves up again. The pattern suggests that buyers are still in control, and the price should go up after this small pause.
Concealing Baby Swallow Pattern
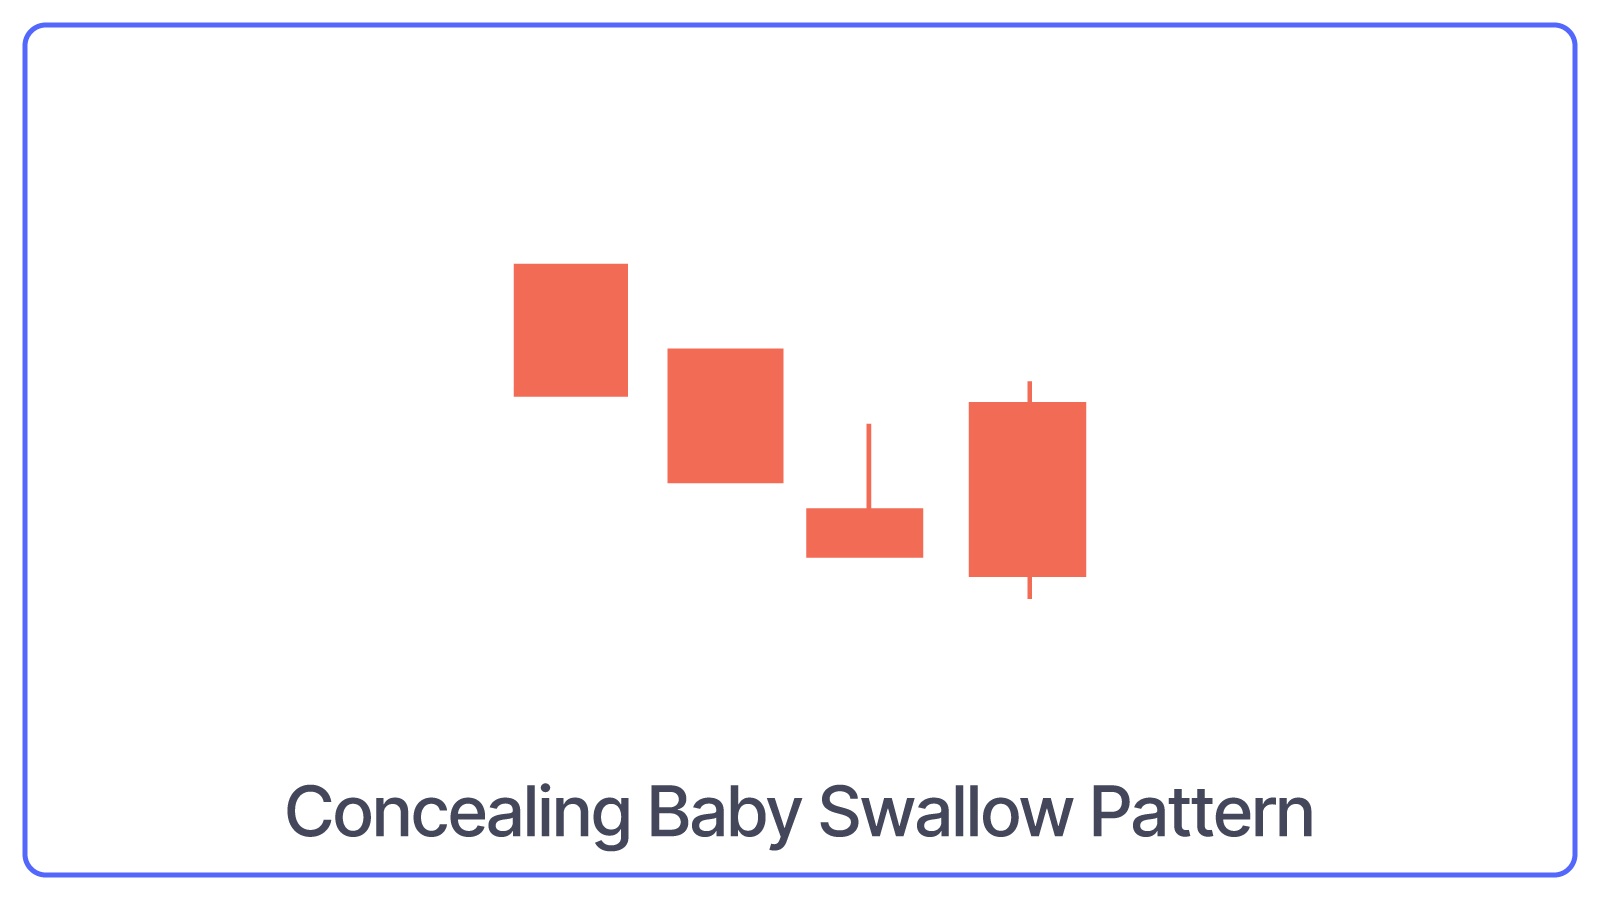
The Concealing Baby Swallow is a four-candlestick pattern that starts with two long bearish candles, followed by a gap down with a small bullish or bearish candle and ends with another long bearish candle that completely engulfs the small candle.
What Concealing Baby Swallow Pattern Indicates: Selling pressure is decreasing in a downtrend. It suggests a potential bullish reversal, where the downtrend may be coming to an end, and the price could start to rise.
Mat Hold Pattern
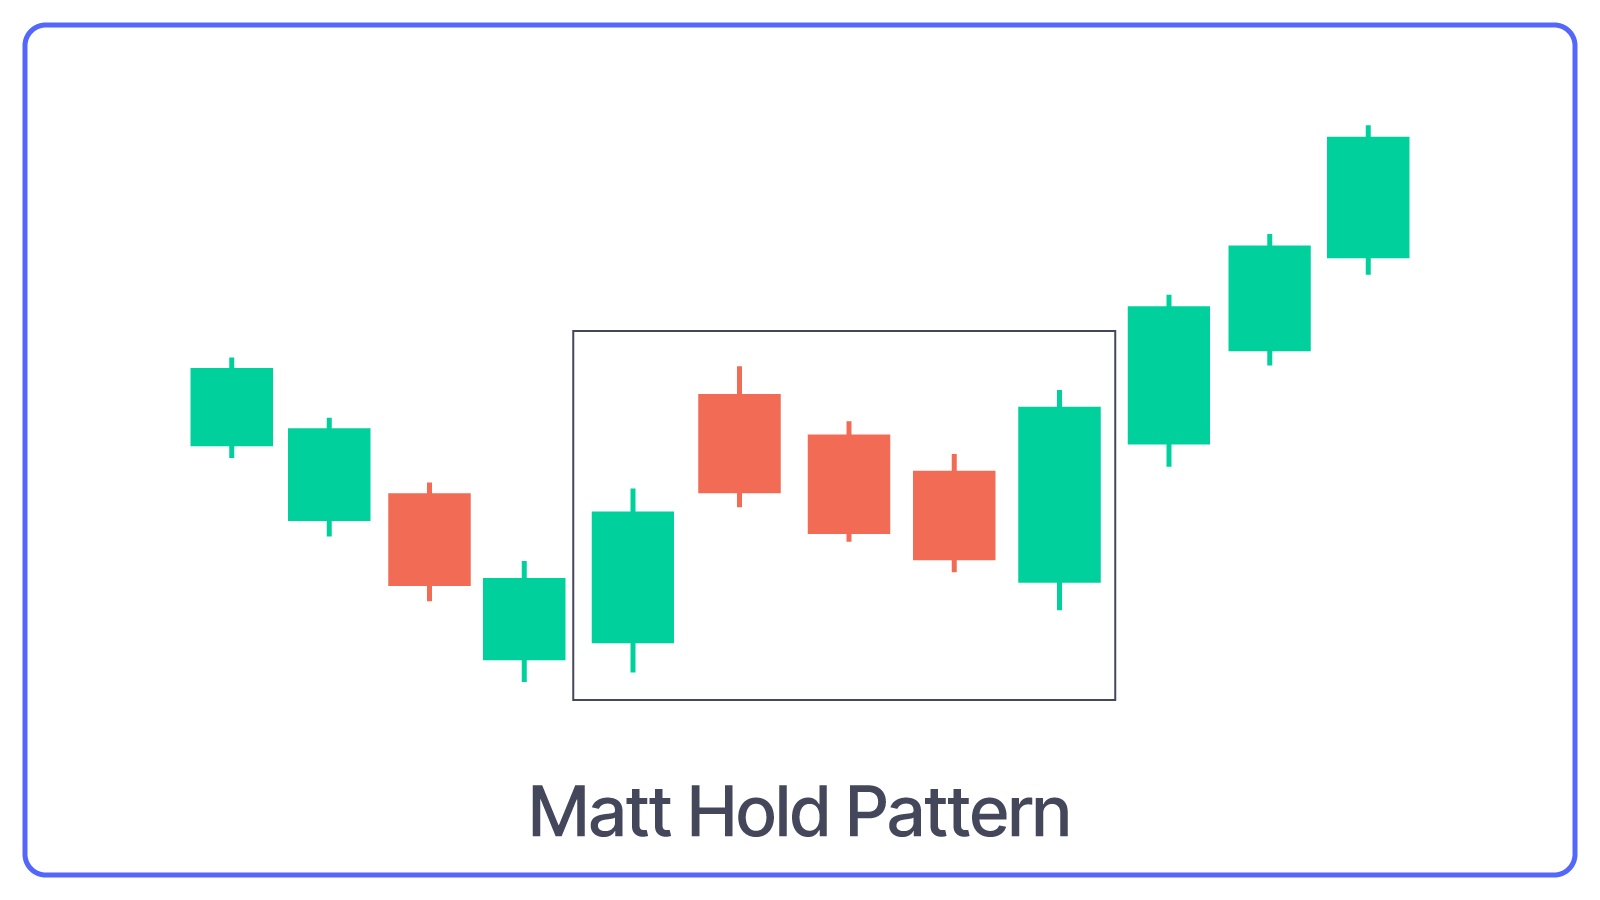
The Mat Hold pattern is similar to the rising three methods pattern. It is a continuation pattern consisting of five candles that start with a long bullish candle, followed by three small bearish candles (a smaller bearish candles that move lower) that stay within the range of the first candle and end with another long bullish candle that closes above the high of the first candle.
What Mat Hold Pattern Indicates: Brief pause or consolidation in an uptrend.
Bullish Separating Lines Pattern
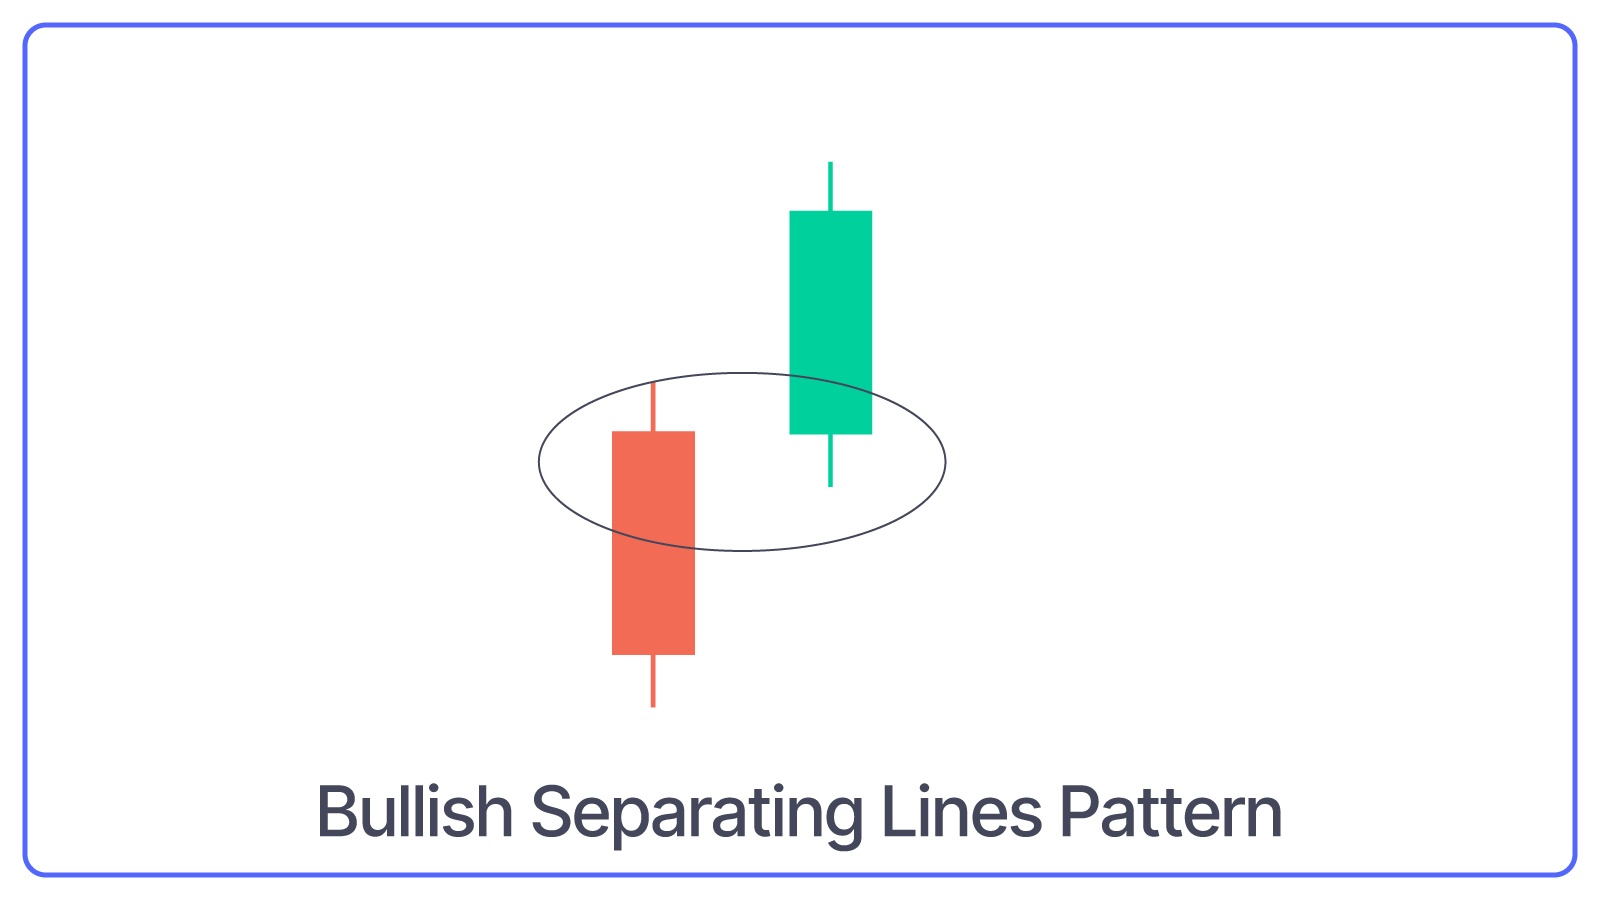
The bullish Separating Lines Pattern is a two-candlestick pattern that includes a bearish candle followed by a bullish candle that opens at the same level as a bearish candle.
What Bullish Separating Lines Pattern Indicates: This pattern suggests that the uptrend will continue after a brief pause.
Bullish Belt Hold Pattern
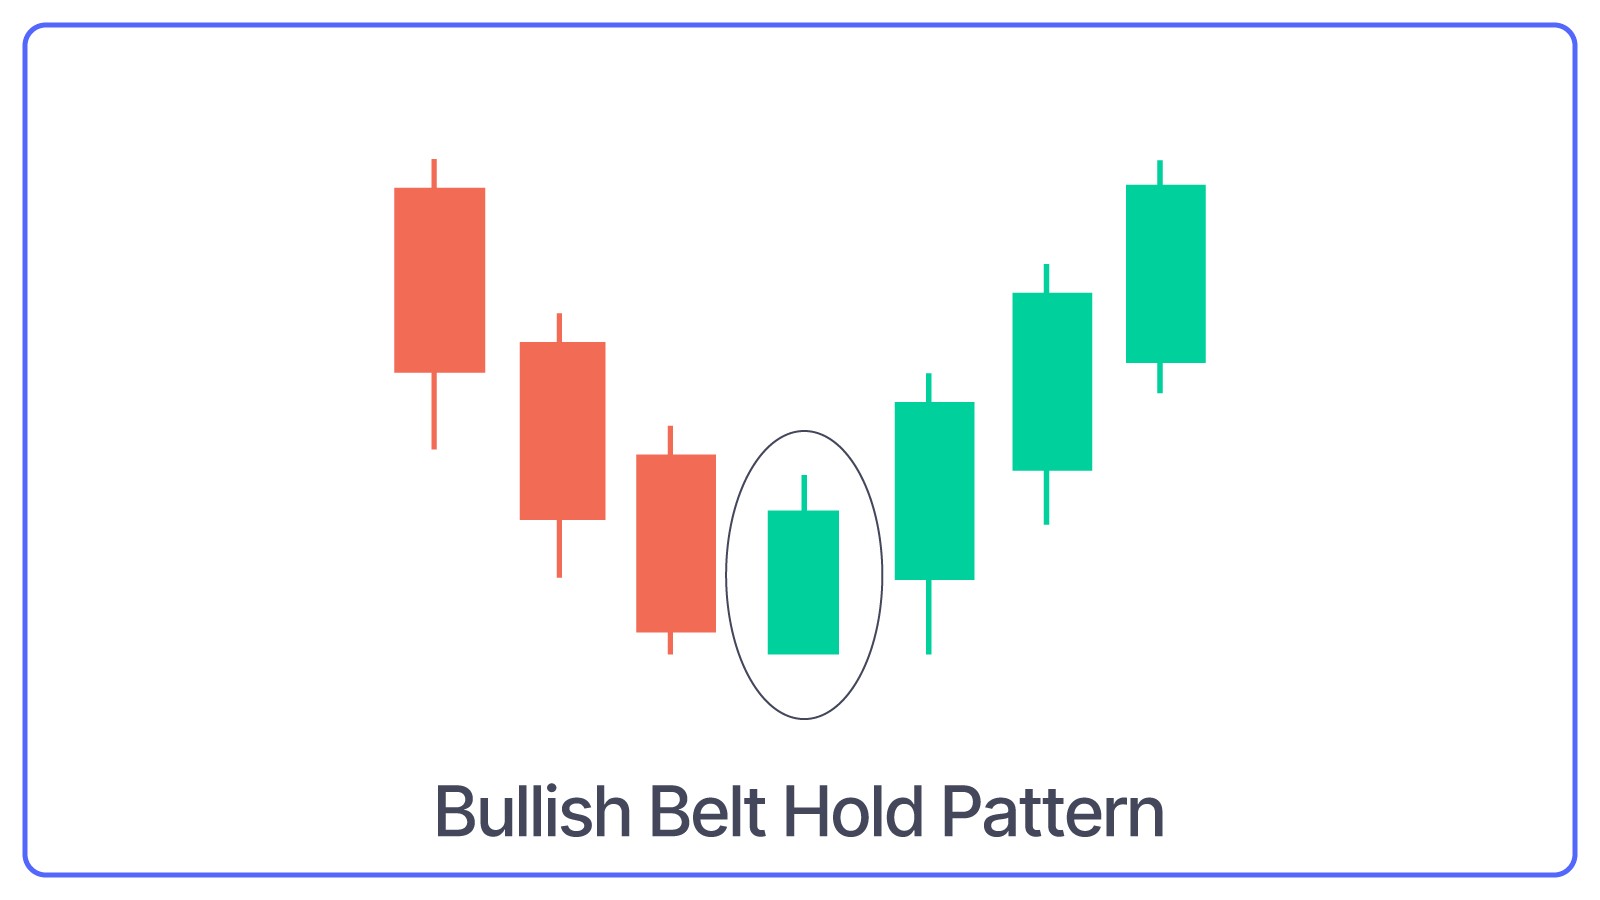
The Bullish Belt Hold Pattern is a single candlestick pattern that appears at the bottom of a downtrend. The opening price of the candle becomes lower for the day and closes near the high, with little to no lower shadow.
What Bullish Belt Hold Pattern Indicates: Strong buying pressure and a potential reversal from a downtrend to an uptrend.
Three-Line Strike Pattern
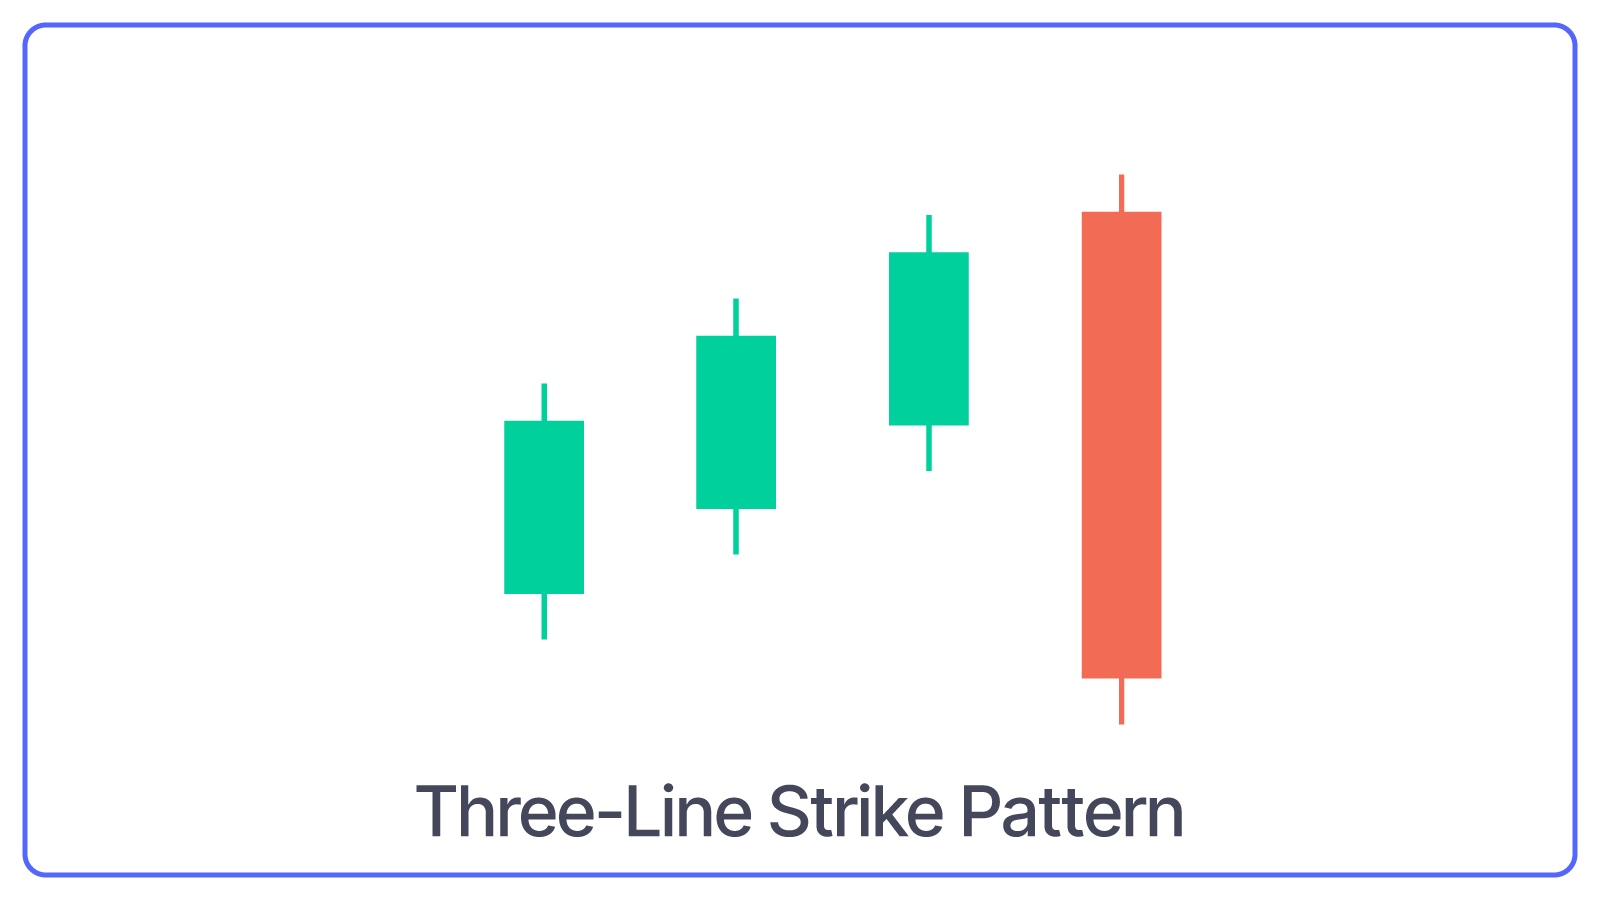
The Three-Line Strike Pattern is made up of four candles: three consecutive bullish candles followed by a long bearish candle that opens higher and closes lower than the first candle of the pattern.
What Three-Line Strike Pattern Indicates: Despite the bearish fourth candle, it suggests that the price will resume moving upward after a brief pause.
Ladder Bottom Pattern
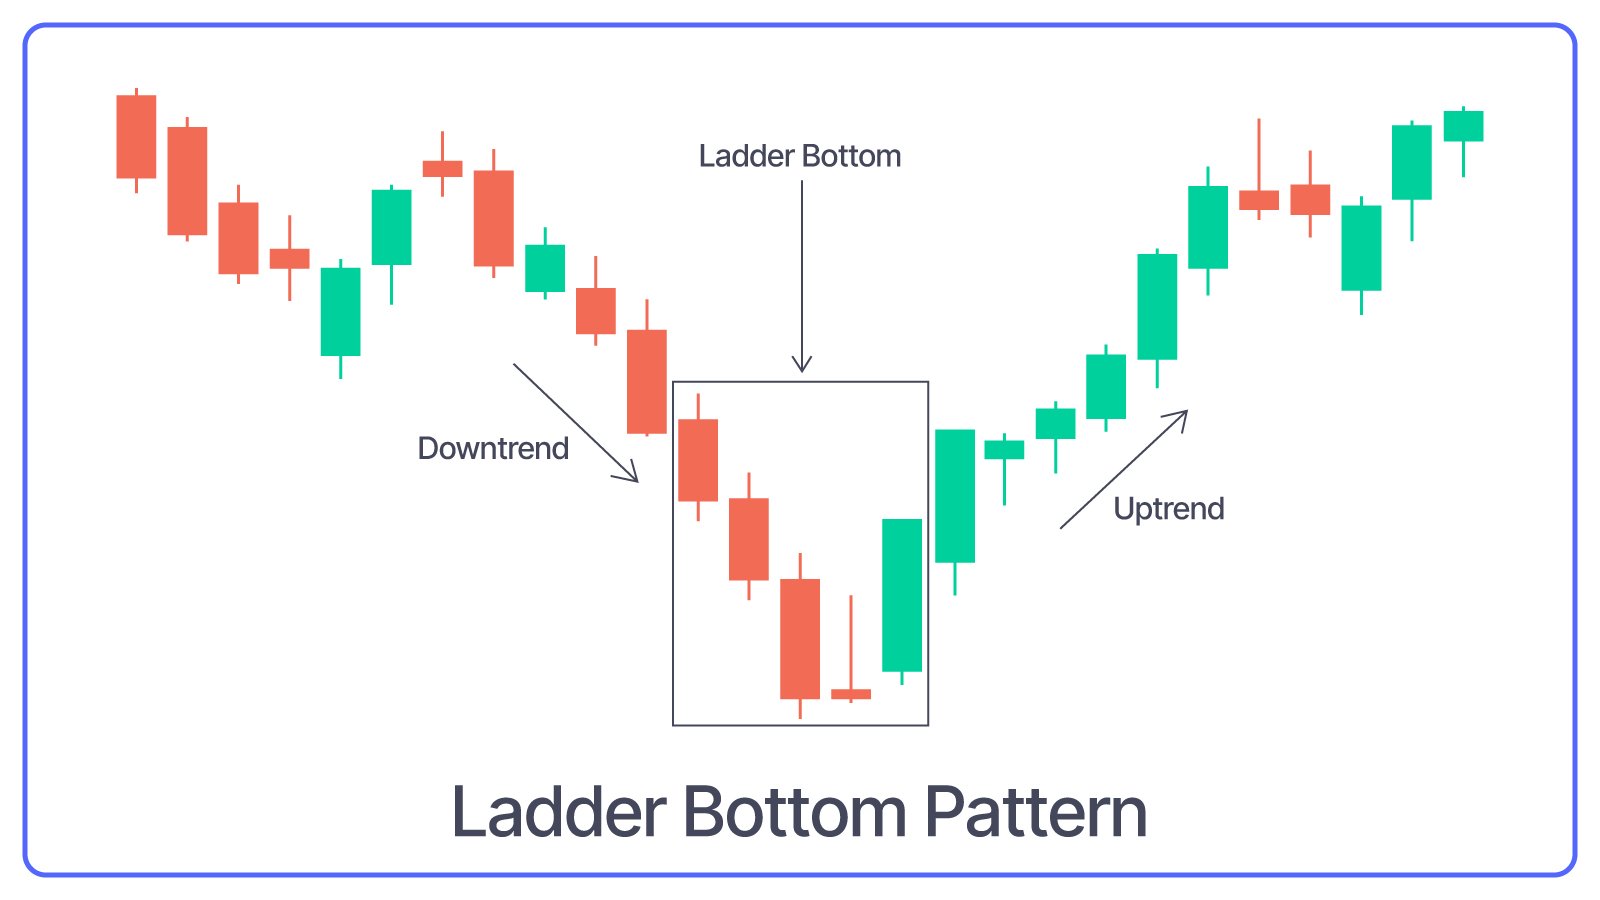
The Ladder Bottom Pattern is a five-candlestick pattern that starts with three consecutive long bearish candles, followed by a small bearish or bullish candle and ends with a long bullish candle.
What Ladder Bottom Pattern Indicates: Bearish trend is ending and buying pressure may be starting to take control.
Meeting Lines Pattern
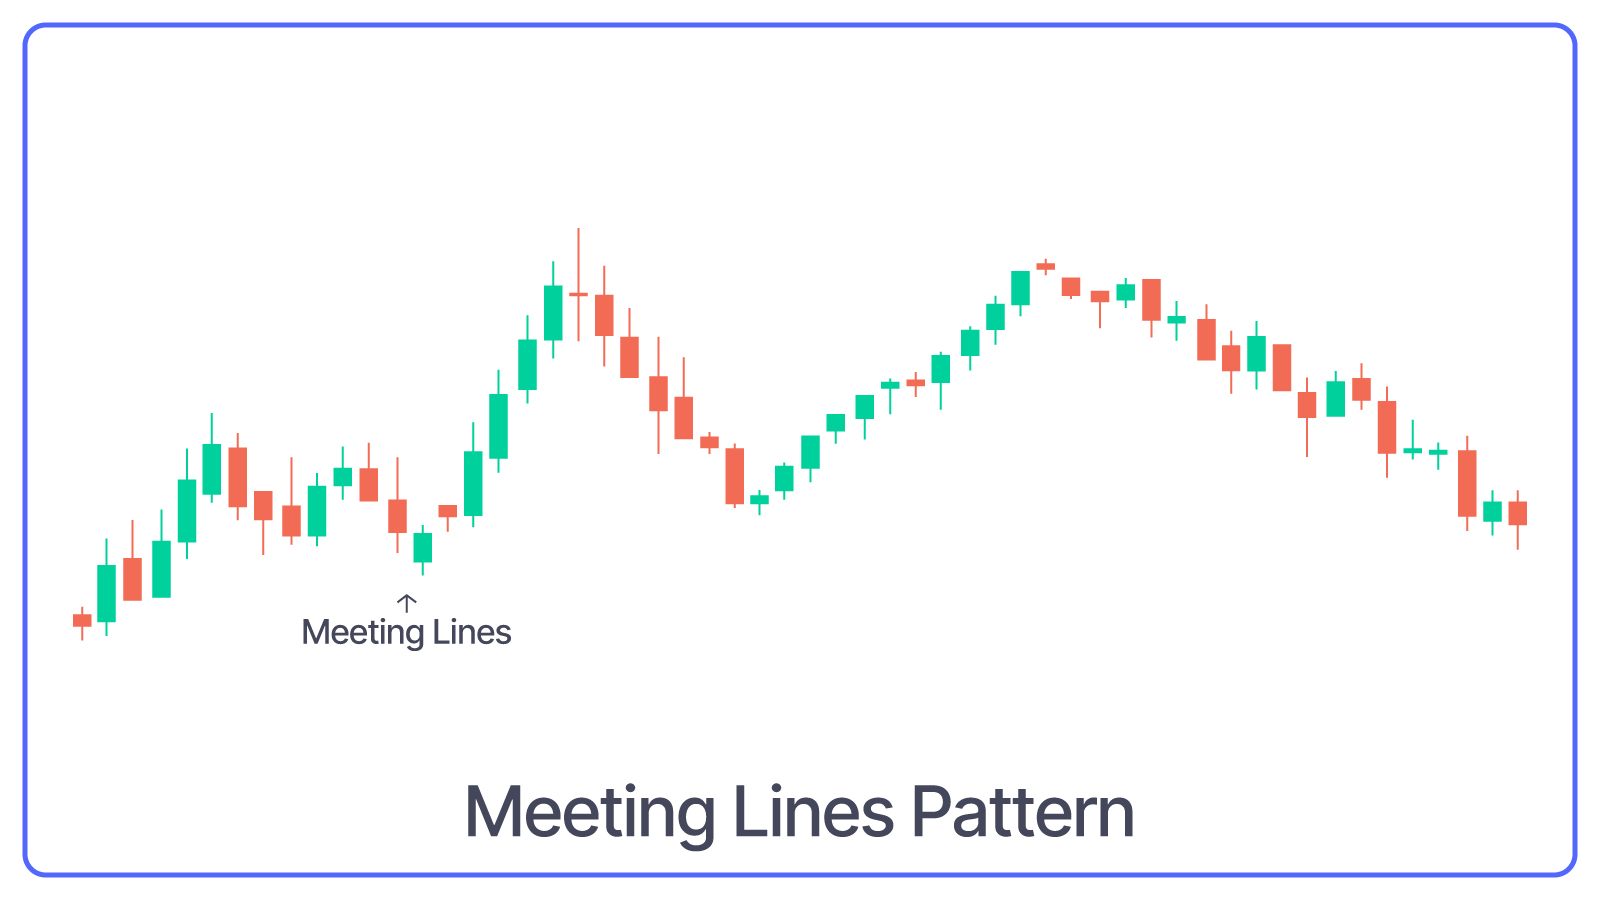
The meeting Lines Pattern consists of two candles: a long bearish candle followed by a long bullish candle that opens lower but closes at the same level as the bearish candle’s close.
What Meeting Lines Pattern Indicates: Bullish reversal after a downtrend and indicates a shift from selling to buying pressure.
Bearish Candlestick Patterns
Bearish Engulfing Pattern
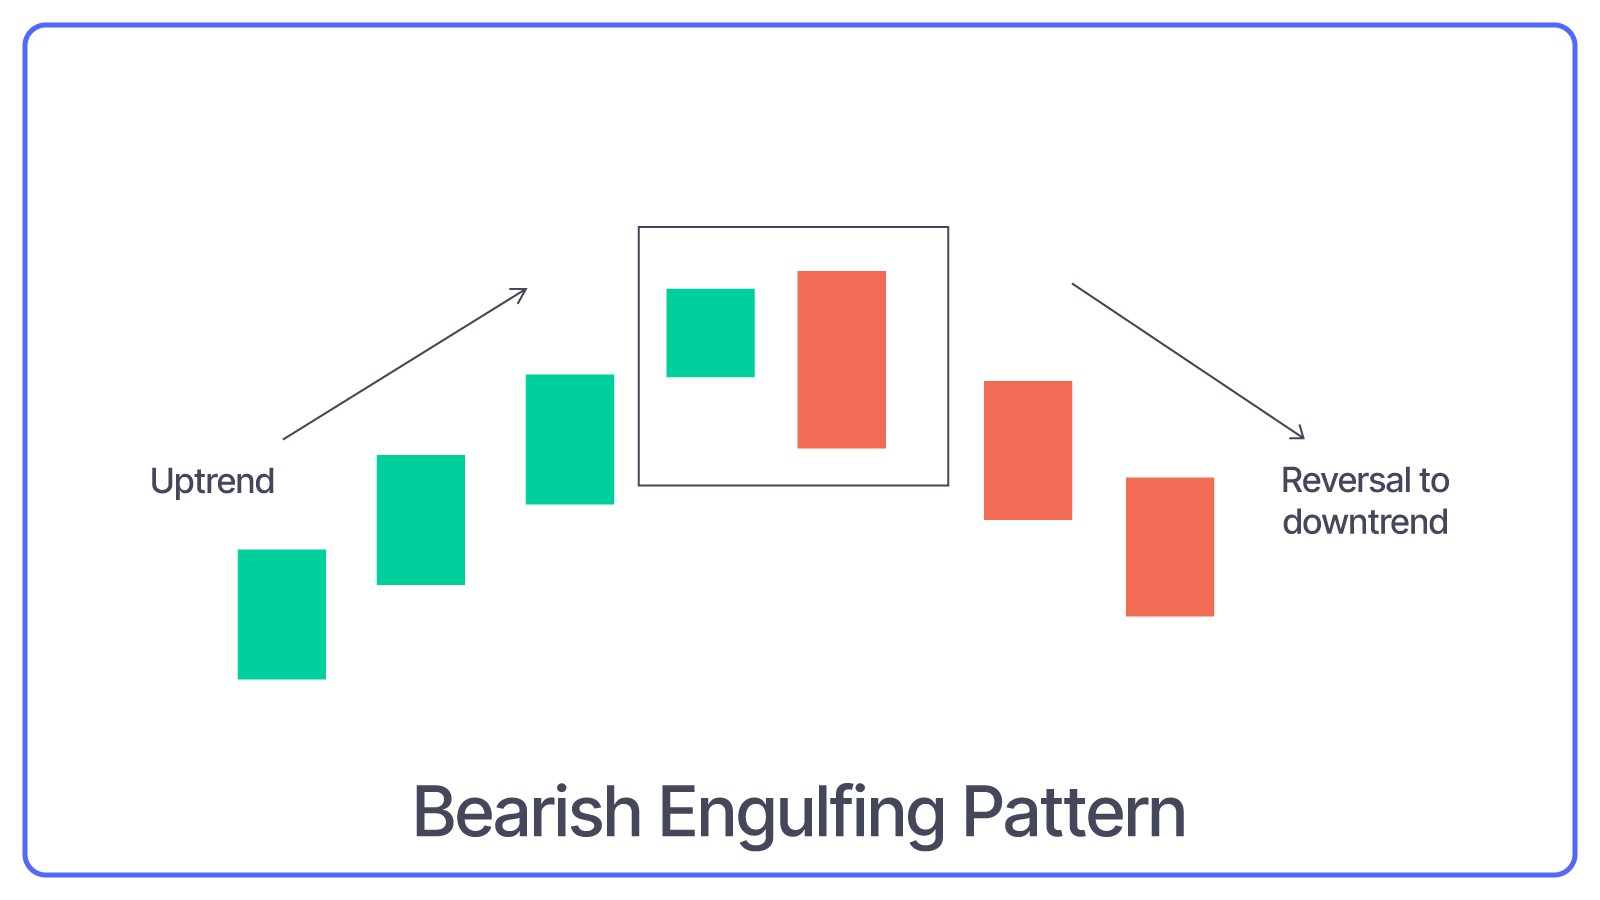
Three Black Crows bearish candlestick pattern forms when a small bullish candle is followed by a large bearish candle that completely engulfs the previous green candle.
What Bearish Engulfing Pattern Indicates: Generally, this pattern indicates that sellers have taken control, and the share price might continue to fall.
Bearish Belt Hold Pattern
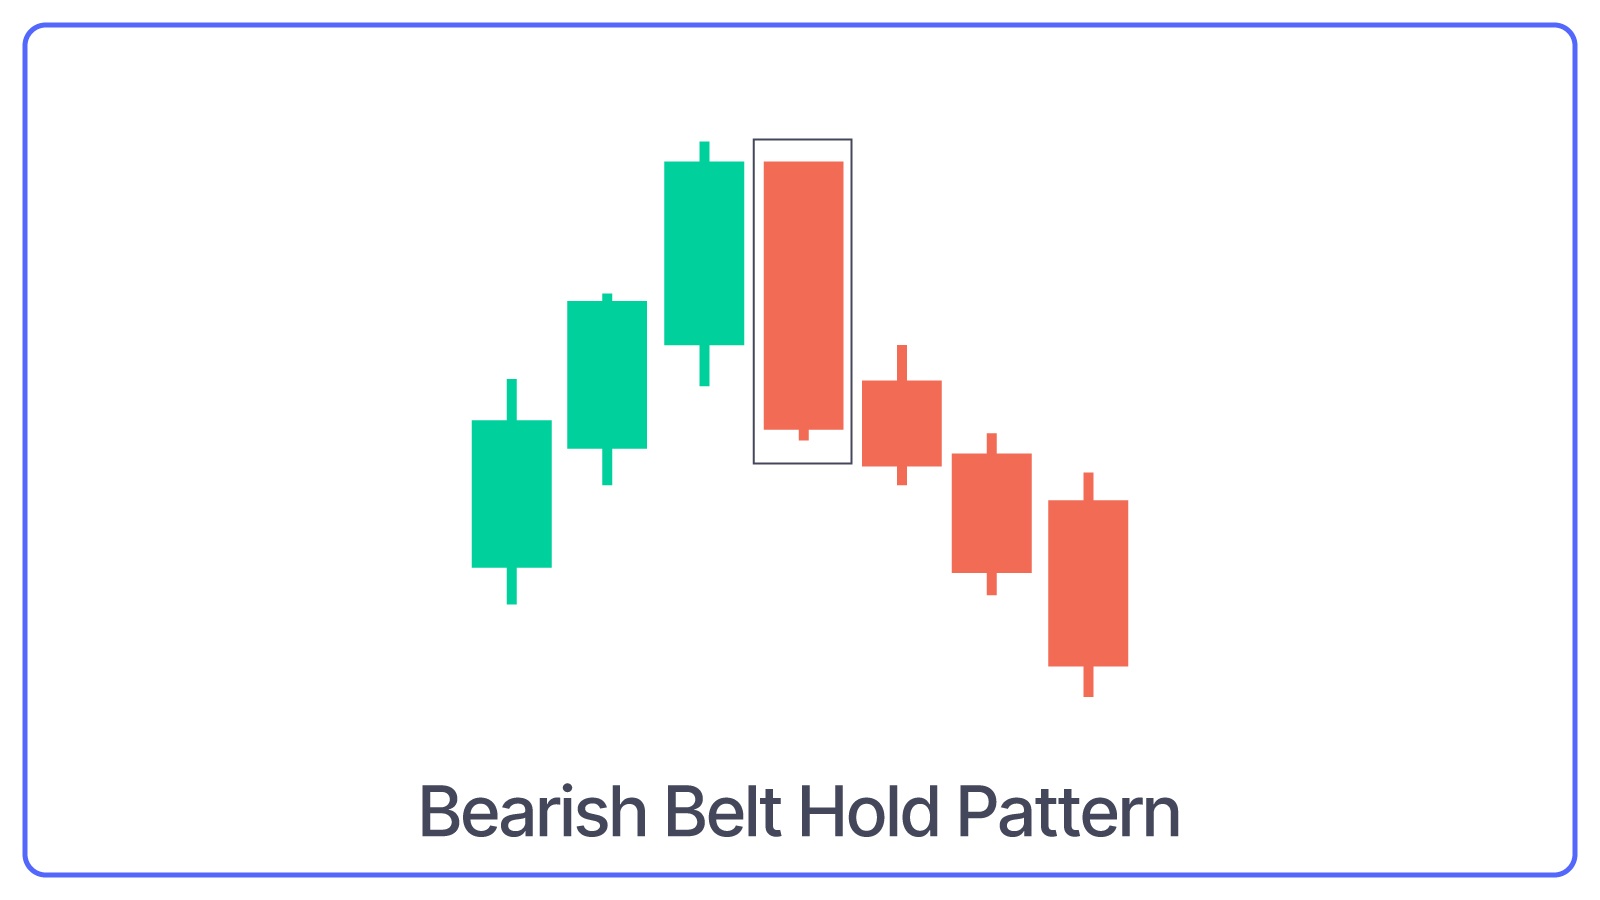
A bearish Belt Hold Pattern is visible when there’s an uptrend in the market. A single long red candle is formed that opens at the high of the day and closes near the low, with little to no upper shadow.
What Bearish Belt Hold Pattern Indicates: It indicates strong selling pressure, which results in an ascending market.
Three Black Crows Pattern
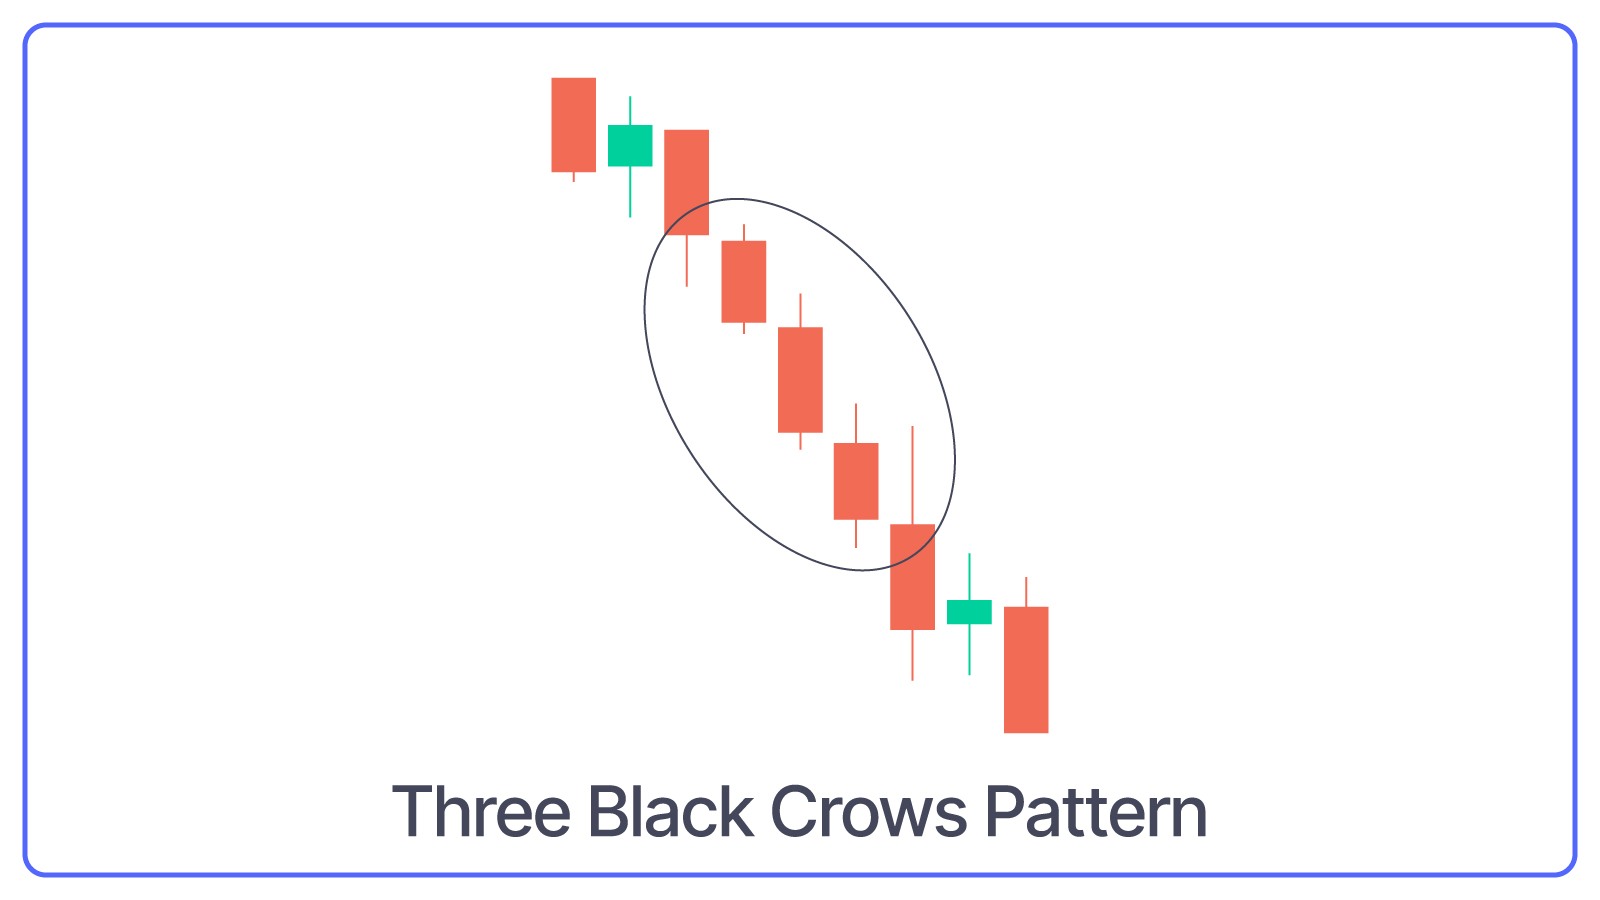
When three consecutive long-red candles with small wicks are visible, three Black Crows pattern is formed.
What Three Black Crows Pattern Indicates: The pattern suggests a continuation of a downtrend, showing strong and steady selling pressure.
Bearish Three-Line Strike Pattern
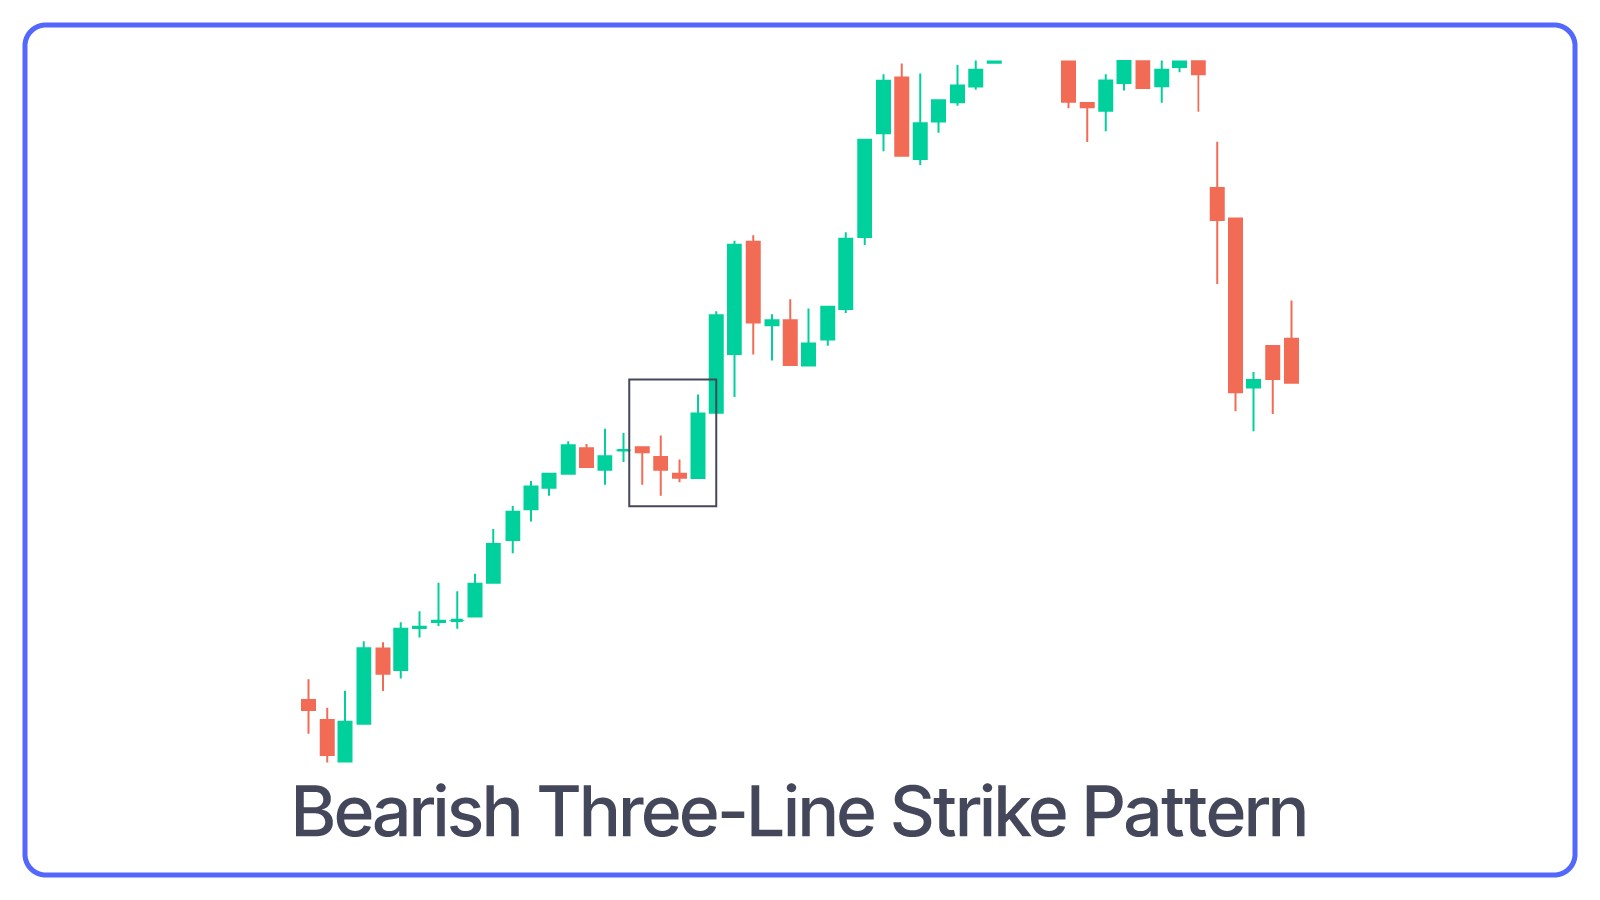
A bearish Three-Line Strike Pattern forms three consecutive red candles, and lastly, a long green candle completes the pattern. It opens lower and closes above the first candle’s opening.
What Bearish Three-Line Strike Pattern Indicates: Despite the fourth bullish candle, the pattern indicates a short pullback and continuation of the downtrend.
Bearish Hanging Man Pattern
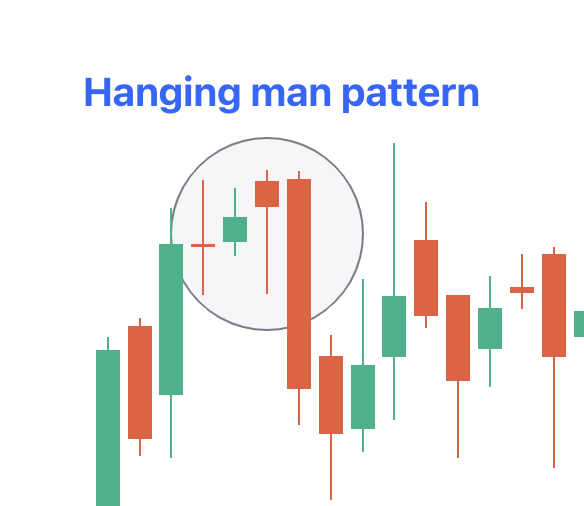
Bearish Hanging Man Pattern appears at the top of the uptrend as a single candle with a small body and a long lower shadow.
What Bearish Hanging Man Pattern Indicates: It indicates that selling pressure is increasing and that the uptrend might be coming to an end.
Upside Gap Two Crows Pattern
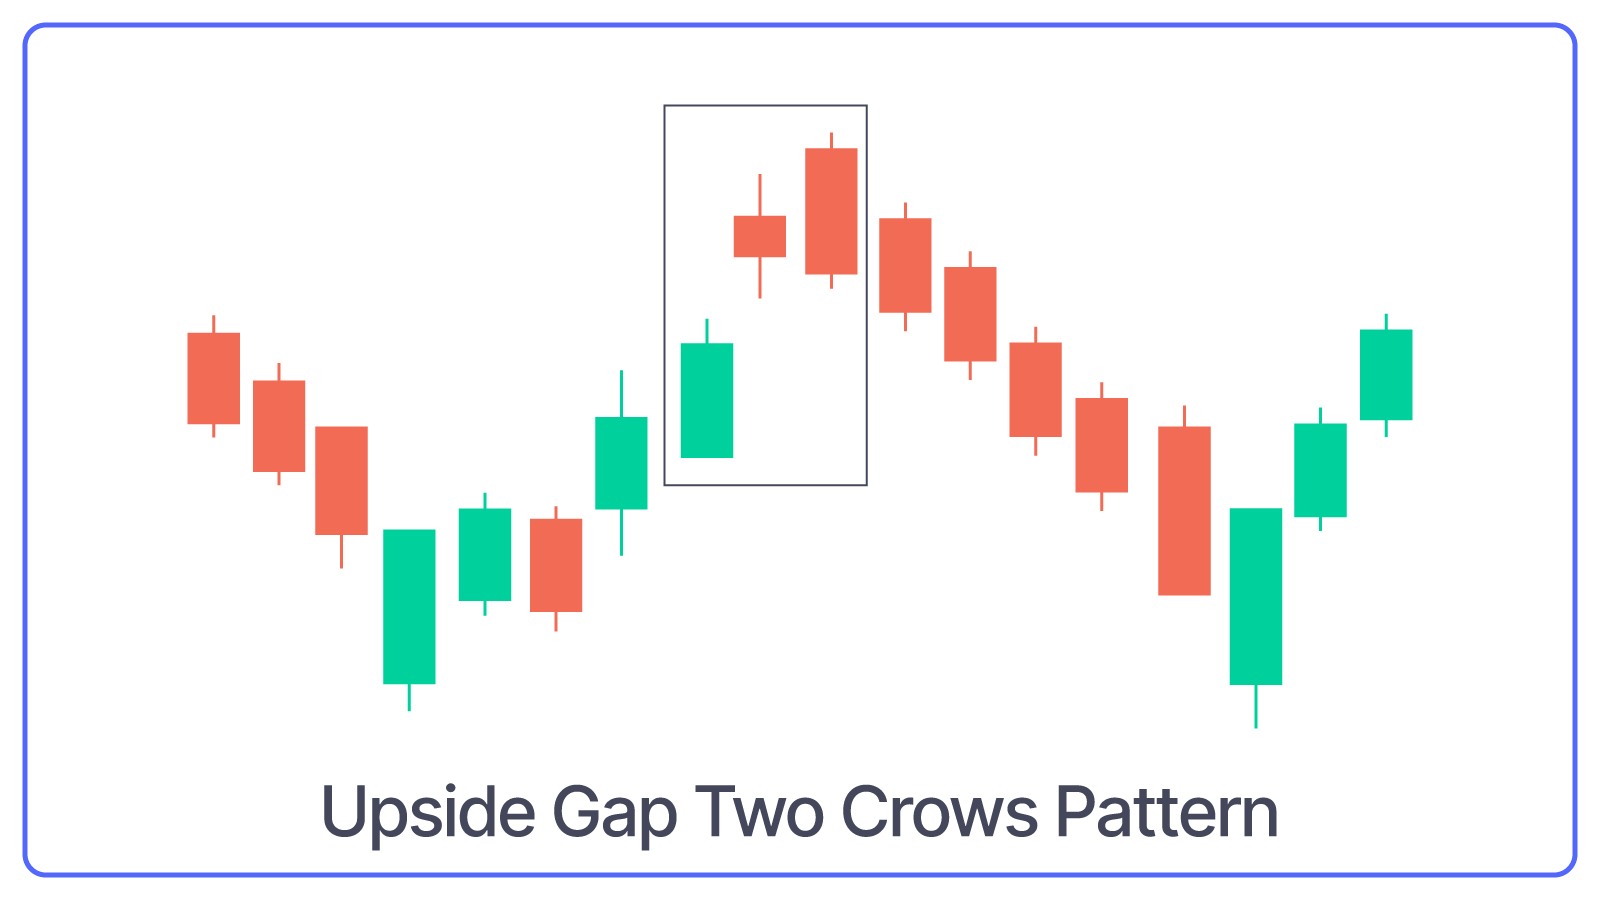
Upside Gap Two Crows Pattern indicates three candles, i.e., a long green candle, followed by two small red candles that create a gap up. The second red candle closes below the first red candle’s close.
What Upside Gap Two Crows Pattern Indicates: Potential reversal or brief consolidation before the downtrend continues.
Bearish Evening Star Pattern
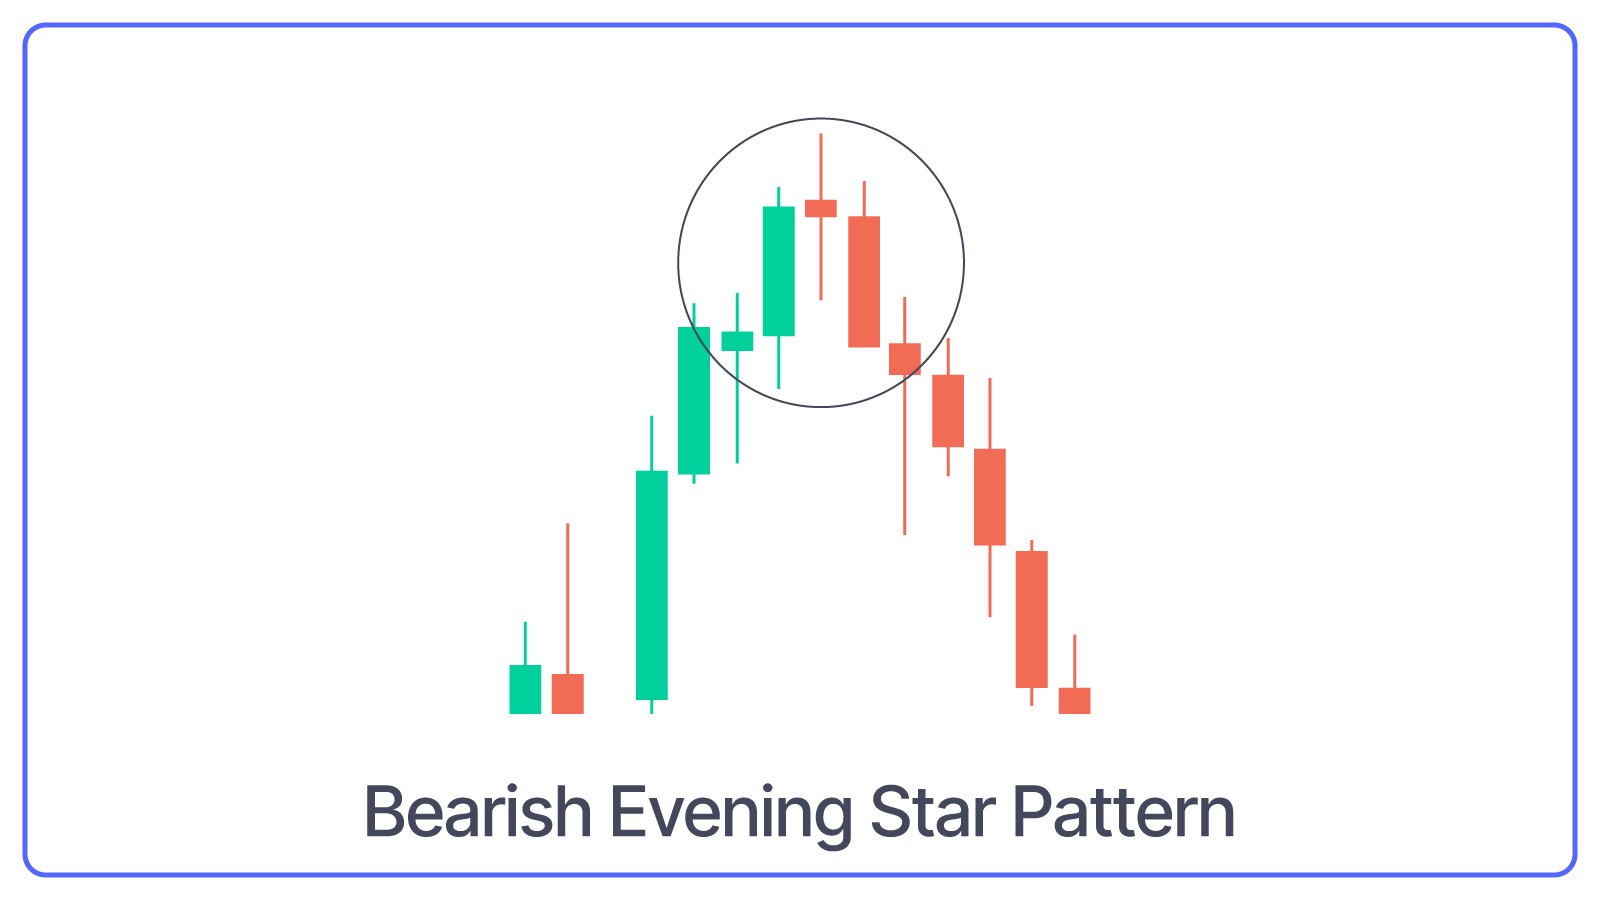
Bearish Evening Star is a three-candlestick pattern that starts with a long bullish candle followed by a small-bodied candle that gaps up and ends with a long bearish candle that closes well into the body of the first candle.
What Bearish Evening Star Pattern Indicates: The uptrend is losing momentum, and a downtrend may be starting.
Bearish Shooting Star Pattern
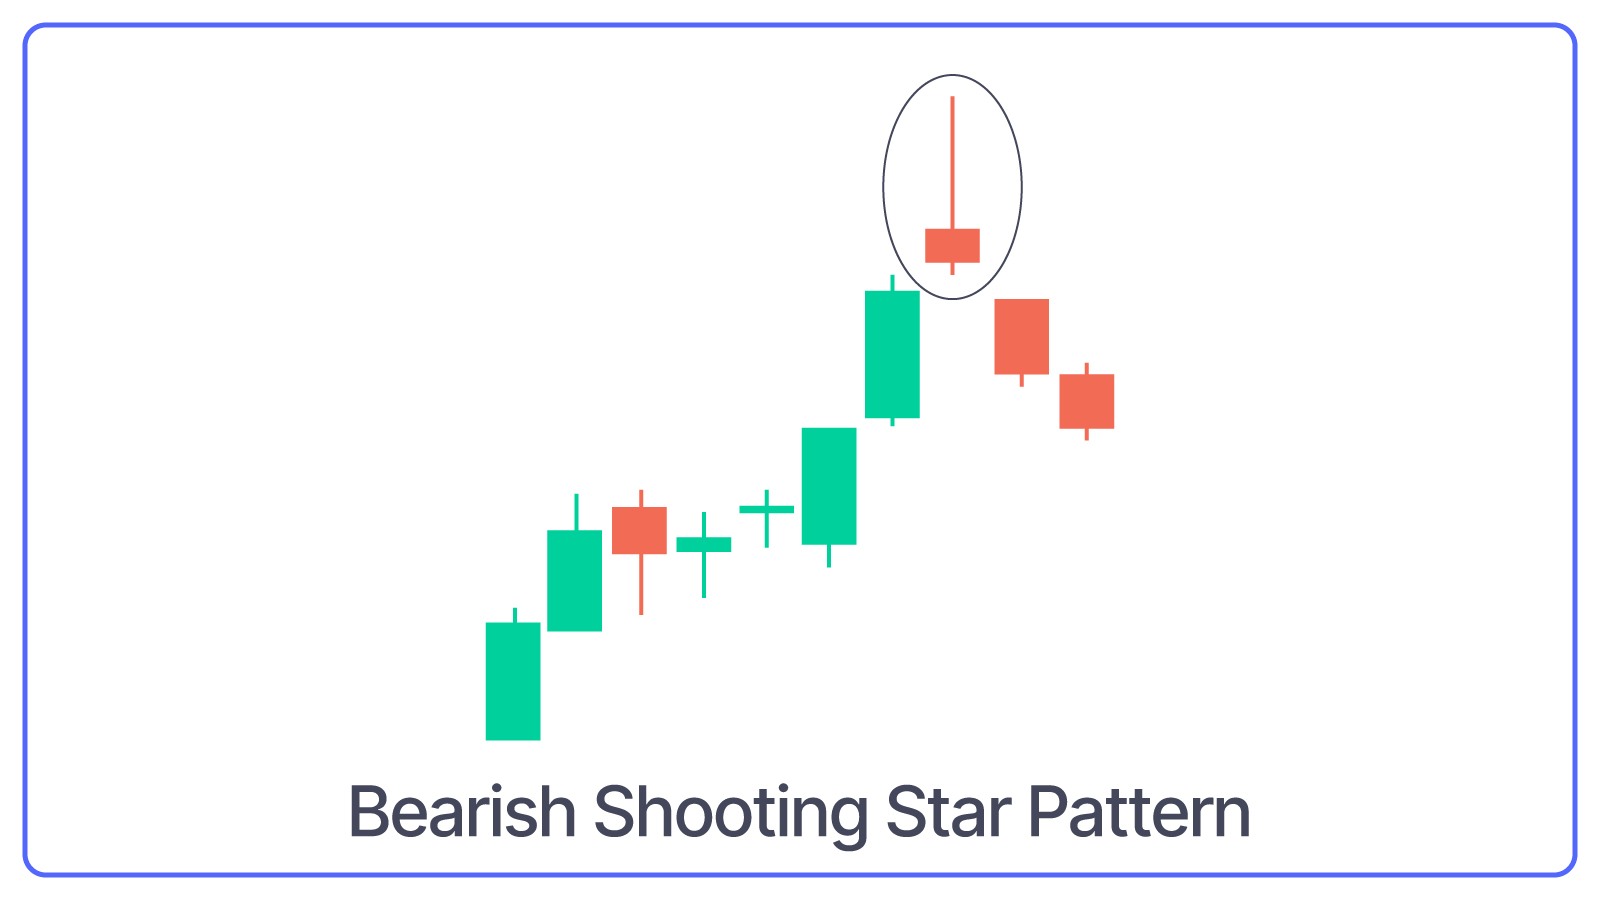
Bearish Shooting Star is a single candlestick pattern with a small body, a long upper shadow, and little to no lower shadow. It appears at the top of an uptrend.
What Bearish Shooting Star Pattern Indicates: The long upper shadow shows that buyers were in control earlier, but sellers took over and pushed the price down, indicating a potential reversal.
Bearish Harami Pattern
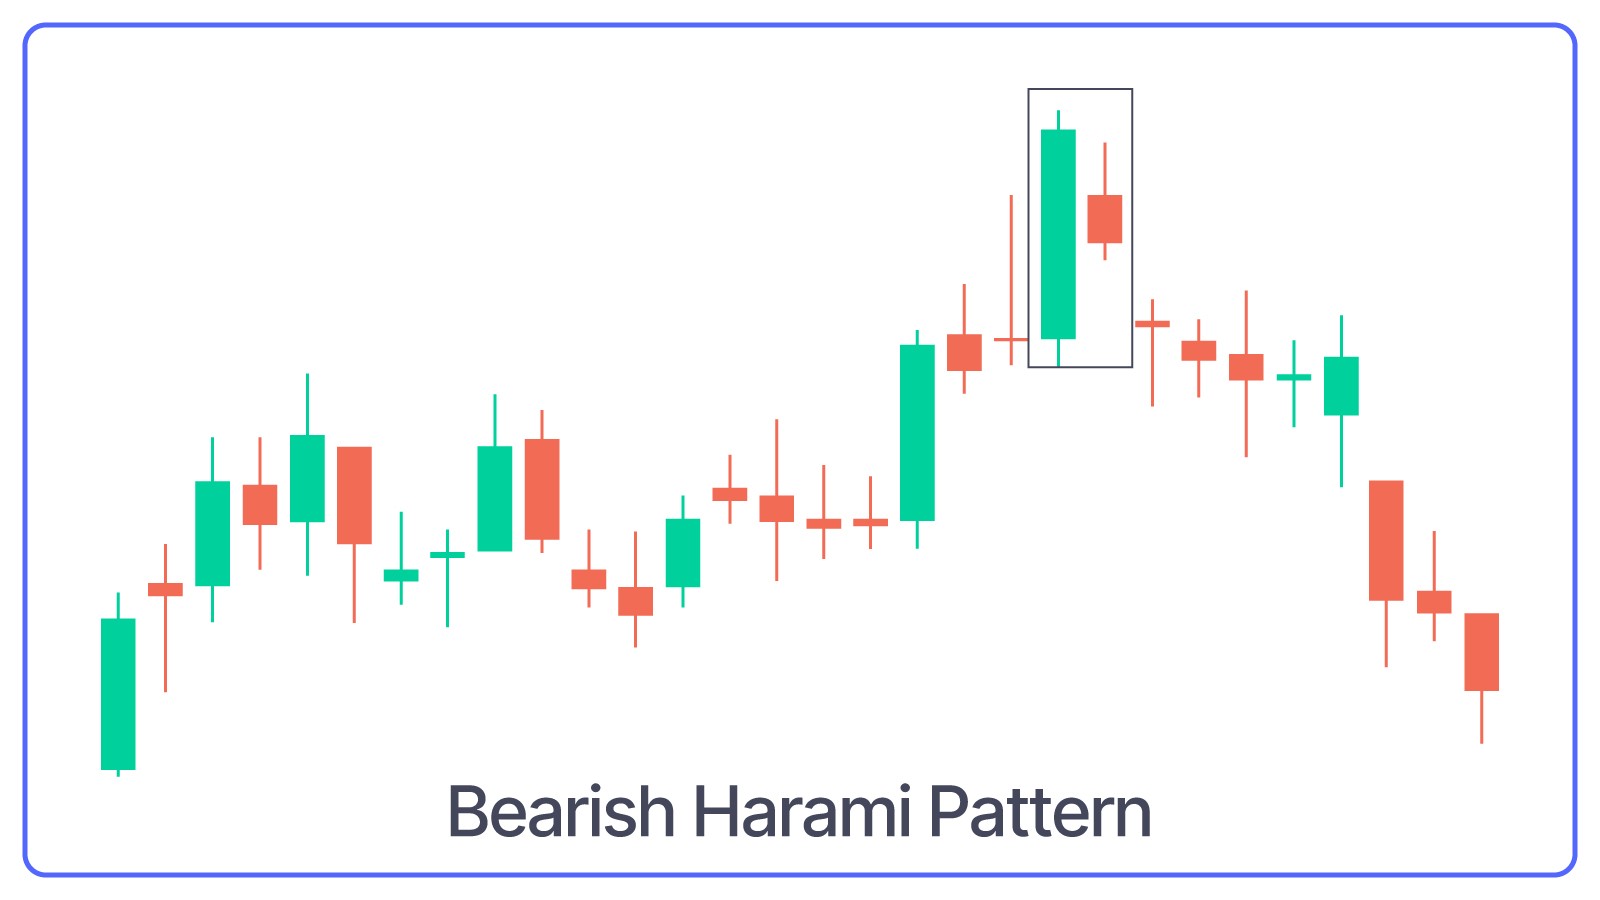
Bearish Harami is a two-candlestick pattern where a small bearish candle is completely engulfed within the body of the previous large bullish candle.
What Bearish Harami Pattern Indicates: Buying pressure is weakening, and a reversal to the downside might be coming.
Bearish Doji Star Pattern
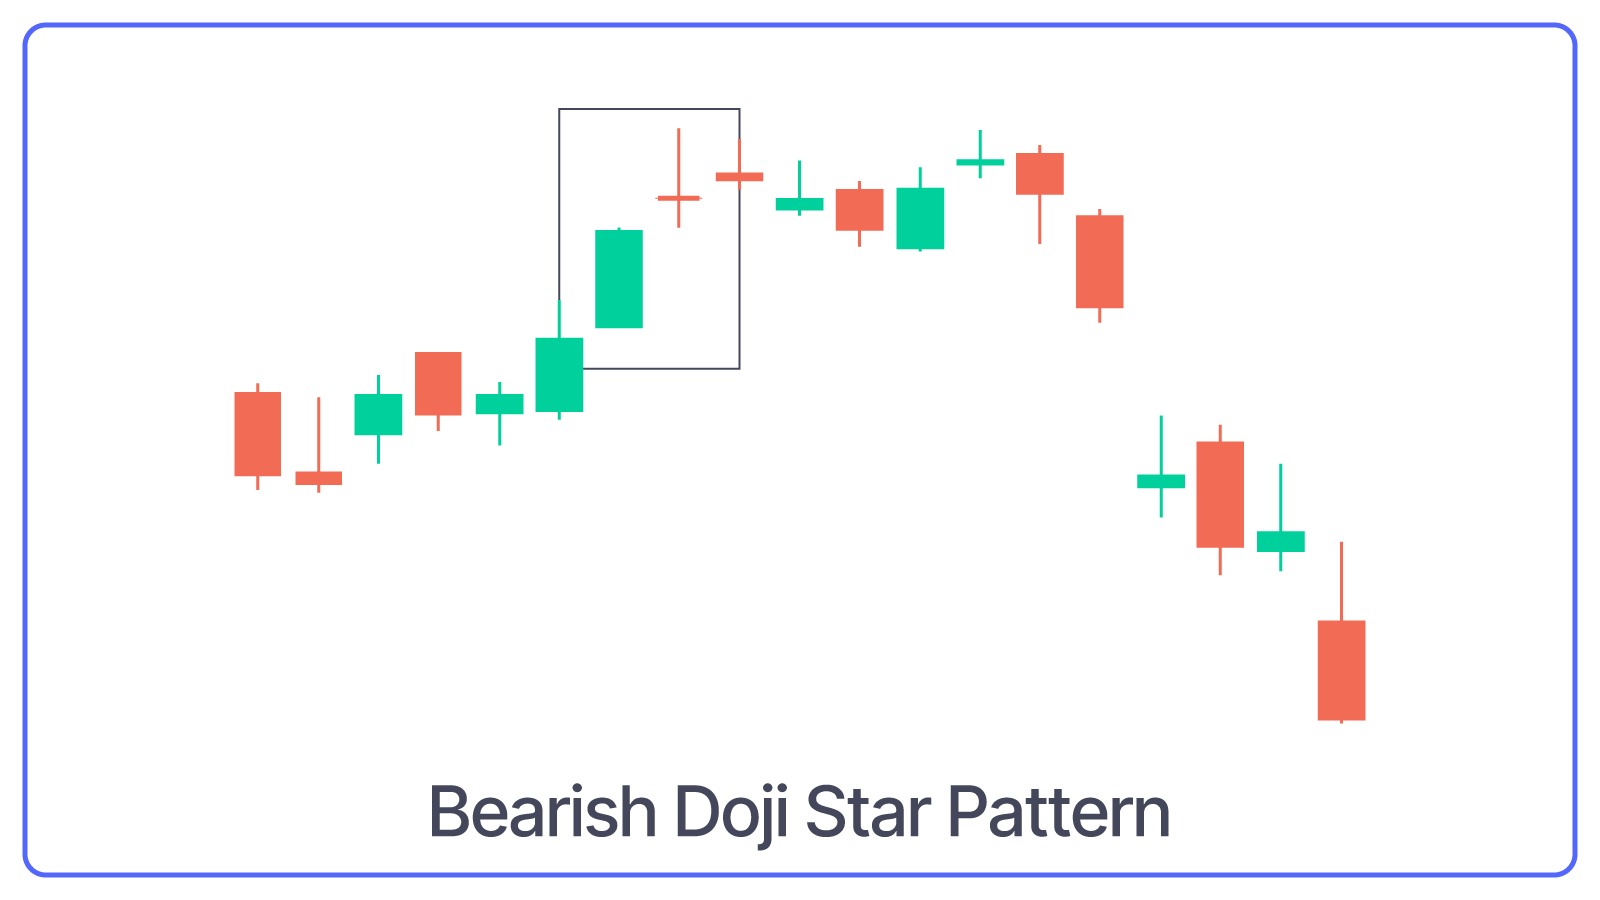
Bearish Doji Star is a two-candlestick pattern that starts with a long bullish candle followed by a Doji (a candle with a very small body).
What Bearish Doji Star Pattern Indicates: The Doji shows indecision in the market, and if it's followed by a bearish candle, it confirms the reversal and signals a potential downtrend.
Bearish Abandoned Baby Pattern
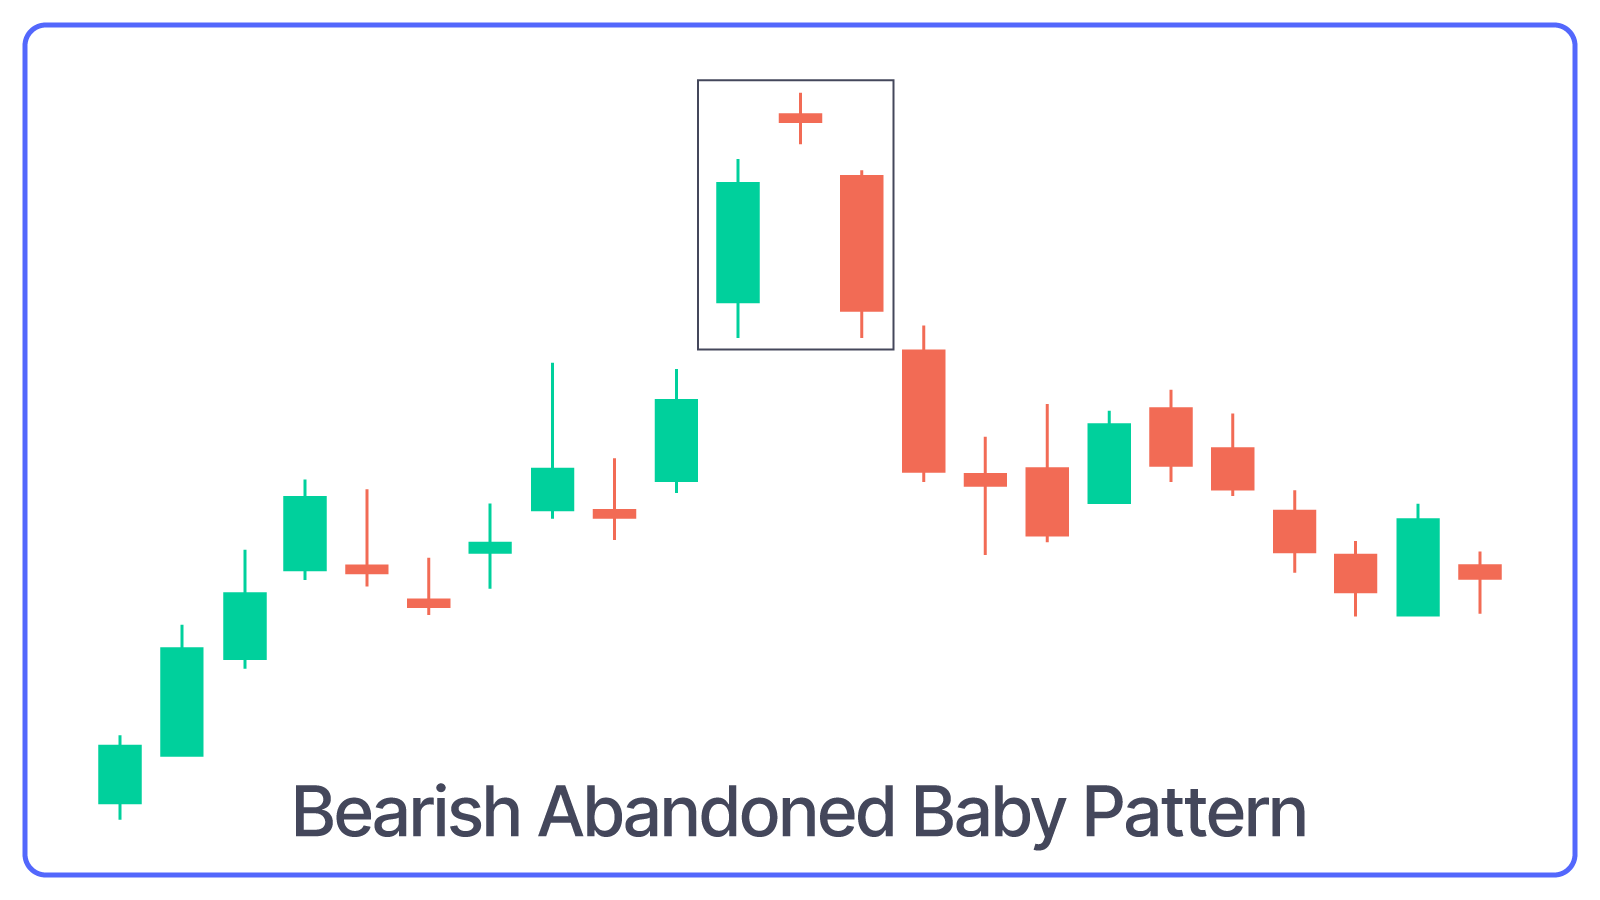
Bearish Abandoned Baby Pattern is a three-candlestick pattern that starts with a long bullish candle, followed by a Doji that gaps up from the previous candle, and ends with a long bearish candle that gaps down from the Doji.
What Bearish Abandoned Baby Pattern Indicates: This pattern indicates a sharp reversal and signals the beginning of a downtrend.
Bearish Tweezer Top Pattern
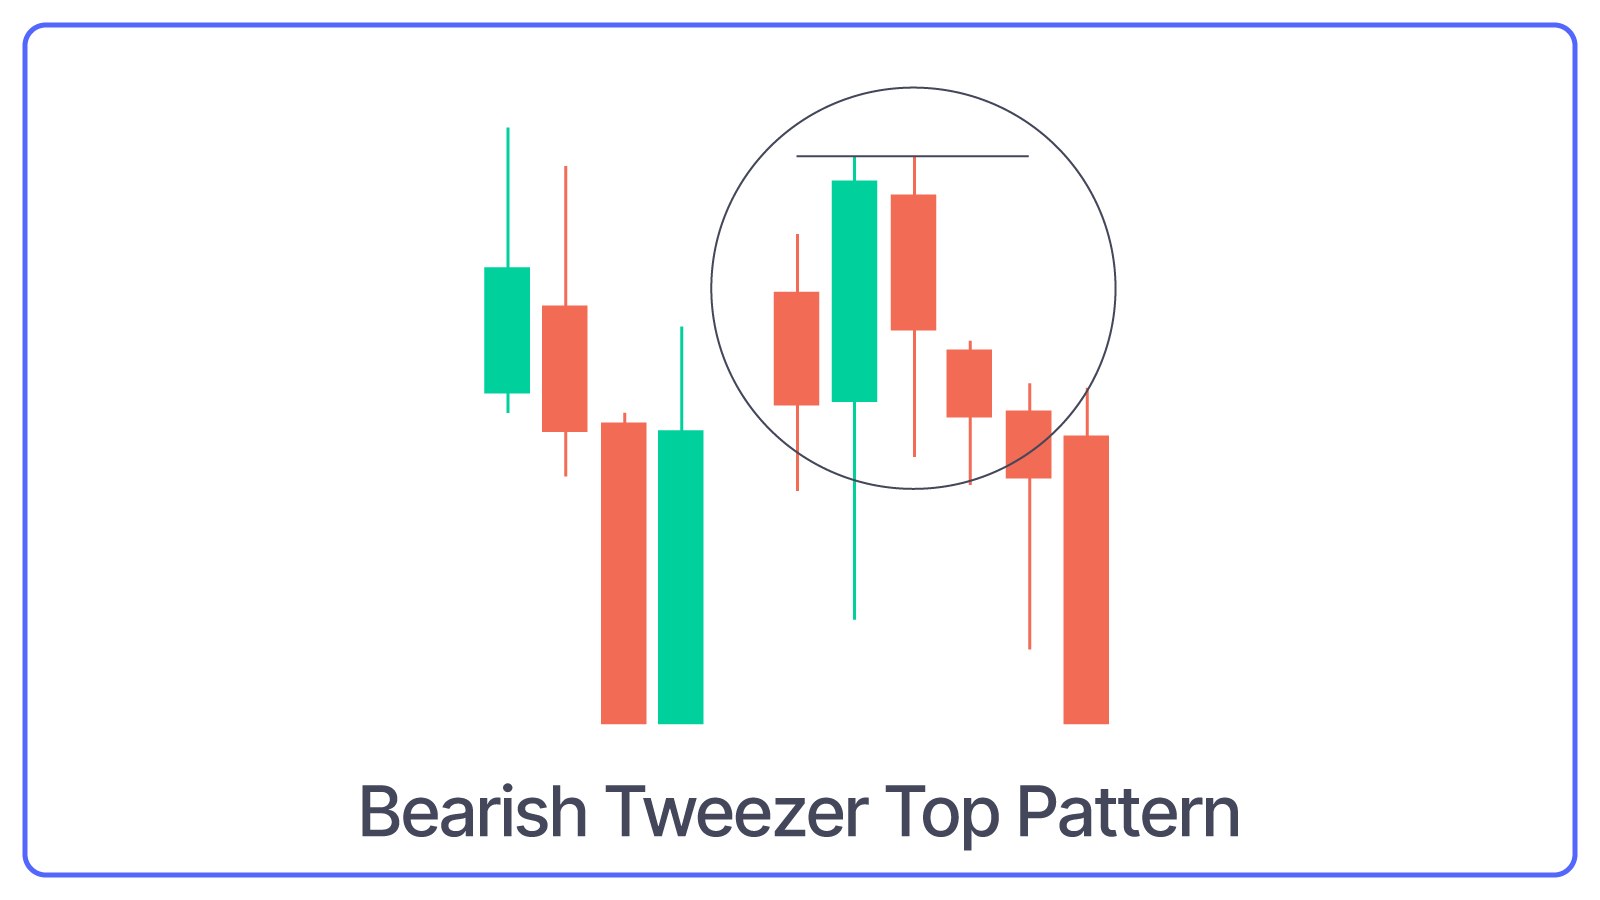
The Bearish Tweezer Tops pattern consists of two or more candles with matching highs and appears at the top of an uptrend. The first candle is usually bullish, and the second candle is bearish.
What Bearish Tweezer Top Pattern Indicates: The matching highs show that the upward momentum is weakening, and a reversal might be coming.
Bearish Kicker Pattern
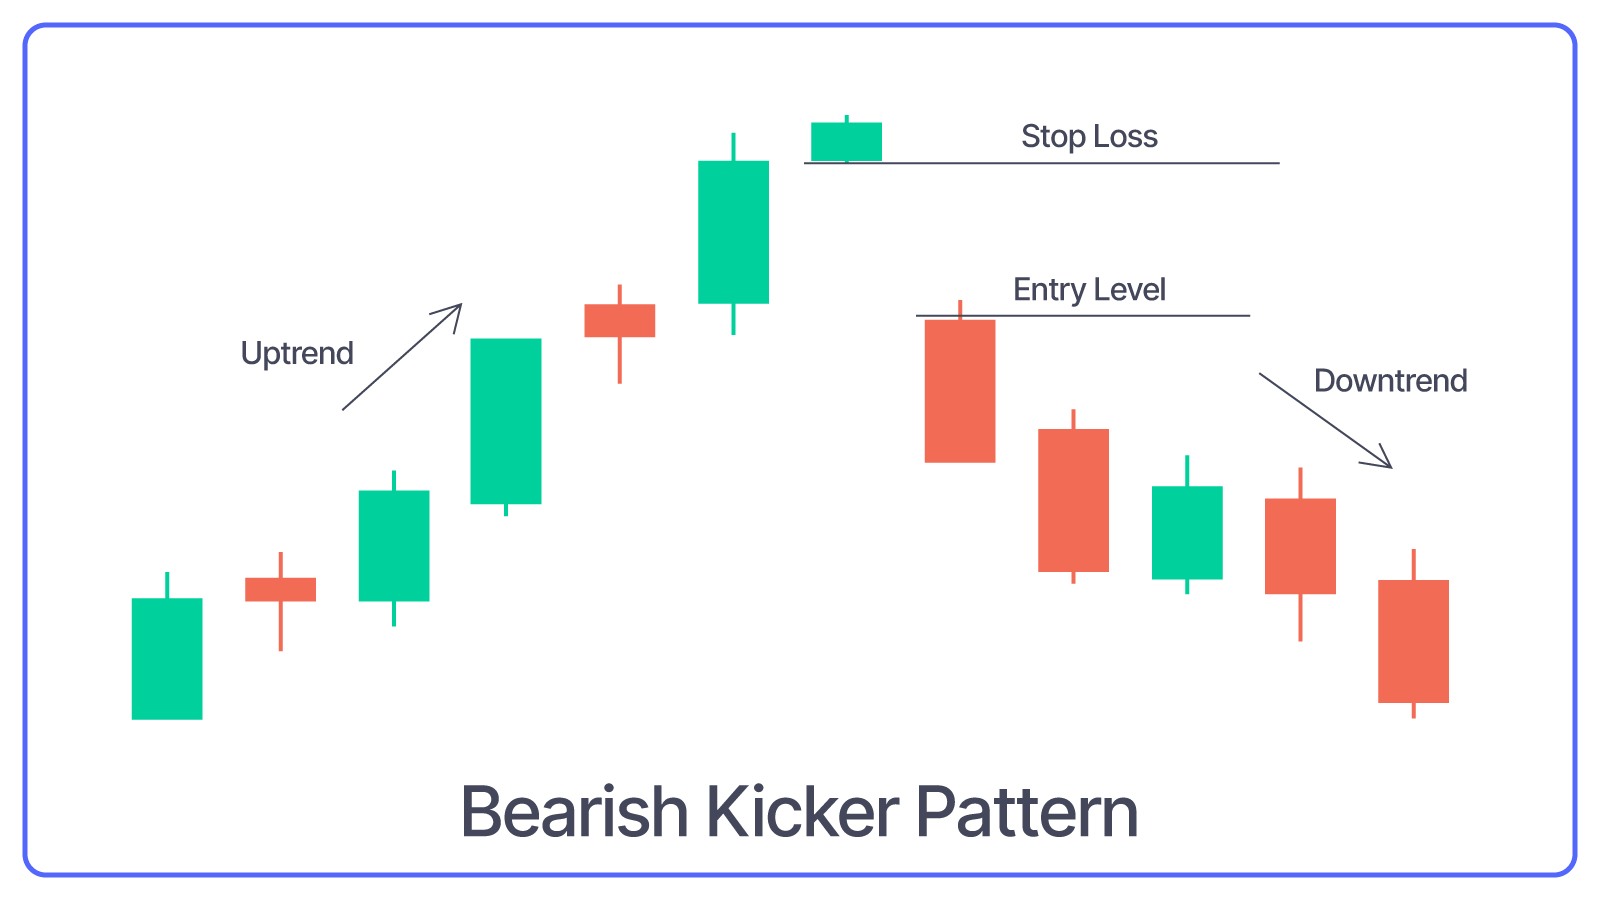
It starts with a long bullish candle, followed by a long bearish candle that opens below the previous candle’s opening price and closes lower.
What Bearish Kicker Pattern Indicates: Dramatic shift in market sentiment and suggests a sudden reversal to the downside.
Bearish Three Inside Down Pattern
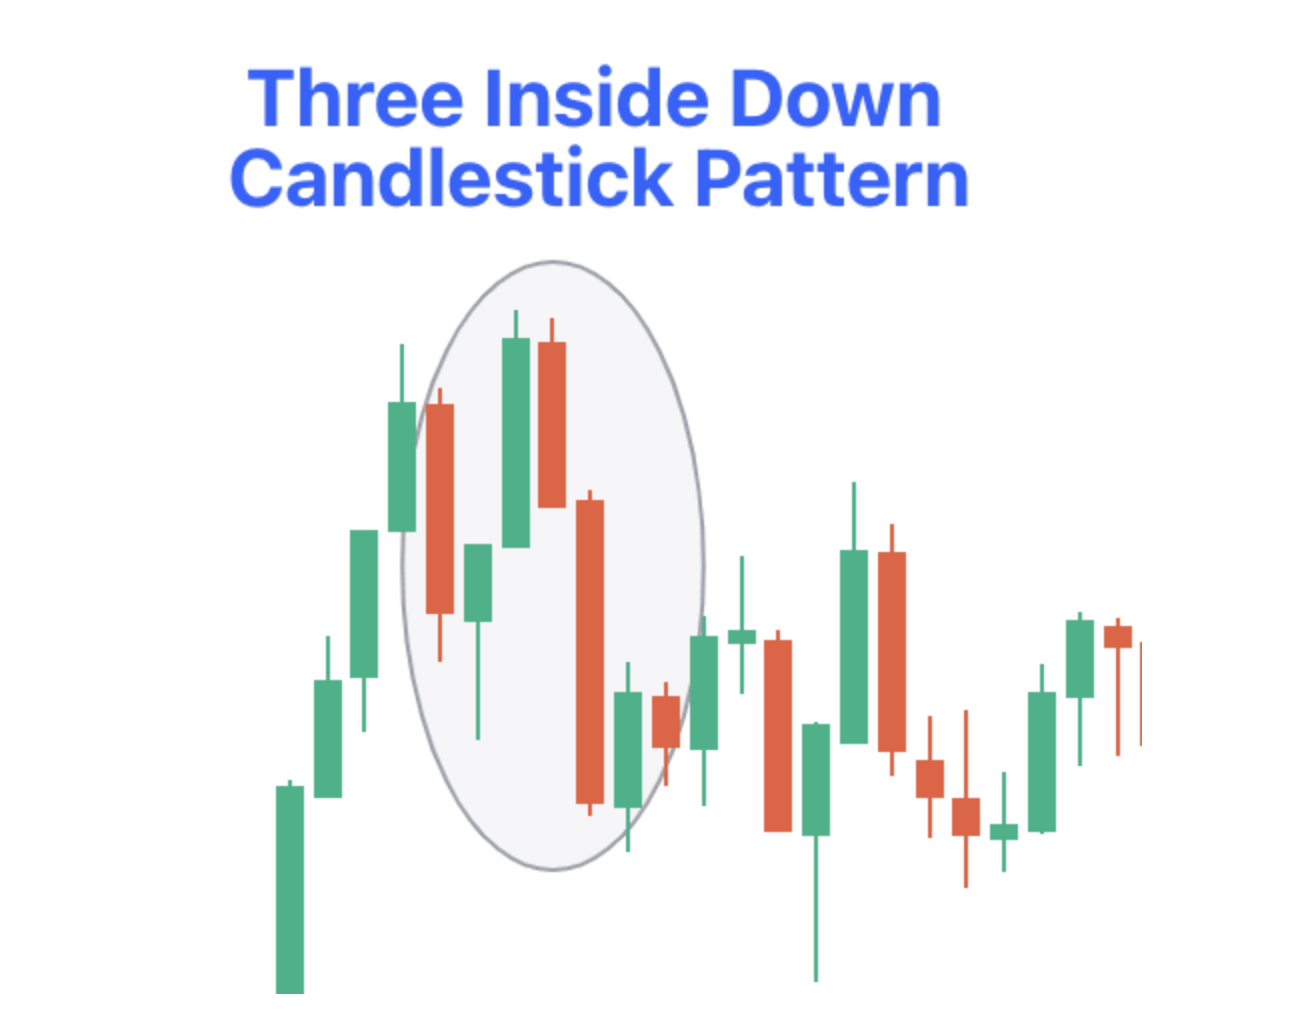
Bearish Three Inside Down is a three-candlestick pattern that starts with a bullish candle, followed by a smaller bearish candle that is completely within the first candle and ends with another bearish candle that closes lower.
What Bearish Three Inside Down Pattern Indicates: Sellers have start gaining dominance over the buyers. This confirms the bearish reversal and signals a potential downtrend.
Bearish Three Outside Down Pattern
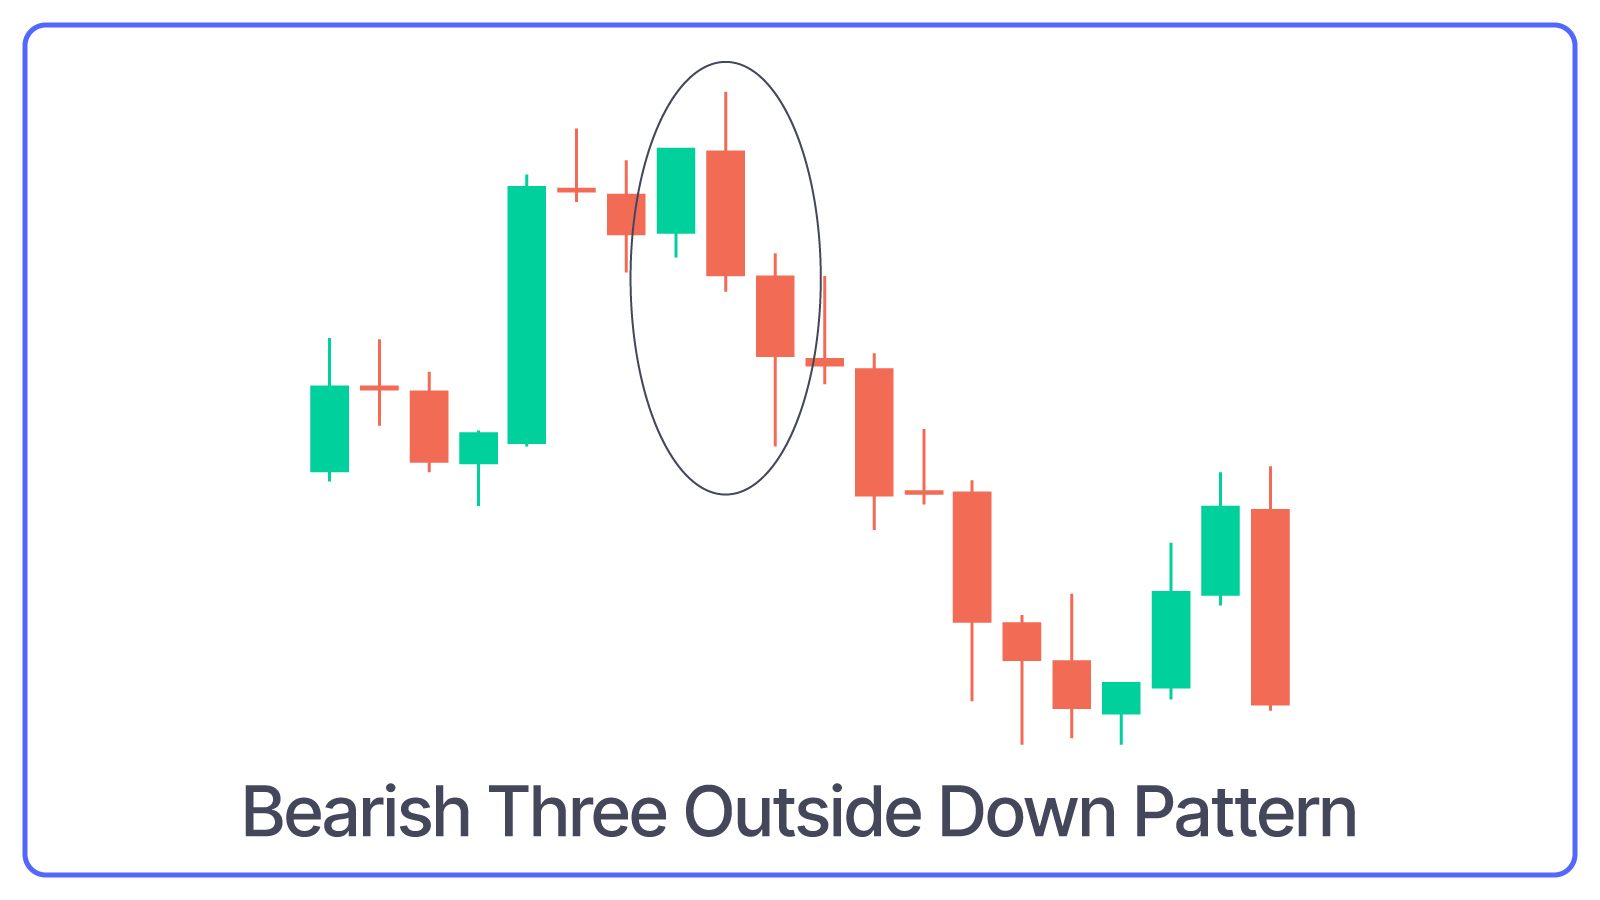
Bearish Three Outside is a three-candlestick pattern that starts with a bullish candle, followed by a bearish candle that engulfs the first candle and ends with another bearish candle that closes lower.
What Bearish Three Outside Down Pattern Indicates: This pattern confirms the strength of the bearish reversal.
Bearish Mat Hold Pattern
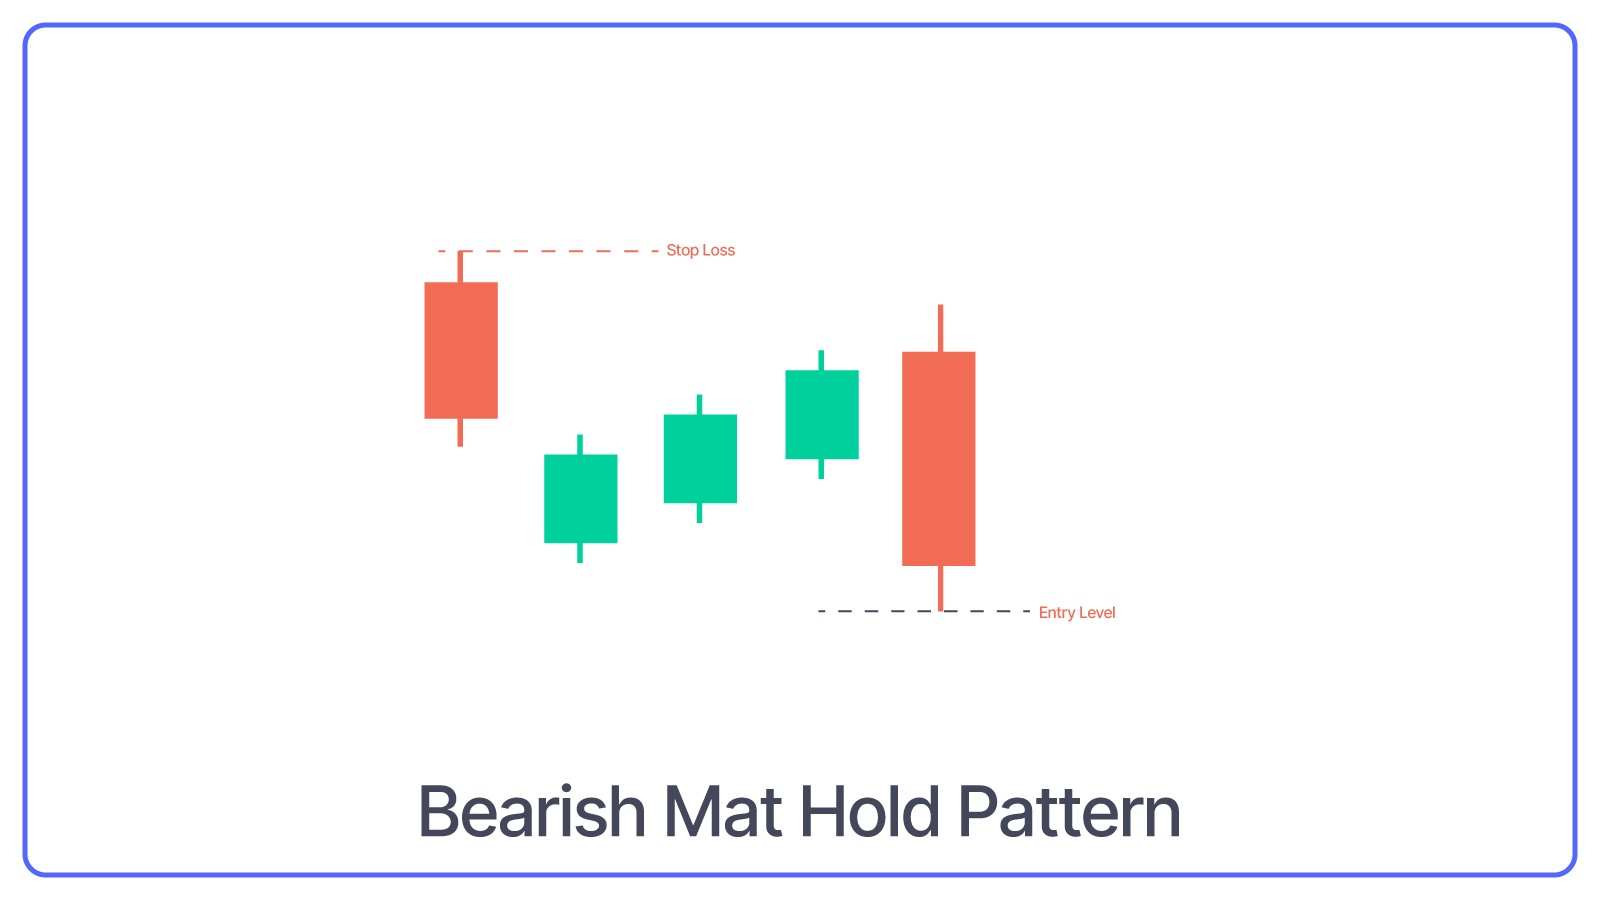
Bearish Mat Hold is a five-candlestick pattern that starts with a long bearish candle, followed by three smaller bullish candles that stay within the range of the first candle and ends with another long bearish candle that closes below the first candle.
What Bearish Mat Hold Pattern Indicates: Brief pause before the downtrend continues.
Dark Cloud Cover Pattern
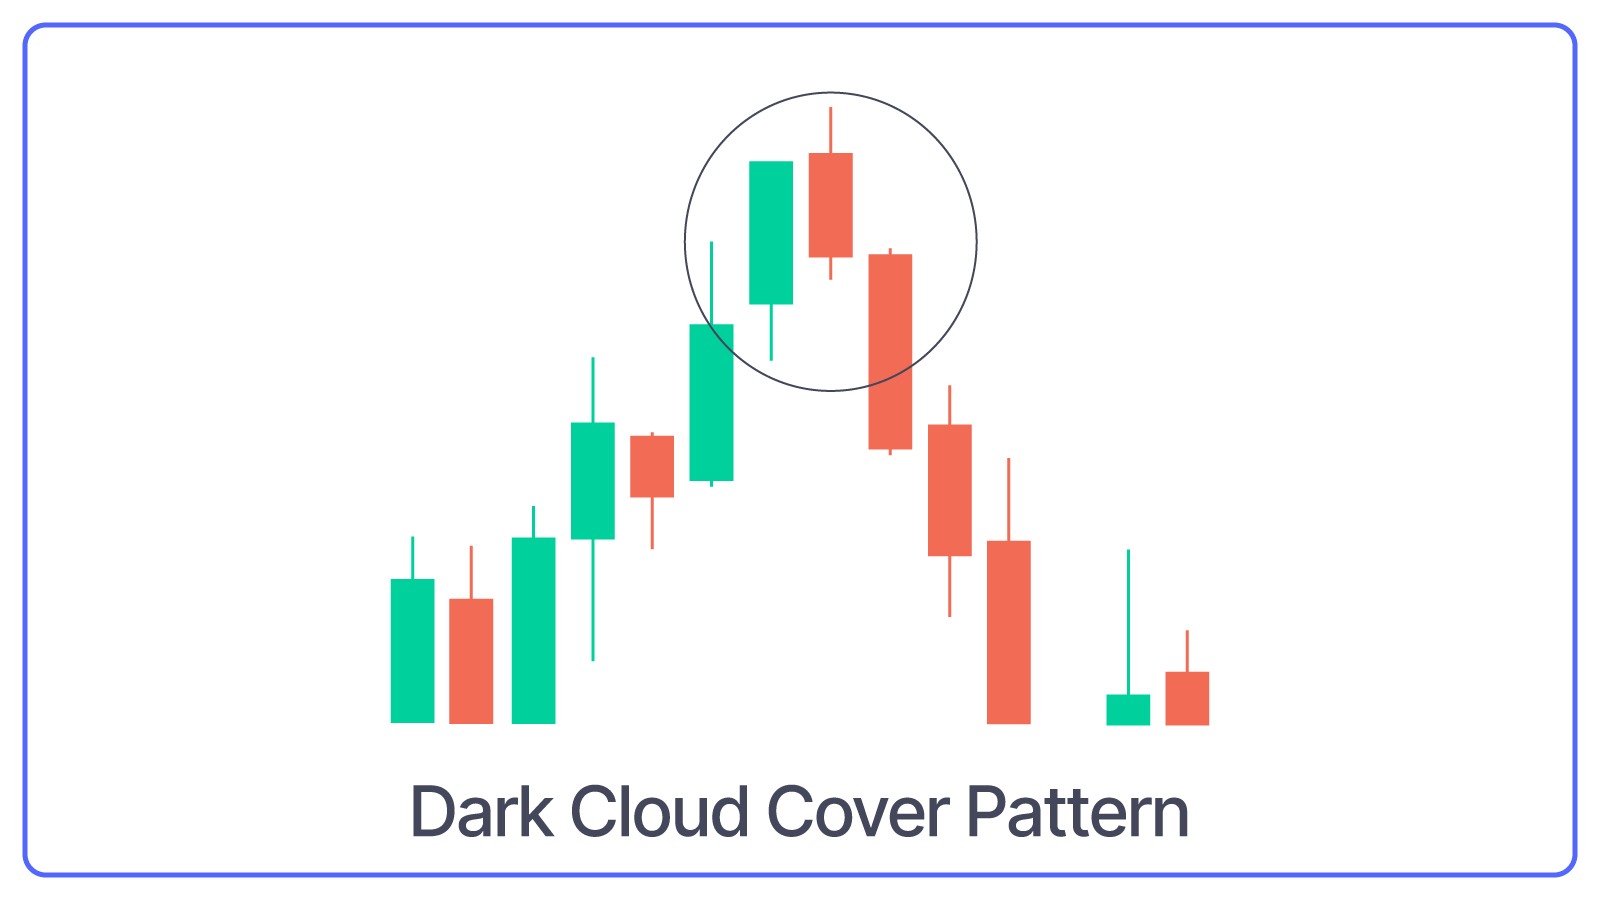
Dark Cloud Cover Pattern forms a long green candle followed by a red candle that opens above the previous high but closes below the midpoint of the green candle.
What Dark Cloud Cover Pattern Indicates: The uptrend might be over, and a downtrend could begin.
Conclusion
To conclude, candlestick patterns are a useful trading tool for understanding market trends and predicting future price movements. They give visual clues whether stock prices might go up or down. By learning to recognise these patterns, you can make better decisions when buying or selling.
However, don’t rely on them alone. Always remember candlestick patterns works best when used with other analysis tools.