What is Shooting Star Candlestick Pattern?
Candlestick patterns are some of the handiest tools that a trader can make use of. With the help of candlestick patterns, traders and investors can gauge market sentiments, understand how price reacts, and also identify trend reversals. A candlestick shows the price movements of an asset within a period. By identifying candlestick patterns, traders can get an idea of how the market will react and plan trades accordingly. In this blog, we will take a look at a candlestick pattern known as the shooting star, how to recognise it, and trade using the pattern.
Check Here to know How to Read Candlestick Charts.
What is a Shooting Star Candlestick Pattern?
Now that we have taken a brief look at what candlestick patterns are, let’s see what a shooting star candlestick pattern is.
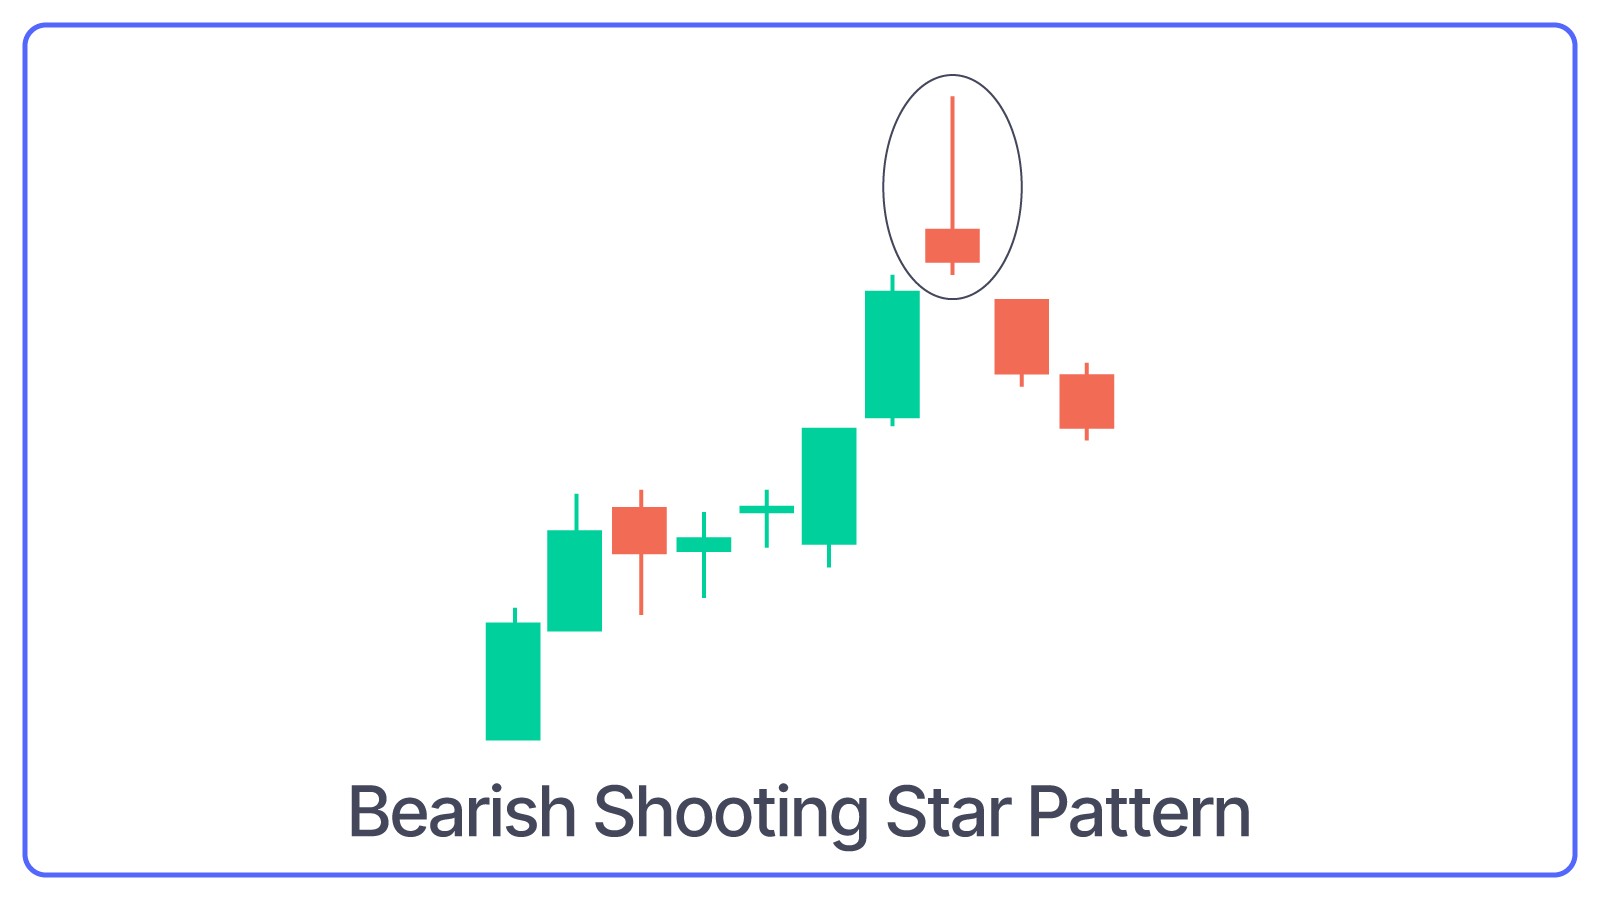
A shooting star candlestick pattern is a reversal pattern that indicates a reversal in trend. The candle forms after an uptrend signaling a reversal and the beginning of a downtrend.
The shooting star candle is called so because of its appearance. The candle has a long upper wick, a small body, and a little to no lower wick.
How to Interpret Shooting Star Candlestick Pattern?
Along with identifying a shooting star candlestick or chart pattern, it is also important to know what it signifies.
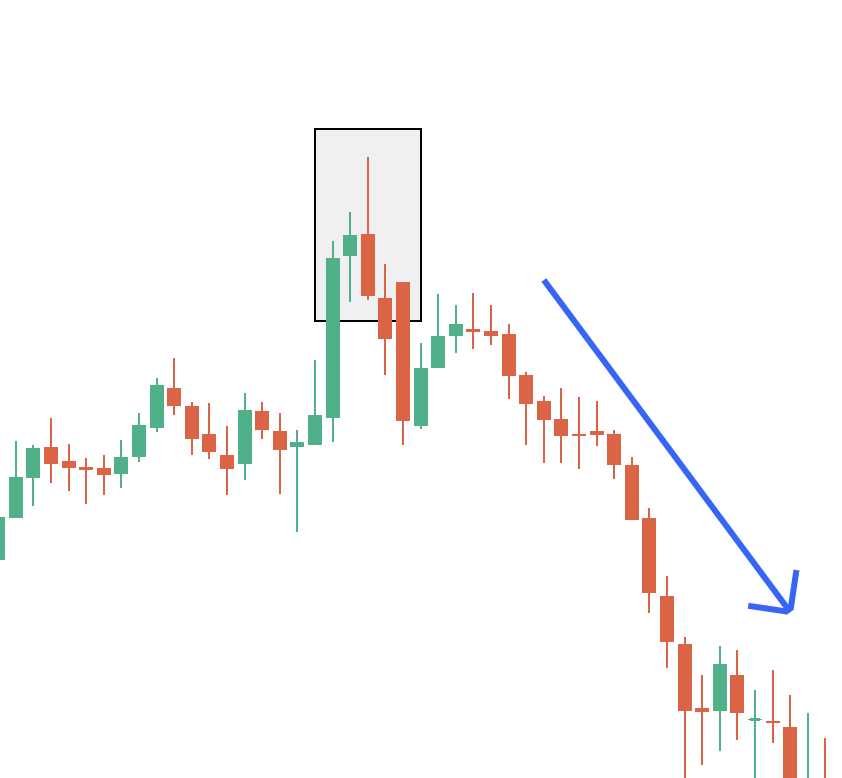
The shooting star candlestick starts with a bullish momentum, which leads to a spike in the price of the asset. Although the price sees an initial surge, it has trouble climbing further as sellers enter the market, pushing down the price. This leads to the formation of the long upper wick signalling resistance for the price to move higher.
With an increase in selling pressure, the bulls fail to take control which results in the body of the candlestick remaining small. When the price moves from higher levels to lower levels within a single candle, it can be taken as a signal of high selling pressure.
The shooting star candle forms at the end of an uptrend or near resistance levels signifying that the current uptrend has ended and a reversal can take place.
How to Trade Using the Shooting Star Chart Pattern?
Identifying the shooting star candle can help traders benefit from the trend reversal. However, knowing how to trade the pattern is crucial. Here’s how to trade the shooting star pattern.
1. Identify the Candle
The first step involves identifying the candle. The shooting star candle will have a long upper wick, a small body, and little to no lower wick. The candle will usually form at the end of an uptrend.
2. Confirmation
Along with the formation of the candle, it is advisable for traders to seek additional confirmation to increase the chances of a profitable trade. Traders can confirm the pattern if there is an increase in trading volume or if the following candle is a bearish candle. If the price crosses the low of the shooting star candle, it can be taken as an additional confirmation as well. Traders can also make use of additional indicators for more confirmation.
3. Entering the Trade
Once the shooting star candle is formed and a trader receives the necessary confirmation, the trader can enter a trade. An aggressive approach consists of entering a trade as soon as the shooting star candle is formed. A conservative approach calls for the formation of a bearish candle after the shooting star candle or the low of the shooting star candle to be broken.
4. Exiting the Trade
Along with entering the trade, it is vital to know when to exit the trade. Placing a stop-loss order above the high of the shooting star candle can help limit losses. Traders can book profits at nearby support levels or use a trailing stop-loss to let the trades run.
Things to Know Before Trading with Shooting Star Candlestick
Here are some pointers that one should keep in mind before trading the shooting star pattern.
- Correctly identify the trend and the candle formation before entering the trade.
- It is important to know that the shooting star pattern may not lead to a reversal every time. Seek additional confirmation before trading.
- Stick to your stop-loss to preserve capital and limit your losses.
- Analyse your past trades to identify winners and losers. Make changes in your strategy accordingly.
Conclusion
Although the shooting star candlestick pattern can be a great indicator to identify trend reversals, it might not always work. Uptrends can usually be long, and one candle may not be enough to indicate that the underlying trend has ended. Even after the formation of a shooting star candle, the price may move further. Therefore, traders should seek additional confirmation before entering a trade. Additionally, keeping a stop-loss order can help limit losses and preserve capital.
Check More Bearish Chart Patterns
|
Bearish Pattern |
Features |
|
It forms when a small bullish candle is followed by a large bearish candle that completely engulfs the previous green candle |
|
|
It is formed when three consecutive long-red candles with small wicks are visible |
|
|
It appears at the top of the uptrend as a single candle with a small body and a long lower shadow |
|
|
It is a three-candlestick pattern that - Starts with a long bullish candle - Followed by a small-bodied candle that gaps up - And ends with a long bearish candle that closes well into the body of the first candle |
|
|
It is a two-candlestick pattern that: - Starts with a long bullish candle followed by a Doji (a candle with a very small body) |
|
|
It is a two-candlestick pattern where: - A small bearish candle is completely engulfed within the body of the previous large bullish candle |
|
|
- It consists of two or more candles with matching highs and appears at the top of an uptrend. - The first candle is usually bullish - And the second candle is bearish |
|
|
- It starts with a long bullish candle - Followed by a long bearish candle that opens below the previous candle’s opening price and closes lower |
|
|
It is a three-candlestick pattern that: - Starts with a bullish candle - Followed by a smaller bearish candle that is completely within the first candle - And ends with another bearish candle that closes lower |
|
|
It is a three-candlestick pattern that - Starts with a bullish candle - Followed by a bearish candle that engulfs the first candle - And ends with another bearish candle that closes lower |
|
|
it is a five-candlestick pattern that: - Starts with a long bearish candle - Followed by three smaller bullish candles that stay within the range of the first candle - And ends with another long bearish candle that closes below the first candle |
|
|
It forms a long green candle followed by a red candle that opens above the previous high but closes below the midpoint of the green candle. |
|
|
It is a three-candlestick pattern that - Starts with a long bullish candle - Followed by a Doji that gaps up from the previous candle - And ends with a long bearish candle that gaps down from the Doji. |