Hammer Candlestick Patterns
Candlestick patterns are dependable indicators of price movement. Though it originated in Japan, traders throughout the world use it as a technical trading tool to visualize the opening, closing, high, and low prices of a day in long candle-shaped patterns with upper and lower shadows. The hammer candlestick is a price pattern candlestick that belongs to the same legion.
Check Here to know How to Read Candlestick Charts.
What is a Hammer Candlestick?
Hammer candlestick meaning: One of the most popular patterns in technical analysis is the hammer candlestick pattern. Price action traders can use hammer candles to predict probable reversals after bullish or bearish trends. These candle patterns may indicate a bullish reversal at the conclusion of a downtrend or a negative reversal after an upswing, depending on the context and timing. Hammer candles, when combined with other technical indicators, can provide traders with favourable entry points for long and short positions.
The hammer and inverted hammer are bullish hammer candles that come after a downturn. The hanging man and the shooting star are bearish hammer candle types that appear after an uptrend.
Hammer Candlestick Patterns Explained
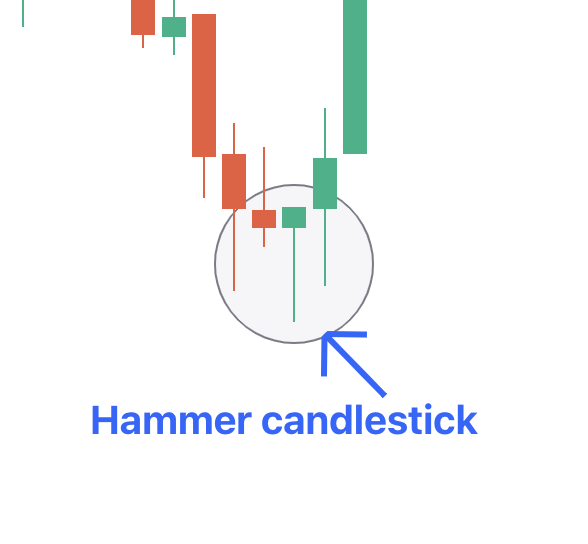
The hammer candlestick pattern is a one-of-a-kind candlestick pattern that signals a possible trend reversal. The hammer is associated with the return of a positive trend in the market because it forms a downtrend. It's a short green candle with a lengthy bottom shadow, indicating lower market price rejection. Although the Bullish Hammer is more popular, traders also recognize another hammer-like pattern known as the Inverted Hammer.
In a downturn, the hammer candlestick appears, indicating a bullish turnaround. It resembles a hammer because it has a real short body and a long downward wick. It's a green candle, as opposed to the previous red ones. The closing price is greater than the beginning price, and the extended shadow shows that the seller entered the market early. However, the market finally rejects the low price, and the bull force pushes the price higher.
Importance of Hammer Candlestick Patterns
- It could be used as a leading intraday indicator to signal a change in bullish/bearish momentum.
- This indication can either confirm or disprove the existence of a notable high or low. – Before closing back towards open, the price moves higher or lower, "hammering" out a top or bottom.
- The length of the shadow (preferably 2-3 times the size of the body) and the duration have increasing significance.
- Other reversal indicators may be confirmed or strengthened by hammers (i.e., may occur as part of the tweezer formation, or next to Doji, etc.)
- A hammer fails when the following candle makes a new high, and a hammer bottom fails when the next candle makes a new low.
Types of Hammer Candlestick
Here are the types of hammer candlesticks:
1) Hammer Candlestick Pattern
If the closing price is much greater than the opening price, a bullish candlestick hammer is produced, indicating that buyers had control of the market before the end of the trading period.
2) Inverted hammer candlestick pattern
If the opening price is lesser than the closing price - an inverted hammer is formed. The extended wick above the body indicates that there was some buying pressure pushing the price higher, but it was eventually dragged back down before the candle closed. The inverted hammer candle, while not as bullish as the ordinary hammer candle, is a bullish reversal pattern that comes after a decline.
Interpretation of Hammer Candlesticks
When traders see a hammer, they assume a trend reversal. It happens if the price of the asset falls, signalling that the market is looking for a bottom and a change in momentum. The formation of a hammer candlestick in a downtrend indicates that the market had an active day - the price sank after opening but then rose to close higher than the opening price – all in one time. The hammer's position also reveals significant information.
If three or more bearish candles precede it, traders consider it a strong indicator. In addition, the next candle that forms after the hammer candlestick should operate as a confirmation and must shut above the hammer candle's closing. When all of these events coincide, traders can see this as a strong enough indicator of a likely trend reversal and enter a long position.
Traders take positions to enter the market during the formation of the confirmation candle. Hammer candlestick patterns, like other candle formations, should not be treated on their own.
Check More Bullish Candlestick Patterns
|
Bullish Pattern |
Features |
|
A reversal pattern which consists of: - A small bearish candle followed by a - Larger bullish candle. |
|
|
A reversal pattern which consists of: - It starts with a long bearish candle - Followed by a small-bodied candle (either bullish or bearish) - And ends with a long bullish candle. |
|
|
- A strong bearish candle followed by a bullish candle. - Second candle opens below the previous candle's close but closes above the midpoint (50%) of the previous bearish candle. |
|
|
- It is is a two-candlestick pattern that signals a possible upward trend reversal. - Small bullish candle is completely contained within the body of the previous large bearish candle. |
|
|
- It consists of three long bullish candles with small wicks that appear consecutively one after another. - Each new candle opens inside the previous one’s body and closes higher than the last. |
|
|
A reversal pattern which: - Appears at the bottom of a downtrend - A small body with a long upper shadow and little to no lower shadow. |
|
|
A reversal pattern which consists of: - A single candlestick pattern - A very small body and a long lower shadow that appears at the bottom of a downtrend |
|
|
- It consists of a long bearish candle - Followed by a doji candle that gaps down - And then a long bullish candle that gaps up. |
|
|
A three candlestick pattern with: - A large bearish candle, - A small bullish candle that closes above the 50% level of the first candle and - A third bullish candle that closes above the first candle's open. |
|
|
Starts with a bearish candle - Followed by a bullish candle that engulfs the first candle - Ends with another bullish candle that closes higher. |
|
|
- Starts with a long bearish candle - Followed by an even longer bullish candlestick. The candle opens higher than the previous day's closing price and rises even more. |
|
|
A two-candlestick pattern that includes: - Two equal-sized bullish and bearish candles. |
|
|
It consists of five candles in a continuation pattern - A long bullish candle - Three small bearish candles that trade above the low and below the high of the first candlestick - And another long bullish candle that closes above the high of the first candlestick. |
|
|
It is similar to the rising three methods pattern consisting of five candles - It starts with a long bullish candle - Followed by three small bearish candles (a smaller bearish candles that move lower) that stay within the range of the first candle - And end with another long bullish candle that closes above the high of the first candle. |