Hanging Man Pattern
In the stock market, traders can use various tools to find good trading opportunities. Among these, candlestick patterns are some of the oldest and most trusted methods. Within this cluster is the Hanging Man Pattern, which is simple and easy to grasp. This single-candle pattern shows up at the end of an upward trend, suggesting the uptrend might be coming to an end and a downward move might begin soon.
In this article, we will explain the Hanging Man Pattern and look at the trading options it offers.
Check Here to know How to Read Candlestick Charts.
What is a Hanging Man Candlestick Pattern?
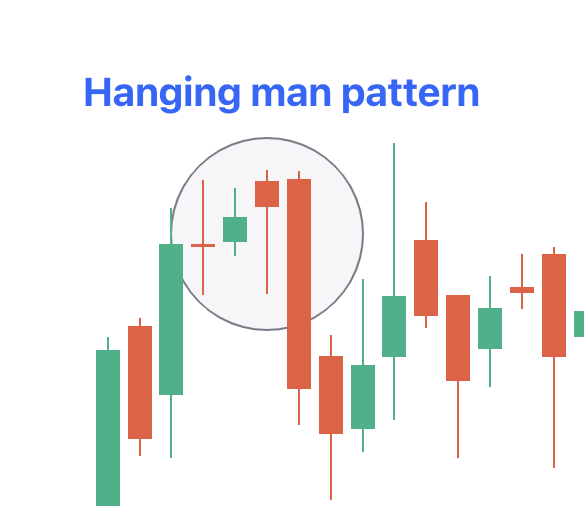
The Hanging Man candlestick pattern has a small body with a short wick on top and a long shadow below. It may even have no wick at all. If the candlestick is green or white, it means the stock price closed higher than the level at which it opened. If it's red or black, it closed lower than where it opened.
The Hanging Man Candlestick Pattern is seen by traders as a sign of the market getting set to fall.
Here are some important aspects to look for when recognising this pattern on the candlestick charts:
- The lower shadow should be at least twice as long as the body of the candlestick.
- The body of the candlestick should be near the top.
- There should be little to no upper shadow.
Types of Hanging Man Candlestick Pattern
The Hanging Man Pattern can be classified into two types based on colour. These are:
-
Red Hanging Man Candlestick
In this pattern, the body is red because the closing price is lower than the opening price. This indicates a stronger bearish signal, meaning sellers have taken control during that period.
-
Green Hanging Man Candlestick
In this pattern, the body is green because the closing price is higher than the opening price. This suggests that buyers are losing strength, which may give sellers a chance to take over.
Although colour isn't the most important factor when trading, a red hanging man usually signals a stronger potential reversal than a green one because it shows that the price closed is lower than it opened.
How to Identify a Hanging Man Candlestick Pattern?
The Hanging Man pattern has these following traits. But keep this in mind – it needs to show up after an upward trend to count as a Hanging Man:
- Body: The candle has a tiny body close to the bottom of the price range. It might be red or green, though it's often red. This little body shows buyers and sellers were unsure.
- Lower Wick: The lower shadow stretches below the body and marks the lowest price during that time. It's about two times as long as the body and can stretch even further. This long shadow means sellers pushed the price down a lot.
- Upper Wick: The Hanging Man lacks an upper wick or has a very short one. A tiny upper wick, if present, suggests there wasn't much buying pressure backing up the idea that the market might head south.
How to Use Hanging Man Pattern in Trading?
To trade using the Hanging Man Candlestick Chart Pattern, make sure it appears after an uptrend. Once that's confirmed, you can consider taking a short position. Here’s how:
-
Entry
Wait-and-see: Wait for the next candle to close below the Hanging Man before entering a short position.
Aggressive: Enter a short position as soon as the next candle starts trading below the Hanging Man, without waiting for it to close.
-
Stop Loss
If the price rises above the high of the Hanging Man, consider closing your short position. If the body of the Hanging Man is small, set a stop-loss based on the risk-to-reward ratio from the last resistance level.
-
Profit Target
There isn’t a set method for setting a profit target with the Hanging Man Pattern. You can use the risk-reward ratio, the next resistance level, or a trailing stop-loss to take profits.
Hanging Man Candlestick Pattern – Advantages & Disadvantages
Refer to the table below to know the advantages and disadvantages of hanging man pattern of candlesticks:
|
Hanging Man Candlestick Pattern |
|
|
Advantages |
Disadvantages |
|
|
|
|
|
|
Check More Bearish Chart Patterns
|
Bearish Pattern |
Features |
|
It forms when a small bullish candle is followed by a large bearish candle that completely engulfs the previous green candle |
|
|
It is formed when three consecutive long-red candles with small wicks are visible |
|
|
It is a three-candlestick pattern that - Starts with a long bullish candle - Followed by a small-bodied candle that gaps up - And ends with a long bearish candle that closes well into the body of the first candle |
|
|
It is a reversal strategy which: - Is a single candlestick pattern with a small body, a long upper shadow, and little to no lower shadow |
|
|
It is a two-candlestick pattern that: - Starts with a long bullish candle followed by a Doji (a candle with a very small body) |
|
|
It is a two-candlestick pattern where: - A small bearish candle is completely engulfed within the body of the previous large bullish candle |
|
|
- It consists of two or more candles with matching highs and appears at the top of an uptrend. - The first candle is usually bullish - And the second candle is bearish |
|
|
- It starts with a long bullish candle - Followed by a long bearish candle that opens below the previous candle’s opening price and closes lower |
|
|
It is a three-candlestick pattern that: - Starts with a bullish candle - Followed by a smaller bearish candle that is completely within the first candle - And ends with another bearish candle that closes lower |
|
|
It is a three-candlestick pattern that - Starts with a bullish candle - Followed by a bearish candle that engulfs the first candle - And ends with another bearish candle that closes lower |
|
|
it is a five-candlestick pattern that: - Starts with a long bearish candle - Followed by three smaller bullish candles that stay within the range of the first candle - And ends with another long bearish candle that closes below the first candle |
|
|
It forms a long green candle followed by a red candle that opens above the previous high but closes below the midpoint of the green candle. |
|
|
It is a three-candlestick pattern that - Starts with a long bullish candle - Followed by a Doji that gaps up from the previous candle - And ends with a long bearish candle that gaps down from the Doji. |