Three Outside Up Candlestick Pattern
The Three Outside Up pattern is a chart pattern that shows a possible trend change. It appears during a downtrend and takes three days to form. The pattern consists of three candles that appear one after another, usually at the end of the downtrend. Here, we will understand everything about the Three Outside Up Candlestick Pattern.
What is a Three Outside Up Candle Pattern?
The Three Outside Up Candle Pattern is a chart pattern with three candles that usually appear after a downtrend. It helps show if a trend might be about to change. The pattern starts with one bearish candle and is followed by two bullish candles. Spotting this pattern correctly is important for successful counter-trend trading.
The Three Outside Up candlestick pattern has the following features:
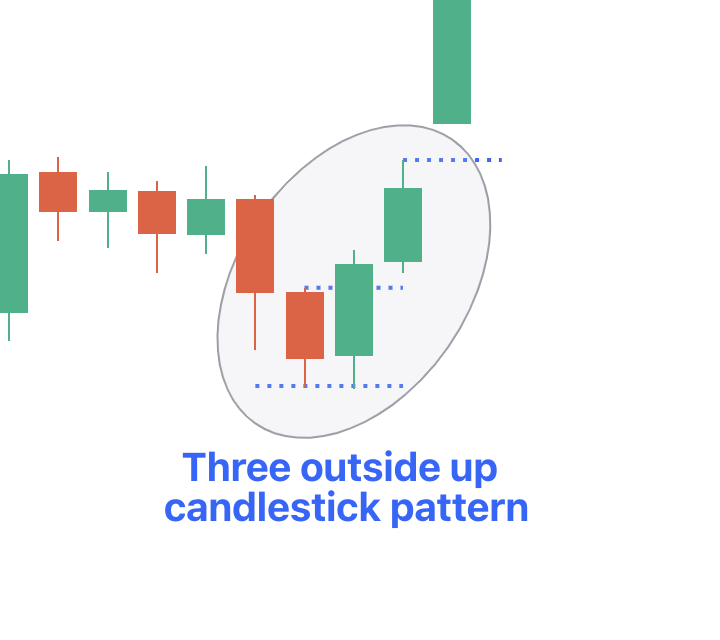
- The market is going down.
- The first candle is bearish.
- The second candle is bullish and covers the first candle completely.
- The third candle is bullish and closes higher than the second candle.
Check Here to know How to Read Candlestick Charts.
How to Identify the Three Outside Up Pattern?
Here's how you can identify the Three Outside Up Candle Pattern:
- Red Candle: The first candle is a short red one, showing that bulls and bears are battling during a downtrend.
- Green Candle: The second candle is a large green one that covers the red candle, showing that bulls are now in control and a trend reversal might be coming.
- Third Candle: The third candle is green and closes higher than the second one, signalling the start of a bullish trend.
How to Trade Using the Three Outside Up Candlestick Pattern?
In order to trade using the Three Outside Up candlestick pattern, you need to follow these criteria:
- Check Market Conditions: Before making a trade, look at the overall market conditions. Don’t trade until you get confirmation from other indicators.
- Confirm the Pattern: Make sure the Three Outside Up pattern has formed correctly at the end of a downtrend. This pattern includes three candlesticks.
- Buy the Stock: Buy the stock above the high of the third candle, but wait until the next candle (the fourth one) to make your move.
- Set Stop Loss: Place your stop loss just below the low of the second candle to limit your risk.
- Profit Target: Decide when to take profits based on your strategy. You can exit when the price reaches a 1:2 risk/reward ratio, hits a set profit percentage, or wait until the trend changes.
What do Traders Interpret from a Three Outside Up Candle Pattern?
Here's what traders look for In the Three Outside Up Candlestick pattern:
- The first candle closes lower than it opened, showing strong selling.
- The second candle starts low but goes up, warning bears that a trend change might occur.
- When the stock price rises above the range of the first candle, it confirms a bullish trend. This pattern suggests buying, especially if the price hits a new high.
Advantages & Disadvantages of Three Outside Up Candle Pattern
Refer to the table below to learn about the advantages and disadvantages of three outside up candle pattern:
|
Three Outside Up Candlestick Pattern |
|
|
Advantages |
Disadvantages |
|
|
|
|
|
|
Check More Bullish Candlestick Patterns
|
Bullish Pattern |
Features |
|
A reversal pattern which consists of: - A small bearish candle followed by a - Larger bullish candle. |
|
|
A reversal pattern which consists of: - A small body candle, and - Long lower shadow/wick |
|
|
A reversal pattern which consists of: - It starts with a long bearish candle - Followed by a small-bodied candle (either bullish or bearish) - And ends with a long bullish candle. |
|
|
- A strong bearish candle followed by a bullish candle. - Second candle opens below the previous candle's close but closes above the midpoint (50%) of the previous bearish candle. |
|
|
- It is is a two-candlestick pattern that signals a possible upward trend reversal. - Small bullish candle is completely contained within the body of the previous large bearish candle. |
|
|
- It consists of three long bullish candles with small wicks that appear consecutively one after another. - Each new candle opens inside the previous one’s body and closes higher than the last. |
|
|
A reversal pattern which: - Appears at the bottom of a downtrend - A small body with a long upper shadow and little to no lower shadow. |
|
|
A reversal pattern which consists of: - A single candlestick pattern - A very small body and a long lower shadow that appears at the bottom of a downtrend |
|
|
- It consists of a long bearish candle - Followed by a doji candle that gaps down - And then a long bullish candle that gaps up. |
|
|
A three candlestick pattern with: - A large bearish candle, - A small bullish candle that closes above the 50% level of the first candle and - A third bullish candle that closes above the first candle's open. |
|
|
- Starts with a long bearish candle - Followed by an even longer bullish candlestick. The candle opens higher than the previous day's closing price and rises even more. |
|
|
A two-candlestick pattern that includes: - Two equal-sized bullish and bearish candles. |
|
|
It consists of five candles in a continuation pattern - A long bullish candle - Three small bearish candles that trade above the low and below the high of the first candlestick - And another long bullish candle that closes above the high of the first candlestick. |
|
|
It is similar to the rising three methods pattern consisting of five candles - It starts with a long bullish candle - Followed by three small bearish candles (a smaller bearish candles that move lower) that stay within the range of the first candle - And end with another long bullish candle that closes above the high of the first candle. |