What is a Mat Hold Candlestick Pattern?
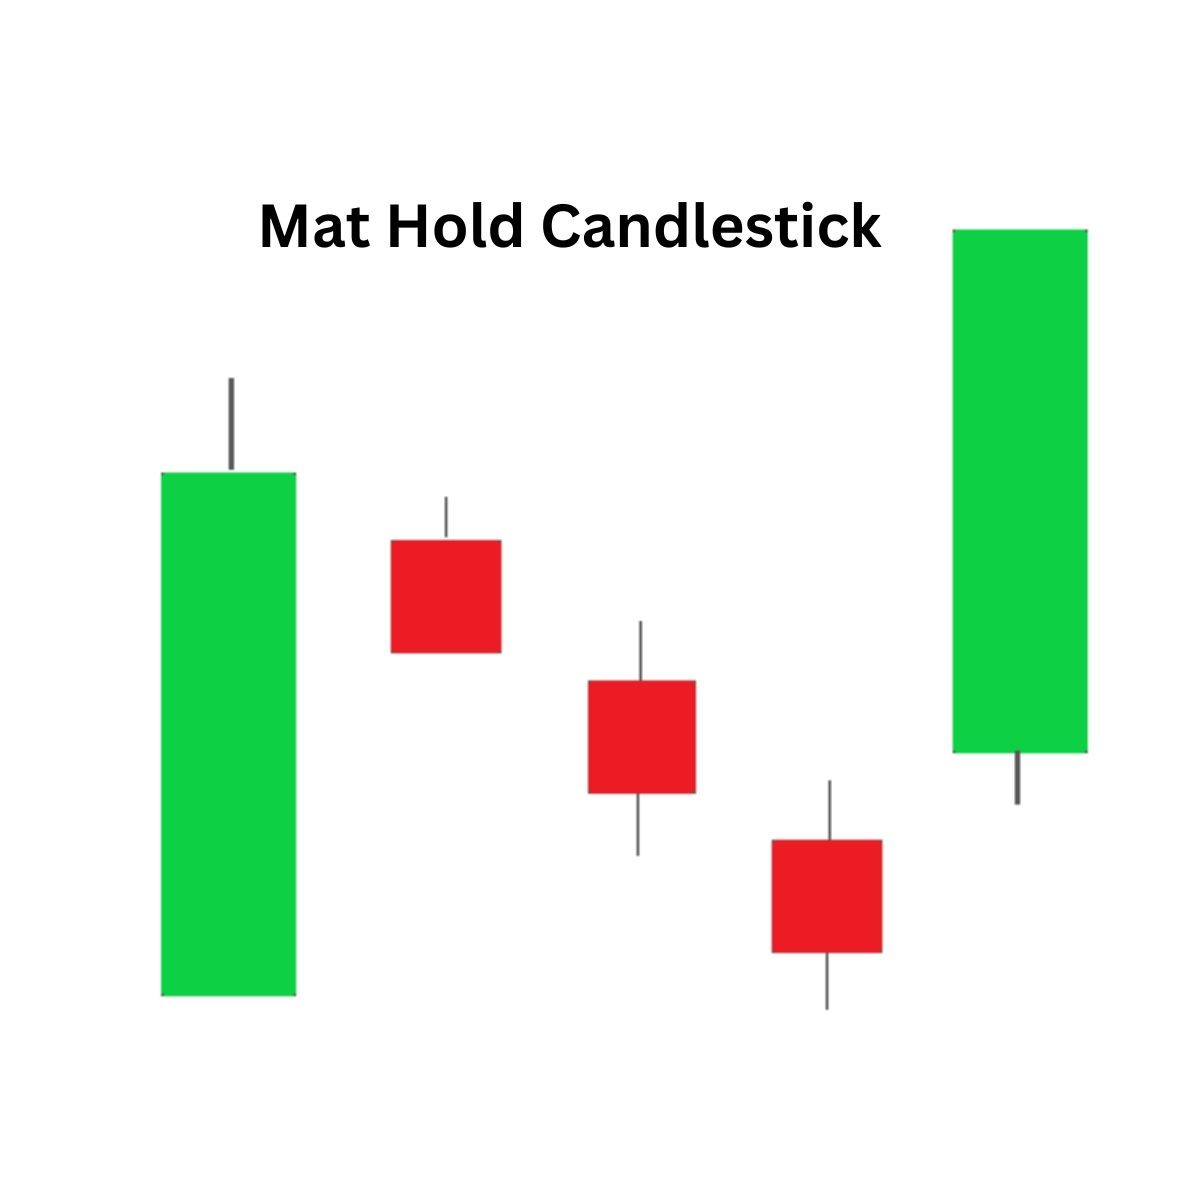
The Mat Hold candlestick pattern can be broken down into three phases – first, a big bullish candle, followed by small candles, and finally, a big candle, which indicates the final movement of the asset price. This can either be bullish or bearish, depending on the movement and trends. In fact, if you identify it right and leverage it wisely, it could well help you make better trading decisions. Let’s learn more about it now.
Mat Hold Candlestick Pattern - Definition & Key Attributes
Check Here to know How to Read Candlestick Charts.
Here is the lowdown on the Mat Hold candlestick pattern for your benefit:
- There is the first big bullish candle and small candles following it thereafter, and a final large candle that confirms the movement
- It’s quite like the Rising Three Methods candlestick pattern, although the small candles here stay above the low of the first candle
- The bullish continuation indicators are clearly stronger in this pattern, meaning that the upward trend will be sustained, with consolidation observed within a tighter price range
- The market will thus hold the price near the first candle’s high threshold, with the bullish uptrend continuing after a temporary period of consolidation. This means that buyers are gaining back their control after this pullback
- You may dive deeper into the psychological nuances of this pattern, where the second candlestick forms a mat or flat structure that indicates a temporary pullback. The initial long candle is the hint of the existing trend, and the second candle is the consolidation marker
- The last candle should close either below or above the fourth candle, and the pattern may appear during any bearish or bullish trend, showing how buyers or sellers regain charge after this pullback
- In the bullish mat hold pattern, there is a big upward candle, which is a gap higher, and three smaller candles that go downward, followed by an upward-moving big candle again
- In the bearish mat hold pattern, there is a strong bearish candle followed by three smaller bullish candles and then a bigger bearish candle
Also check : Scalper Mode on 915 | Straddle Chart
Example:
Let’s say a particular stock is trading at ₹500, having increased from ₹400
Then it starts coming down to ₹485, ₹475, and ₹450 in only three days of trading.
However, afterwards, there is a surge on the fifth day to ₹505, indicating the continuation of the uptrend.
Identifying a Mat Hold Candlestick Pattern Smartly
You’ll already know that identifying the trade pattern correctly is half the job done. In case of the Mat Hold candlestick pattern, here’s how you can do it.
- It can be both bullish and bearish, as mentioned above
- You should thus look out for the gaps between the small candles and also the support levels for the existing trend
- A thorough volume analysis is vital for confirming any institutional accumulation or positions
- The small candles after the initial large one will trade within the first one’s range with minimal gaps between them, leading to the flat mat chart depiction
- Gaps may appear between the first big candle and the initial small one or even between the last small candle and the final large confirming candle, based on the trend
- If the pattern forms near a trend support level, gaps occurring between the small candles may be vital since they indicate the support level being tested and a hint of the potential for the trend continuation
Mat Hold Candlestick Pattern-Based Trading Strategy
How should you trade with the knowledge of the Mat Hold candlestick pattern? Here’s what you need to know.
Step 1 - Understand when to Enter
Most people will enter their positions after the price closes above the high of the final bullish candle, indicating a trend reversal or offering more reliability. If you’re an aggressive trader, you may enter earlier when the pattern forms fully in order to earn faster potential profits with higher risks. Hence, the entry point will be after the consolidation phase breakout, i.e. after waiting for the last bullish candle to close above the first large bullish candle’s high to confirm any reversal
Step 2 - Put the Stop-Loss
You should put the stop-loss below the lowest consolidation point. In this case, it can be below the low of the fifth candle in the trading pattern to restrict prospective losses in case of the failure of the same
Step 3 - Take Profit
Your take profit strategy should be based on the next major resistance, i.e. aiming for price levels such as the earlier swing lows/highs. This will help you find potential profit points. You can set the target at a level that is a little beyond the initial large bullish candle’s high.
You must be flexible while trading with this pattern, adapting approaches depending on market conditions and any possible reversal movements. You can also combine the pattern with other methods for fine-tuning your trading strategy.
Mat Hold Candlestick Pattern - Benefits & Limitations
Knowing the benefits and limitations of the Mat Hold candlestick pattern is essential. Here’s looking at the same for your benefit.
Benefits:
- The pattern works as a confirmation of the trend, indicating the current movement that is likely to stay, giving you more confidence either to stay in an existing position or enter a new one in alignment with the trend
- The structure of this pattern provides clear entry and exit points. Traders get the cues to enter at the close of the large candle and exit when the price goes beyond the small candle range
- You can easily identify this pattern due to its unique appearance
- By waiting for the pattern to form before entering any trade, you can identify potential low-risk entry points in sync with the current trend
Limitations:
- Identification of the exact mat boundaries may be a subjective affair, leading to misinterpretation and poor trading decisions
- There is no clear indication as to whether the trend will turn bullish or bearish, and you will need more context from the market trends
- Volatility in the market may easily disrupt the pattern, leading to false signals and wrongful notions of the trend
- It is not reliable in itself; you have to combine it with other price action analysis of technical indicators for confirming trend signals and working out potential profit targets
Common Mistakes to Avoid with the Mat Hold Candlestick Pattern
Here are some common errors that you should avoid while looking to use the Mat Hold candlestick pattern.
- Not identifying the particular pattern structure may lead to misinterpretation
- Ignoring the prevailing trend in the market (bearish or bullish) may lead to false signals
- Entering the trade hastily upon seeing the pattern starting to form may lead to a poor entry point if you don’t have additional confirmation inputs
- Not putting proper stop-loss orders based on the attributes of the pattern may also lead to losses in some cases
- Ignoring the trading volume with the pattern may also lead to false signals about the strength of the potential movement in prices
Conclusion
Successfully trading the Mat Hold candlestick pattern requires you to be alert and flexible since the pattern may arise anytime during any bullish or bearish phase. You’ll have to identify the pattern successfully and enter the trade strategically once you have the final confirming candle in sight.
Here’s to leveraging this strategy smartly towards riding the market waves!
Check More Bullish Candlestick Patterns
|
Bullish Pattern |
Features |
|
A reversal pattern which consists of: - A small bearish candle followed by a - Larger bullish candle. |
|
|
A reversal pattern which consists of: - A small body candle, and - Long lower shadow/wick |
|
|
A reversal pattern which consists of: - It starts with a long bearish candle - Followed by a small-bodied candle (either bullish or bearish) - And ends with a long bullish candle. |
|
|
- A strong bearish candle followed by a bullish candle. - Second candle opens below the previous candle's close but closes above the midpoint (50%) of the previous bearish candle. |
|
|
- It is is a two-candlestick pattern that signals a possible upward trend reversal. - Small bullish candle is completely contained within the body of the previous large bearish candle. |
|
|
- It consists of three long bullish candles with small wicks that appear consecutively one after another. - Each new candle opens inside the previous one’s body and closes higher than the last. |
|
|
A reversal pattern which: - Appears at the bottom of a downtrend - A small body with a long upper shadow and little to no lower shadow. |
|
|
A reversal pattern which consists of: - A single candlestick pattern - A very small body and a long lower shadow that appears at the bottom of a downtrend |
|
|
- It consists of a long bearish candle - Followed by a doji candle that gaps down - And then a long bullish candle that gaps up. |
|
|
A three candlestick pattern with: - A large bearish candle, - A small bullish candle that closes above the 50% level of the first candle and - A third bullish candle that closes above the first candle's open. |
|
|
Starts with a bearish candle - Followed by a bullish candle that engulfs the first candle - Ends with another bullish candle that closes higher. |
|
|
- Starts with a long bearish candle - Followed by an even longer bullish candlestick. The candle opens higher than the previous day's closing price and rises even more. |
|
|
A two-candlestick pattern that includes: - Two equal-sized bullish and bearish candles. |
|
|
It consists of five candles in a continuation pattern - A long bullish candle - Three small bearish candles that trade above the low and below the high of the first candlestick - And another long bullish candle that closes above the high of the first candlestick. |
Check More Bearish Chart Patterns
|
Bearish Pattern |
Features |
|
It forms when a small bullish candle is followed by a large bearish candle that completely engulfs the previous green candle |
|
|
It is formed when three consecutive long-red candles with small wicks are visible |
|
|
It appears at the top of the uptrend as a single candle with a small body and a long lower shadow |
|
|
It is a three-candlestick pattern that - Starts with a long bullish candle - Followed by a small-bodied candle that gaps up - And ends with a long bearish candle that closes well into the body of the first candle |
|
|
It is a reversal strategy which: - Is a single candlestick pattern with a small body, a long upper shadow, and little to no lower shadow |
|
|
It is a two-candlestick pattern that: - Starts with a long bullish candle followed by a Doji (a candle with a very small body) |
|
|
It is a two-candlestick pattern where: - A small bearish candle is completely engulfed within the body of the previous large bullish candle |
|
|
- It consists of two or more candles with matching highs and appears at the top of an uptrend. - The first candle is usually bullish - And the second candle is bearish |
|
|
- It starts with a long bullish candle - Followed by a long bearish candle that opens below the previous candle’s opening price and closes lower |
|
|
It is a three-candlestick pattern that: - Starts with a bullish candle - Followed by a smaller bearish candle that is completely within the first candle - And ends with another bearish candle that closes lower |
|
|
It is a three-candlestick pattern that - Starts with a bullish candle - Followed by a bearish candle that engulfs the first candle - And ends with another bearish candle that closes lower |
|
|
It forms a long green candle followed by a red candle that opens above the previous high but closes below the midpoint of the green candle. |
|
|
It is a three-candlestick pattern that - Starts with a long bullish candle - Followed by a Doji that gaps up from the previous candle - And ends with a long bearish candle that gaps down from the Doji. |