Inverted Hammer Candlestick Pattern
An inverted hammer candlestick pattern is one of the most common and is considered vital for technical analysis. It serves as a warning indicator for a trend reversal. The indicator is mostly used to identify a bullish reversal pattern, which indicates the conclusion of a downtrend.
What is an Inverted Hammer?
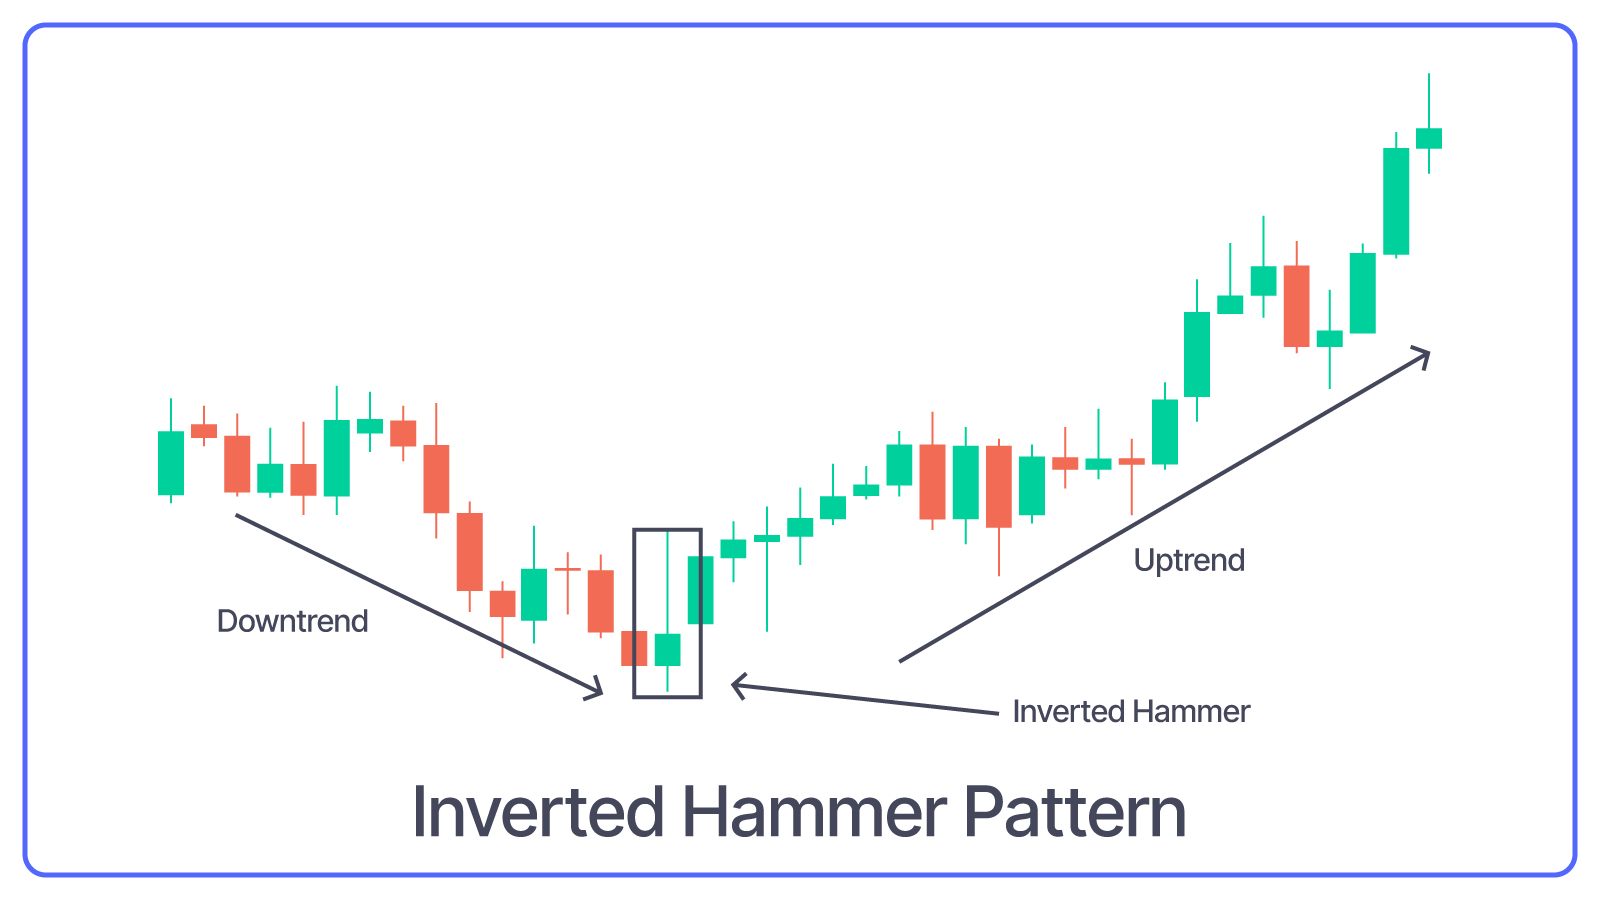
It is a candlestick pattern, which is represented as an inverse hammer, with the body of the candlestick being small and the upper wick being more than two times as large as the body of the candlestick itself, with little to no wick at the bottom.
It is frequently seen at the end of a downturn, which indicates that likely bullish market turn. The lengthy upper wick indicates that buyers are currently pushing commodity prices back up, and the market may witness a bullish price reversal.
Although it is a popular technical analysis pattern, it is not a perfect market predictor or a reliable investment signal.
Like its inverse twin, the shooting star candlestick pattern, this candlestick design has restrictions. These two are not interchangeable because the shooting star candlestick pattern frequently happens after an increase.
To effectively assess the impact of this pattern, traders must pay attention to what happens the day after it occurs. For example, when this pattern is green (the initial price of the commodity is lower than the closing price), it is considered a stronger bullish indicator than when it is red (the closing price of the commodity is lower than the opening price). Even yet, a red inverted hammer candlestick pattern is considered bullish.
Check Here to know How to Read Candlestick Charts.
Significance
In the world of investment, this pattern is quite important. It is a significant pattern that is commonly employed in stock and chart technical analysis. If you trade or invest in the stock market, you should be familiar with the same.
- The inverted hammer pattern is regarded as a significant indication or indicator indicating a market change during a trading day. For example, the move could go from a bearish to a bullish trend.
- The reverse hammer candlestick also indicates the presence or absence of a high or low on the stock charts.
- This pattern suggests that traders may purchase the stock at a reduced price. Then, following such purchases, market participants ensure that the stock price rises, resulting in this kind of candlestick.
- If the candle makes a new high, this respective candlestick fails, and the candle bottom has no meaning if it makes a new inverted hammer in downtrend.
Benefits
- It is easily identified due to the length of the top wick in comparison to the body of the candle and its occurrence near the end of an ongoing downturn. This characteristic makes it easy for even inexperienced technical traders to benefit from the pattern.
- Although it is not an absolute predictor of future market trends, it can be a very good indicator of entry into the market when combined with other patterns and by observing the events of the day following the inverted hammer candlestick. Early entry following this candlestick pattern could result in a trader profiting from a positive market turnaround.
- Unlike other technical analysis patterns or fundamental analysis formulae, this pattern demands a keen eye and market understanding and can be capitalised on by even a rookie technical analyst.
How to Trade with the Inverted Hammer
If you regularly invest in stocks, you should know trading with an inverted hammer. While no patterns are concrete, they do provide a good idea of market movements. To make a conclusion, check for other clues, such as a double bottom or a V-bottom as well.
Given that it is a bullish candlestick pattern, it can only be used by buyers looking to enter a trade. Therefore, when trading with this candlestick pattern, you should look for the following:
- Look for a few probable points on the stock charts that indicate a price reversal.
- You should only enter a trade if you are confident that the candlestick pattern will materialize.
- Stop-loss restrictions must be set to ensure that you do not lose too much money while using this pattern. It would be beneficial if you set your stop-loss a couple of units below the bottom price of the inverted hammer's candle.
Limitations
- While the period following the identification of this type of candlestick pattern may result in an upward reversal, there is no guarantee that this will last for an extended period of time. If buyers are unable to maintain their market strength, the security price may continue to fall.
- It is just one of many candlestick patterns that can be used to foretell market activity. However, relying solely on them without taking into account other signs and current conditions may result in unfavourable results.
Check More Bullish Candlestick Patterns
|
Bullish Pattern |
Features |
|
A reversal pattern which consists of: - A small bearish candle followed by a - Larger bullish candle. |
|
|
A reversal pattern which consists of: - A small body candle, and - Long lower shadow/wick |
|
|
A reversal pattern which consists of: - It starts with a long bearish candle - Followed by a small-bodied candle (either bullish or bearish) - And ends with a long bullish candle. |
|
|
- A strong bearish candle followed by a bullish candle. - Second candle opens below the previous candle's close but closes above the midpoint (50%) of the previous bearish candle. |
|
|
- It is is a two-candlestick pattern that signals a possible upward trend reversal. - Small bullish candle is completely contained within the body of the previous large bearish candle. |
|
|
- It consists of three long bullish candles with small wicks that appear consecutively one after another. - Each new candle opens inside the previous one’s body and closes higher than the last. |
|
|
A reversal pattern which consists of: - A single candlestick pattern - A very small body and a long lower shadow that appears at the bottom of a downtrend |
|
|
- It consists of a long bearish candle - Followed by a doji candle that gaps down - And then a long bullish candle that gaps up. |
|
|
A three candlestick pattern with: - A large bearish candle, - A small bullish candle that closes above the 50% level of the first candle and - A third bullish candle that closes above the first candle's open. |
|
|
Starts with a bearish candle - Followed by a bullish candle that engulfs the first candle - Ends with another bullish candle that closes higher. |
|
|
- Starts with a long bearish candle - Followed by an even longer bullish candlestick. The candle opens higher than the previous day's closing price and rises even more. |
|
|
A two-candlestick pattern that includes: - Two equal-sized bullish and bearish candles. |
|
|
It consists of five candles in a continuation pattern - A long bullish candle - Three small bearish candles that trade above the low and below the high of the first candlestick - And another long bullish candle that closes above the high of the first candlestick. |
|
|
It is similar to the rising three methods pattern consisting of five candles - It starts with a long bullish candle - Followed by three small bearish candles (a smaller bearish candles that move lower) that stay within the range of the first candle - And end with another long bullish candle that closes above the high of the first candle. |