What is Return on Assets (ROA)?


Key Takeaways:
- Return on Assets, or ROA, is a profitability ratio that measures how much profit a company generates from its asset base.
- Standard formula: ROA = (Net Income ÷ Average Total Assets) × 100.
- The #1 Rule of ROA: ROA should be compared within the same industry, not across unrelated sectors.
- ROA should be used with ROE, ROCE, asset turnover, profit margins, debt ratios, and cash-flow metrics for a more complete assessment.
While evaluating a company's balance sheet, investors generally focus on earnings growth or revenue figures.
But raw profits don't tell the entire story.
A company earning ₹500 crore sounds impressive, unless it took ₹10,000 crore in assets to do it. That's where Return on Assets (ROA) comes in.
ROA answers a deceptively simple question: "For every rupee of assets the company owns, how much profit does it make?"
In this blog, we will discuss everything you need to know about Return on Assets and how it is calculated.
What is Return on Assets (ROA)?
Return on Assets is a profitability indicator. Expressed as a percentage (%), it measures how effectively a company uses its assets to generate profit. "The higher the ROA, the more efficient the operations."
ROA is calculated by dividing a company's net income by its average total assets.
|
(Net Income ÷ Average Total Assets) * 100 Where, Net income (profit) is the company's profit after all taxes, interest, and expenses (from the income statement). Total assets are everything the company owns, including cash, inventory, property, equipment, receivables, and other financial assets (as reported on the balance sheet). |
A higher ROA usually indicates better asset efficiency, but investors should check whether it is driven by sustainable margins, strong asset turnover, old depreciated assets, one-time gains, or underinvestment.
Why Do Investors Track ROA?
A company can grow profits by fundamentally two ways:
Option 1: Buy more assets.
Add more factories, inventory, equipment, real estate, and use that expanded base to produce more revenue and profit.
Option 2: Get more out of what it already owns.
Squeeze more profit from the same assets through better efficiency, pricing power, technology, or operational discipline, without spending more capital.
ROA measures the second.
This distinction matters because not all growth is created equal. A company that grows profits mainly through Option 1 has to keep raising or reinvesting capital to keep expanding
That growth can look impressive on the income statement, but it's also expensive and harder to sustain.
A company that grows through Option 2 is compounding value organically.
This is why investors pay close attention to ROA: it separates companies that are genuinely becoming more efficient from companies that are simply buying their growth
Step-by-Step Process to Calculate ROA
- Find net income. Locate the bottom line of the income statement. This is profit after deducting interest, taxes, depreciation, and amortisation.
- Find total assets on the balance sheet; they equal total liabilities plus shareholders' equity. Make sure you're using the same reporting period as the net income figure.
- Average the assets. Add the total assets at the start and end of the year, then divide by two. But it gives a more accurate picture if the company made major acquisitions or divestitures during the year.
- Divide and multiply. Apply the formula: (Net Income ÷ Total Assets) × 100. The result is your ROA percentage.
What a High ROA signals
A high ROA generally depicts
- Strong operational efficiency means the company generates more earnings per dollar (or rupee) invested in assets.
- The company has an asset-light business model and doesn’t require large investments in physical assets
- Pricing power, wide margins, and a competent team, i.e., management is converting investments in factories, equipment, inventory, or other assets into profits effectively.
"The best business to own is one that over an extended period can employ large amounts of incremental capital at very high rates of return" - Warren Buffett.
What a Low ROA signals
A low ROA typically indicates the following:
- A heavy asset base or high operating costs is reducing net income.
- Thin operating margins, i.e., the company is not generating enough earnings from its investment
- The business may have excess capacity, idle equipment, or inventory that isn't contributing much to revenue.
- Possible management inefficiency and competitive pressure on pricing
However, a low ROA doesn't always spell trouble. Capital-intensive industries, such as steel, utilities, and heavy infrastructure, require large asset bases to operate.
Their ROA will always look low compared to a software company, even when they are operationally excellent. The key is always comparison within the sector, not across sectors.
Example:
Let's take an example to understand how ROA is calculated.
We will calculate Hindustan Zinc's Return on Assets (ROA) for FY 2025. Below are their consolidated balance sheet and P&L as of 31 March 2025.
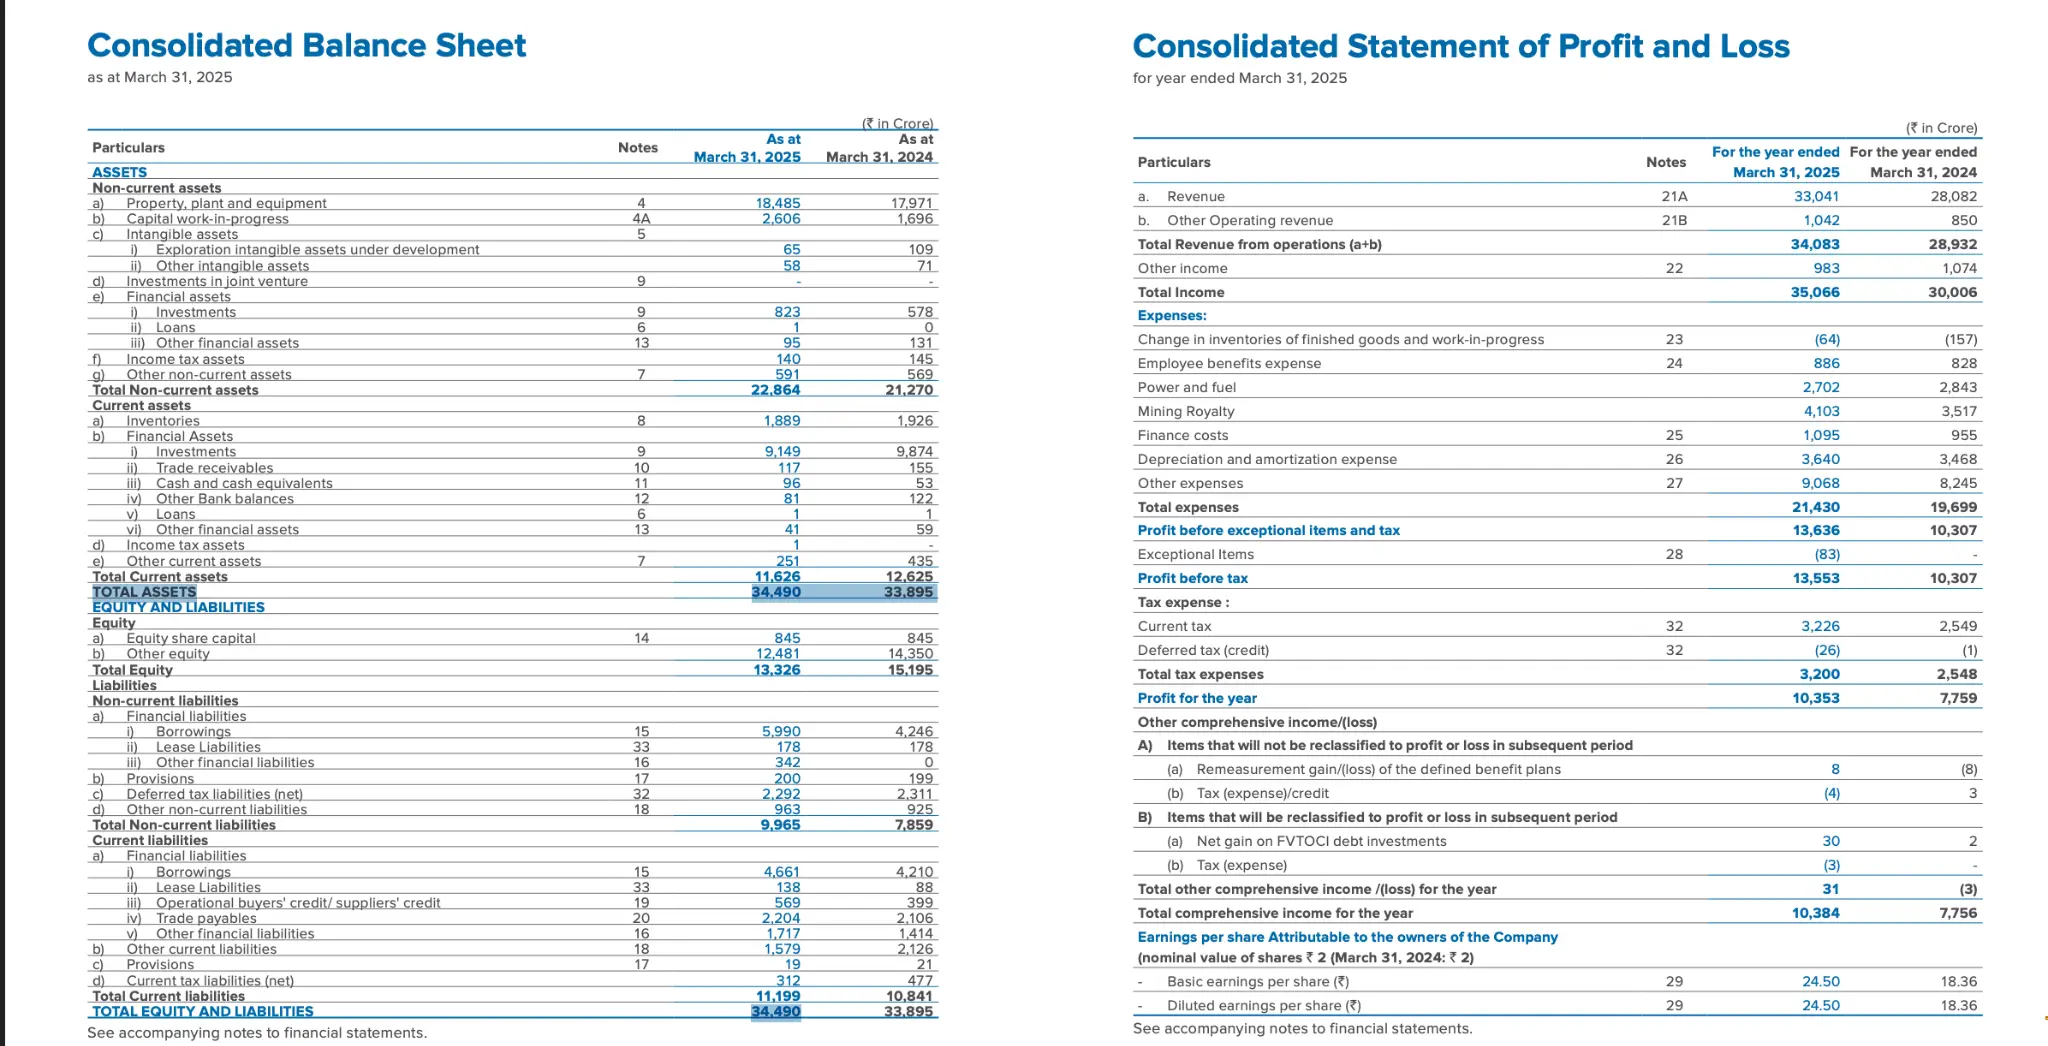
Source: Hindustan Zinc Annual Report 2025
|
Consolidated |
FY 2025 |
|
Net profit for the year |
₹10,353 |
|
Total assets: 31 March 2024 (opening FY25) |
₹33,895 crore |
|
Total assets: 31 March 2025 (closing FY25) |
₹34,490 crore |
|
Average total assets [(opening + closing) ÷ 2] |
₹34,193 crore |
|
ROA: (₹10,353 ÷ ₹34,193) × 100 = 30.3% (Approx.) |
|
|
This means Hindustan Zinc generated ₹30.30 of profit for every ₹100 of assets employed during FY2025. |
|
What Is Considered a Good ROA?
There's no single universal benchmark for a good ROA. It varies a lot by industry; some businesses are naturally asset-heavy (manufacturing, utilities, real estate) while others are asset-light (software, consulting).
That said, here are some general benchmarks:
|
Below 5% |
Often considered weak, especially for asset-light industries |
|
5% to 10% |
Solid/good for many industries |
|
Above 10% |
Often considered strong |
|
Above 20% |
Excellent |
Whether the ROA is good depends on industry type.
- Banks and financial institutions: 1-2% ROA is often considered strong because they operate with very large asset bases.
- Manufacturing, industrial, utilities, telecom: 5-10%
- Technology and software: 15-25%+
- Retail: 5-10%
Return on Assets (ROA) vs Return on Equity (ROE) - Key Differences
|
Parameters |
ROA (Return on Assets) |
ROE (Return On Equity) |
|
Formula |
(Net Income ÷ Average Total Assets) * 100 |
Net Income ÷ Shareholders' Equity * 100 |
|
What it measures |
Profit generated from the full asset base |
Profit generated for equity shareholders |
|
What the denominator includes |
Debt-funded and equity-funded assets |
Only shareholders’ equity |
|
Best used for |
Asset efficiency, and same-sector peer comparison |
Shareholder returns, equity investor focus |
|
Typical range |
2-20% depending on industry |
10-25% for quality companies |
|
Limitation |
Can be distorted by accounting values, old assets, intangibles and one-time profits |
Could be inflated by leverage |
Limitations of ROA
- Cross-industry comparisons break down. A bank with a 1.2% ROA and a tech firm with a 22% ROA cannot be meaningfully compared. The business models are structurally different.
- Older assets inflate ROA artificially. Companies with depreciated or fully written-off assets have a smaller asset base, which inflates ROA.
- Intangible assets don't appear on the balance sheet. A brand-heavy company may appear more efficient than it truly is because its most valuable assets aren't counted.
How to use ROA correctly across industries
The single most important rule: ROA cannot be compared across industries. So, to use it correctly, always benchmark ROA within the same sector.
Beyond sector norms, watch the trend. An ROA of 7% that has grown from 4% over five years tells a very different story from a 7% ROA that has fallen from 14%.
For banks specifically, return on assets, as defined by the Reserve Bank of India, is considered. It is interpreted on a much lower scale than for non-financial companies because banks operate with very large asset bases. RBI reported the RoA of scheduled commercial banks at 1.4% in FY2024-25.
So, an ROA above 1.5% can be described as “above the recent system average” or “strong by Indian banking-sector standards.