Post-Trade Analysis on Groww: Understand Your Trading Performance
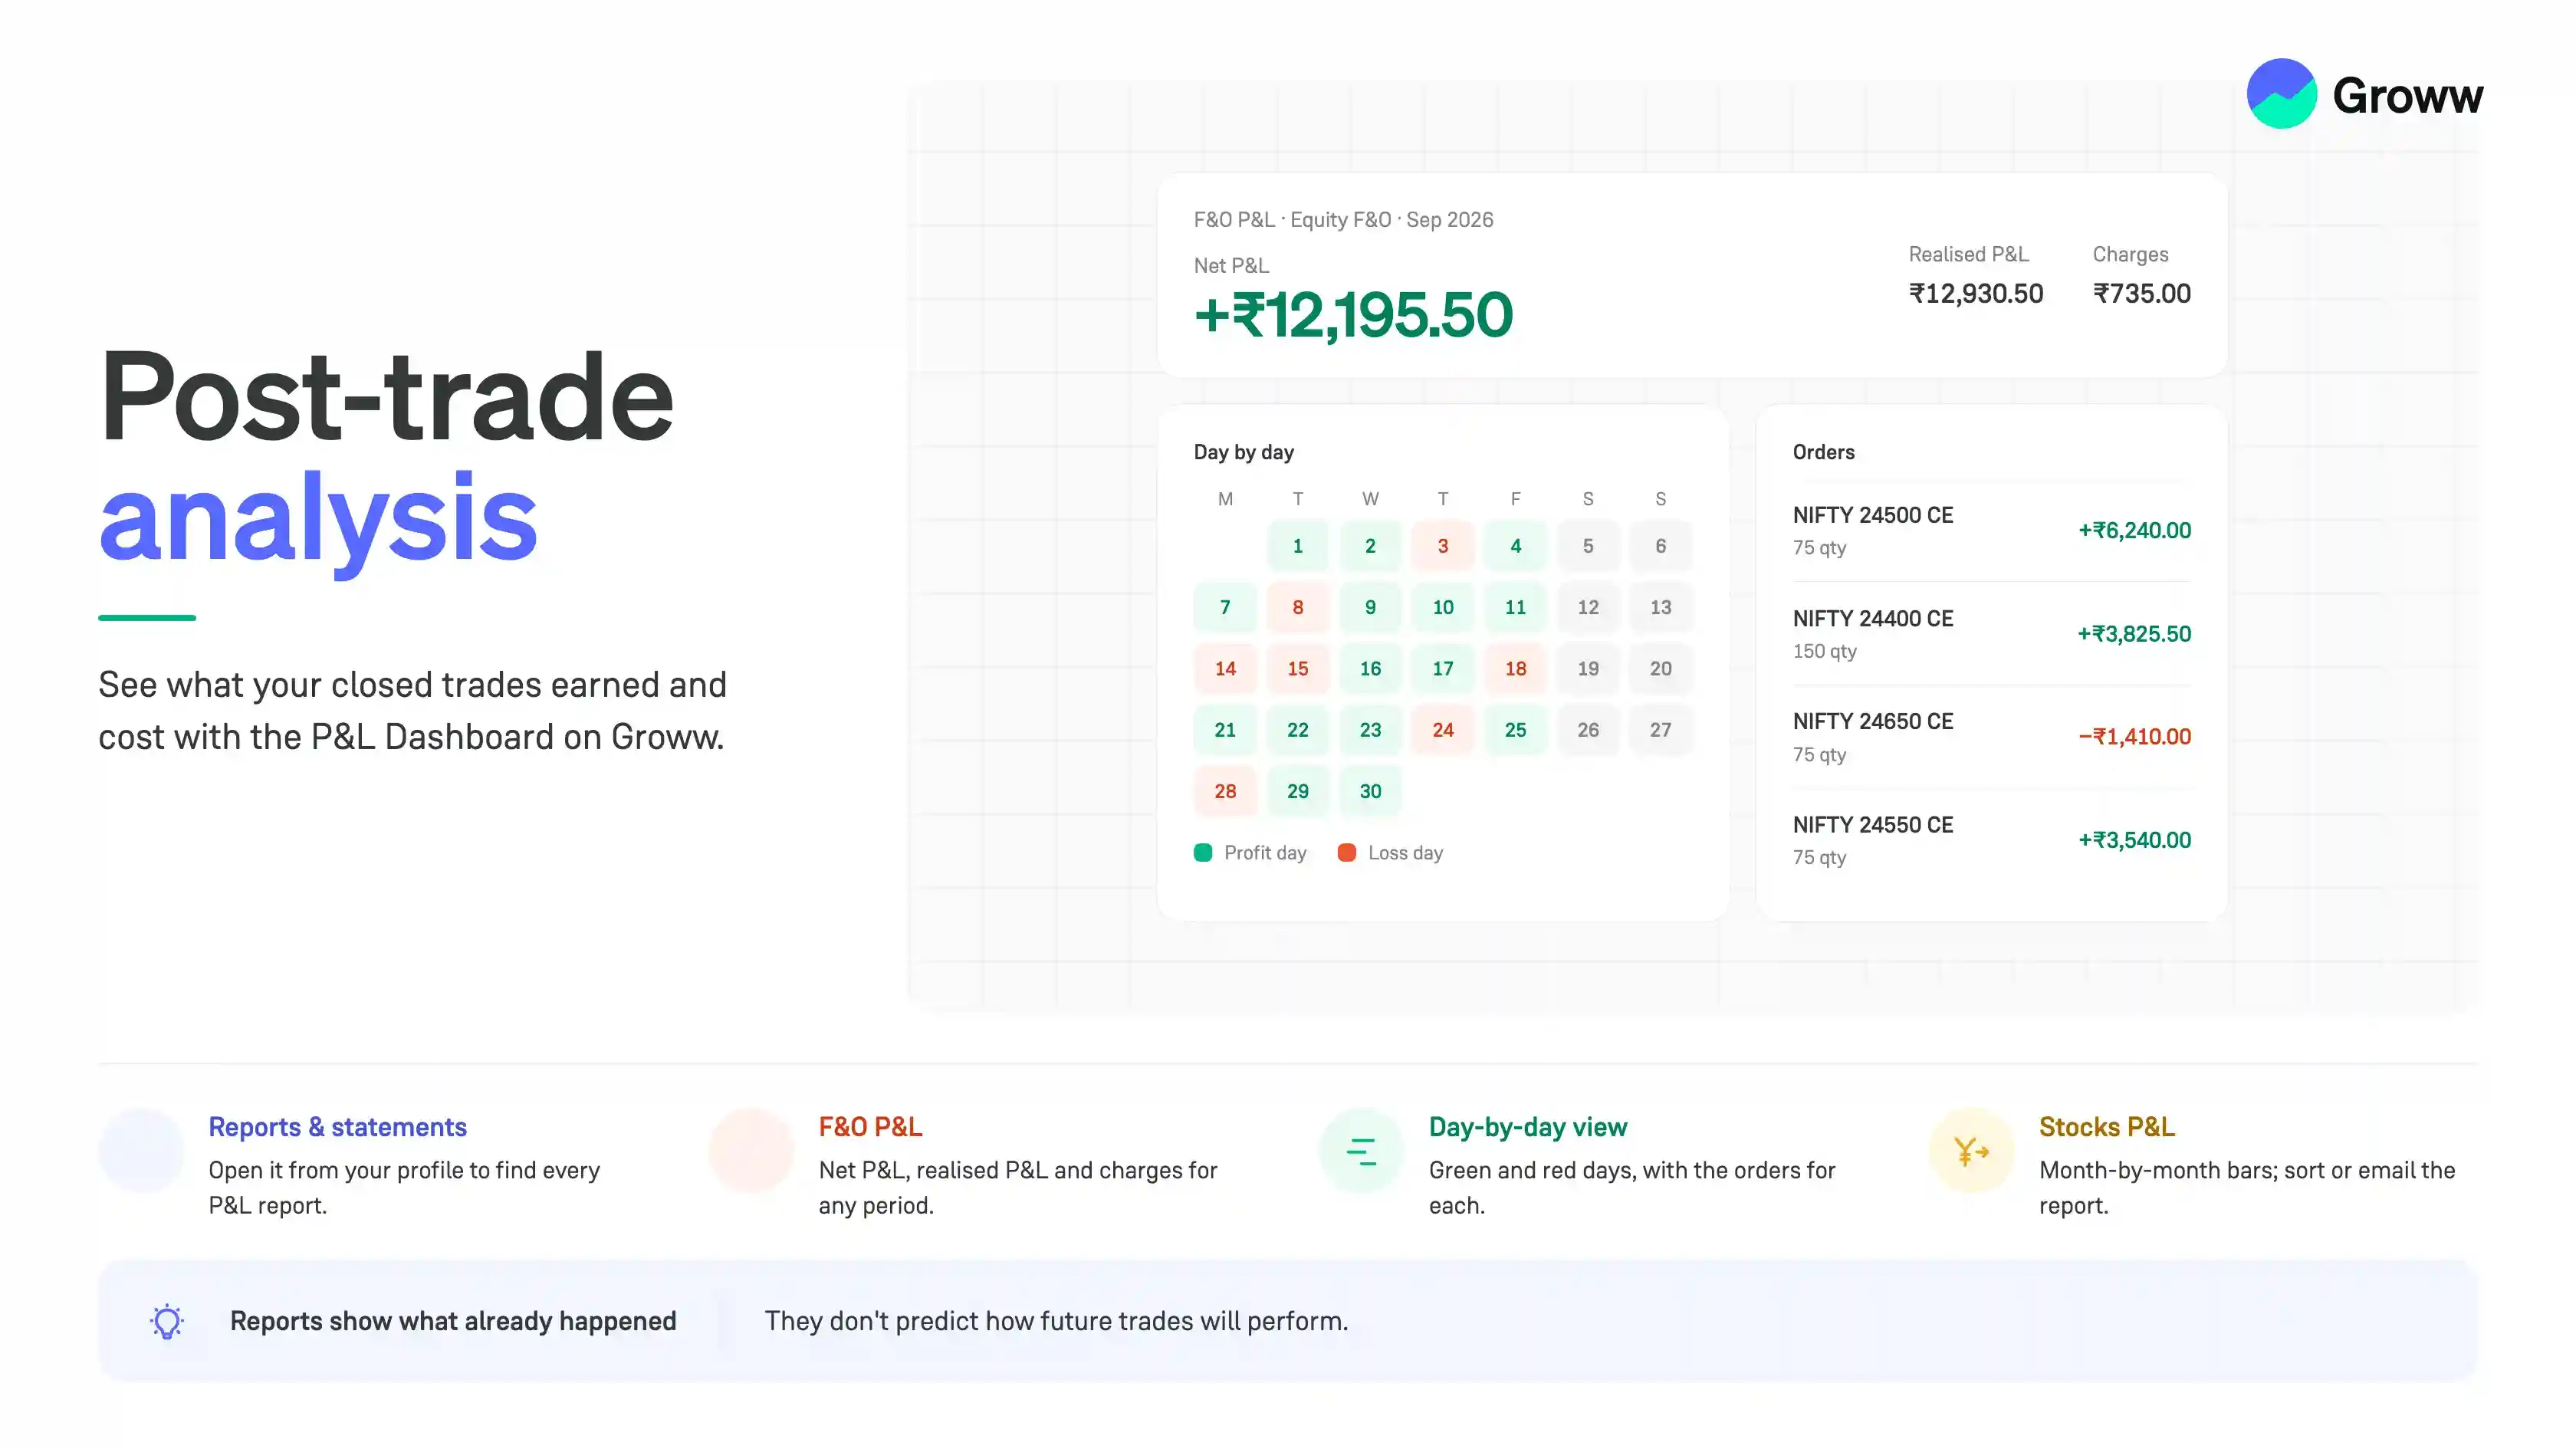


Placing and closing a trade is not the end of the trading process. Reviewing your trades can help you understand what worked, what did not and where you may need to improve.
Post-trade analysis allows you to look beyond the profit or loss of a single NIFTY options trade. You can review your overall performance, analyse your trading patterns and identify areas that may require more attention.
On Groww, the P&L Dashboard can help you review your trading activity after a trade is completed.
For simplicity, this guide uses NIFTY Call Options as examples.
Where the Reports Are
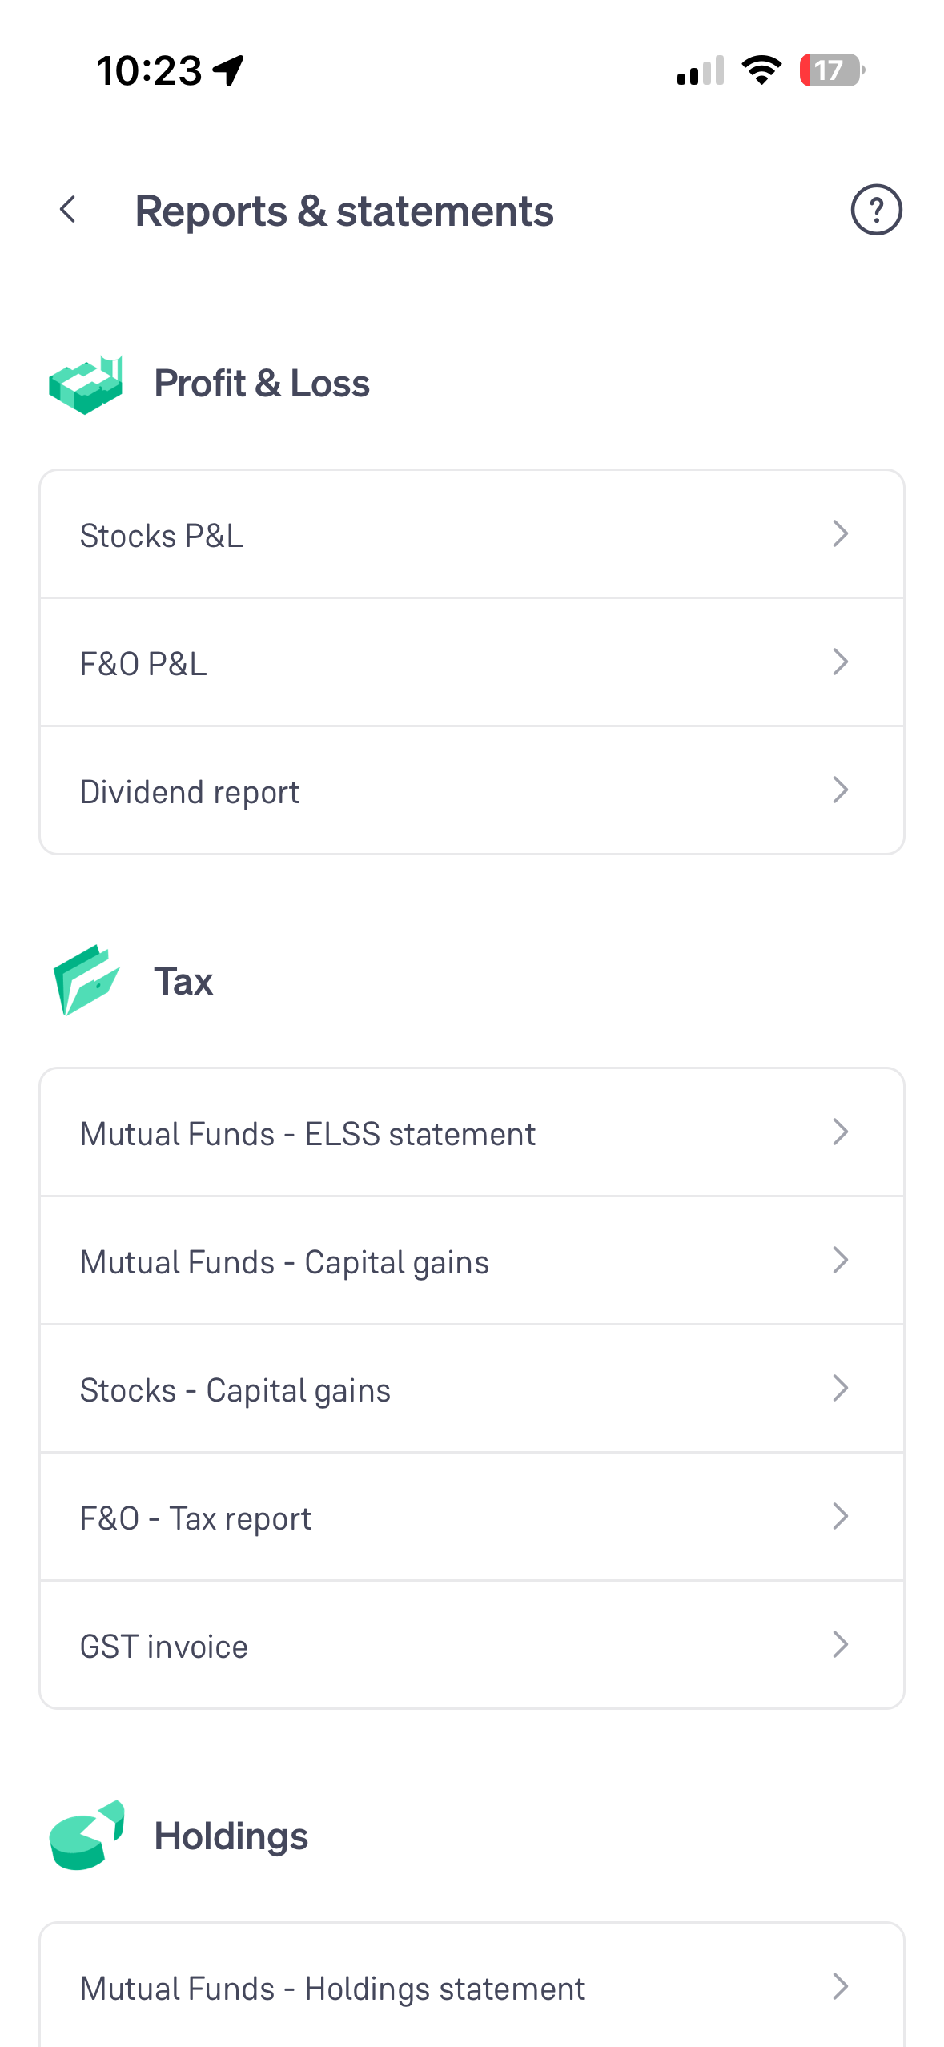
All the reports sit under Reports & statements in your profile.
- Go to your profile and open “Reports & statements”
- The Profit & Loss section has Stocks P&L, F&O P&L and the Dividend report
- The Tax section has the Mutual Funds ELSS statement, Mutual Funds Capital Gains, Stocks Capital Gains, F&O Tax report and GST invoice
- The Holdings section has the holdings statements
Review Your F&O Trades
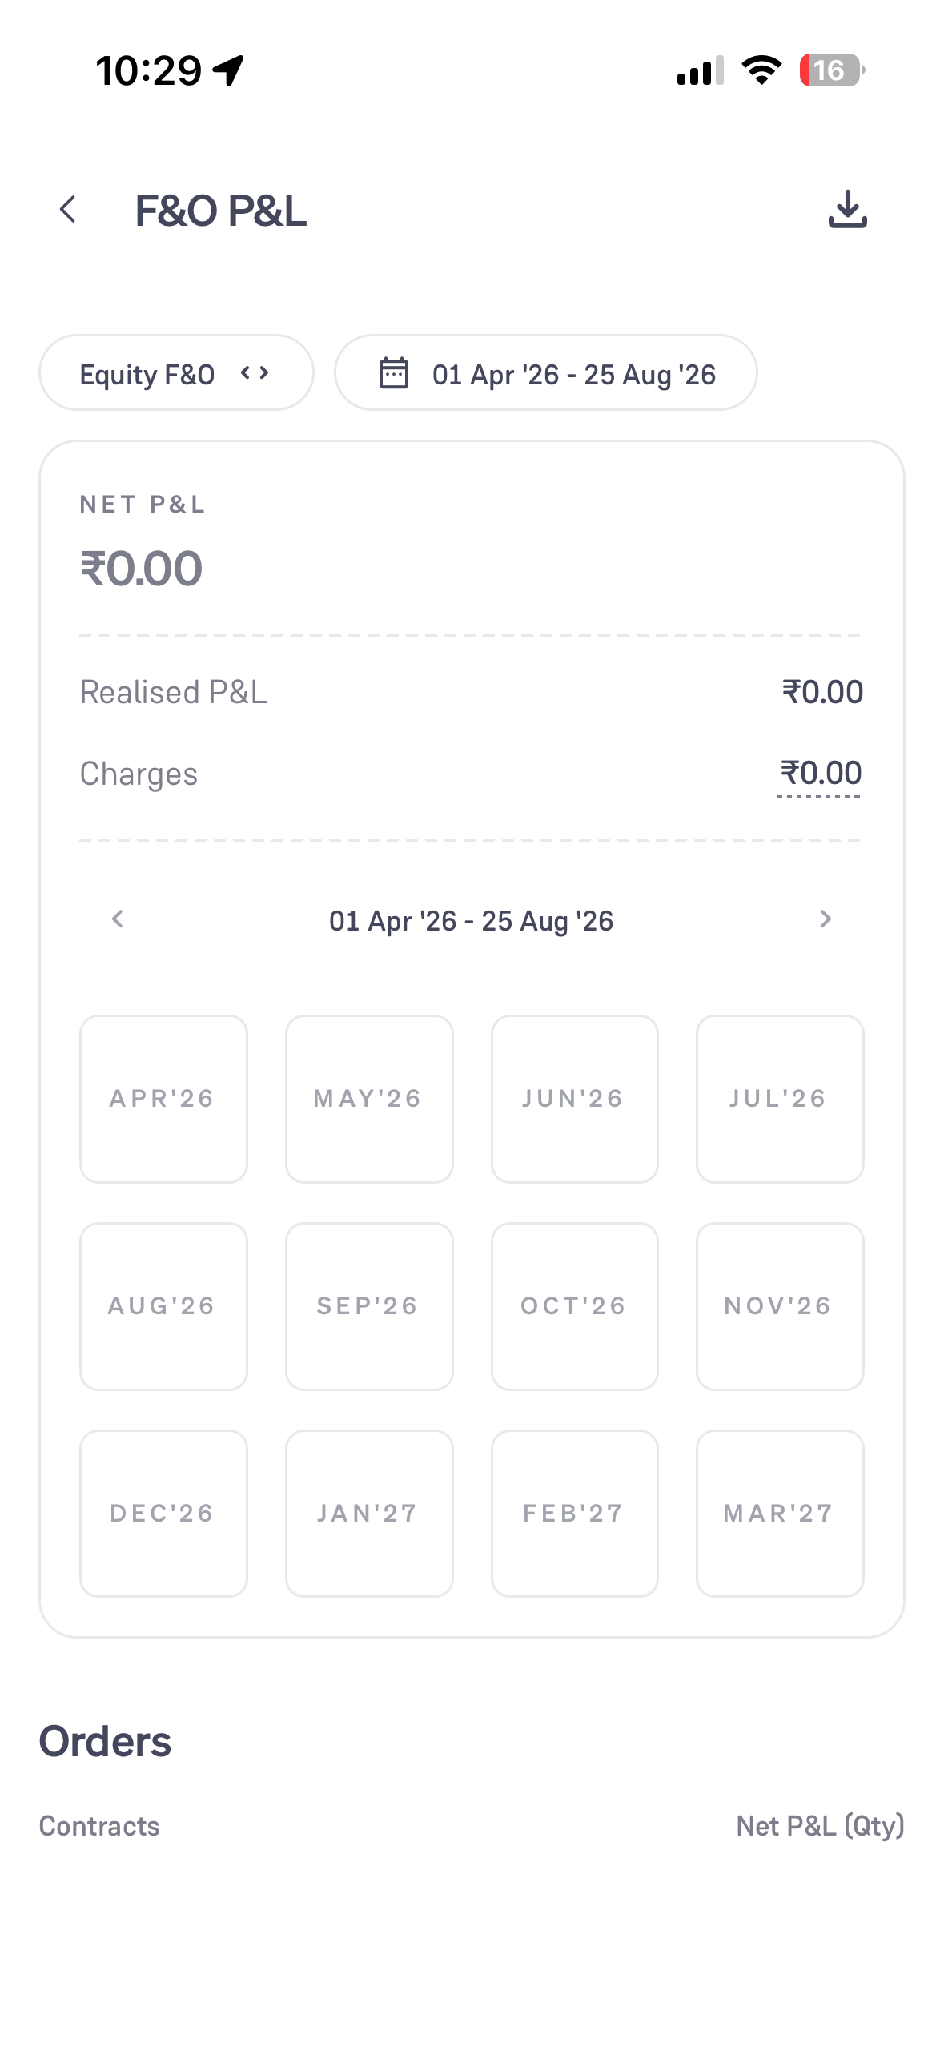
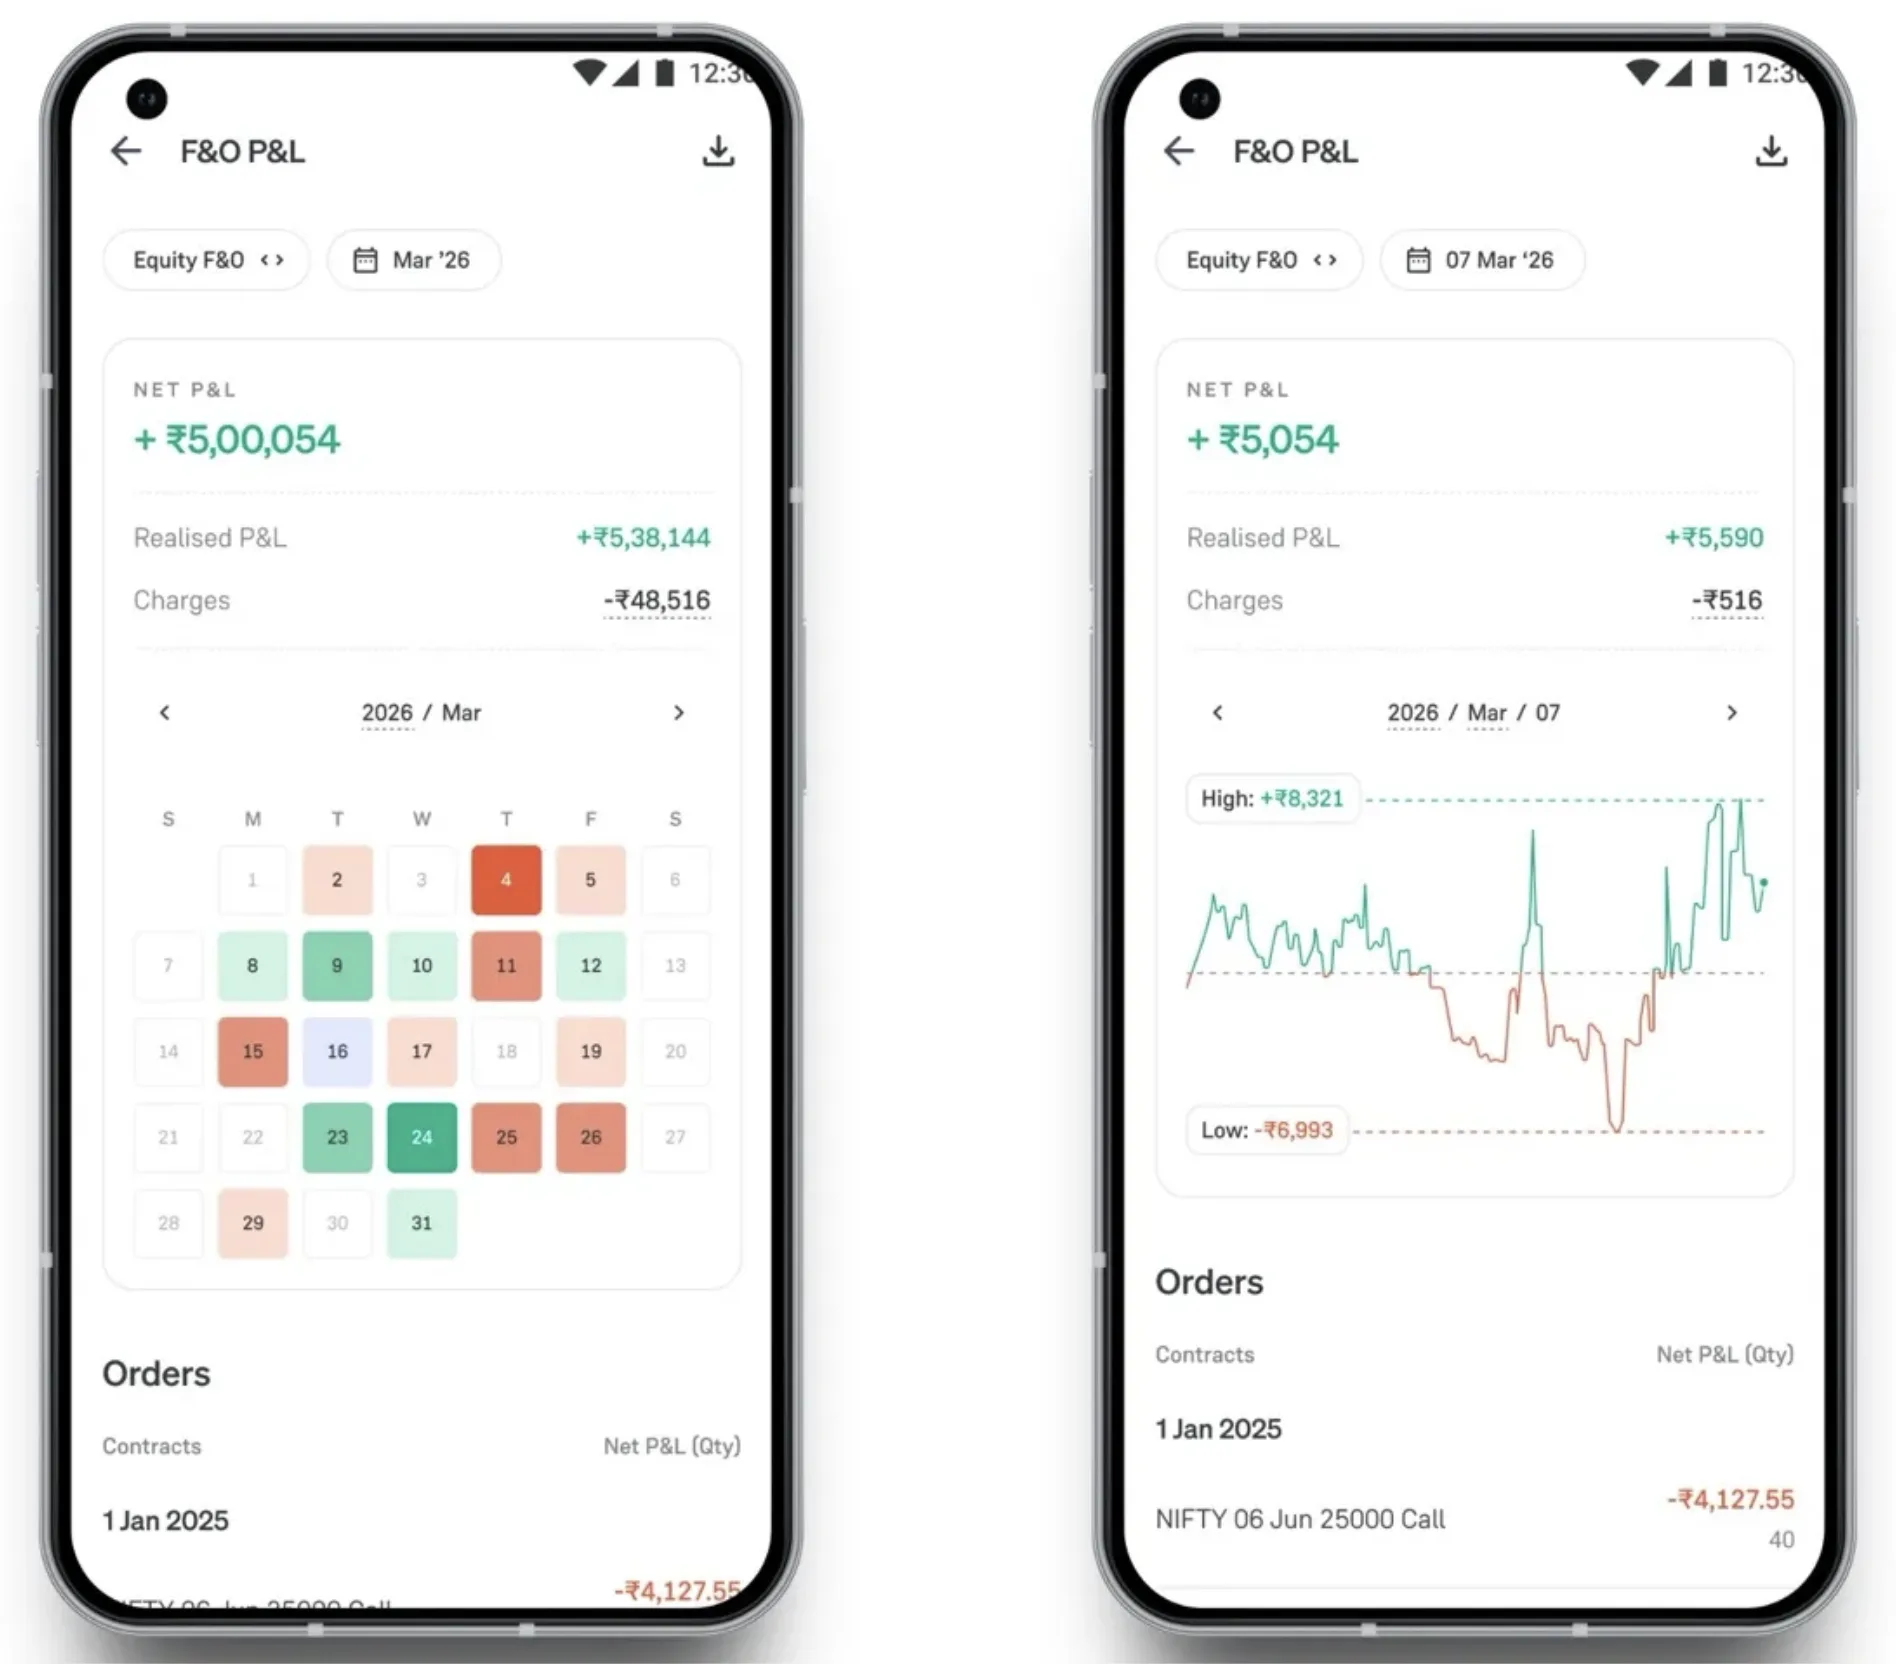
The F&O P&L report covers your derivatives trading for a selected period.
- On the Reports & statements screen, click “F&O P&L”
- Use the segment button on the left to choose the segment, for example, Equity F&O
- Use the date button next to it to set the period. The selected range is shown on the button
- The card shows the Net P&L for that period, with the Realised P&L and the Charges below it
- The month grid lets you move to a single month within the financial year
- The Orders section below lists the contracts traded, with the Net P&L and the quantity for each
- The download icon on the top right saves the report
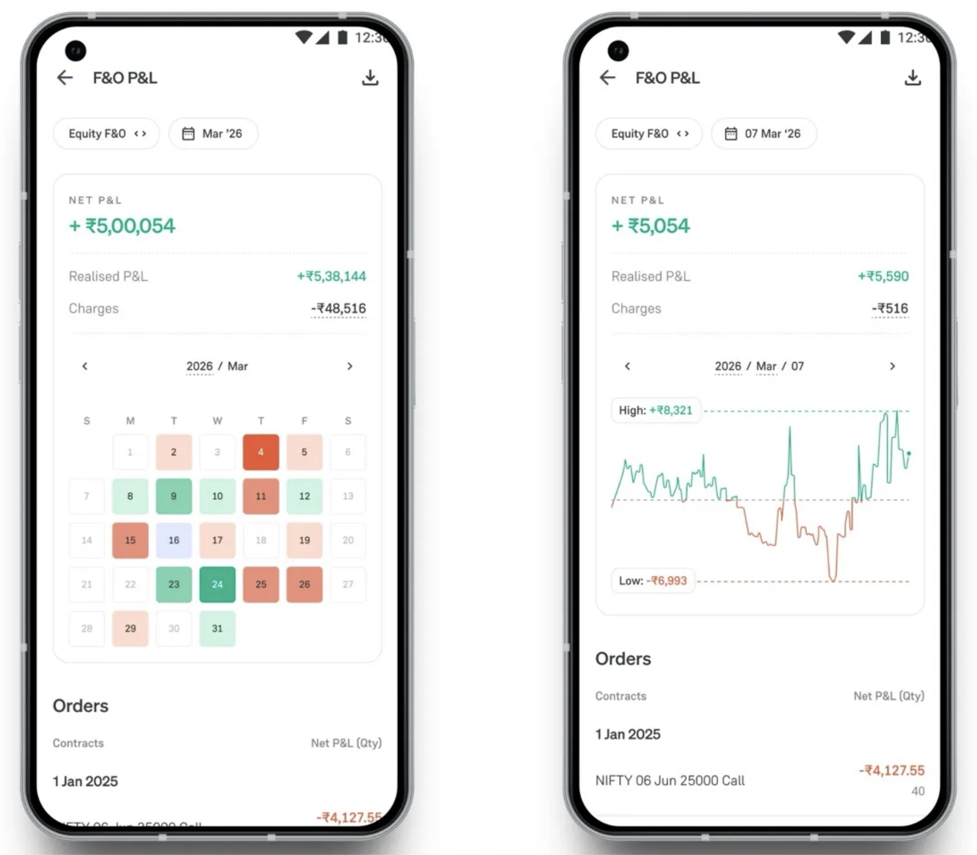
Once you select a month, the same screen shows the P&L day by day.
- The calendar marks profitable days in green and loss-making days in red
- Selecting a single day shows the P&L for that day as a line chart, with its high and low marked
- The Orders list below updates for the selected day
Review Your Stock Trades
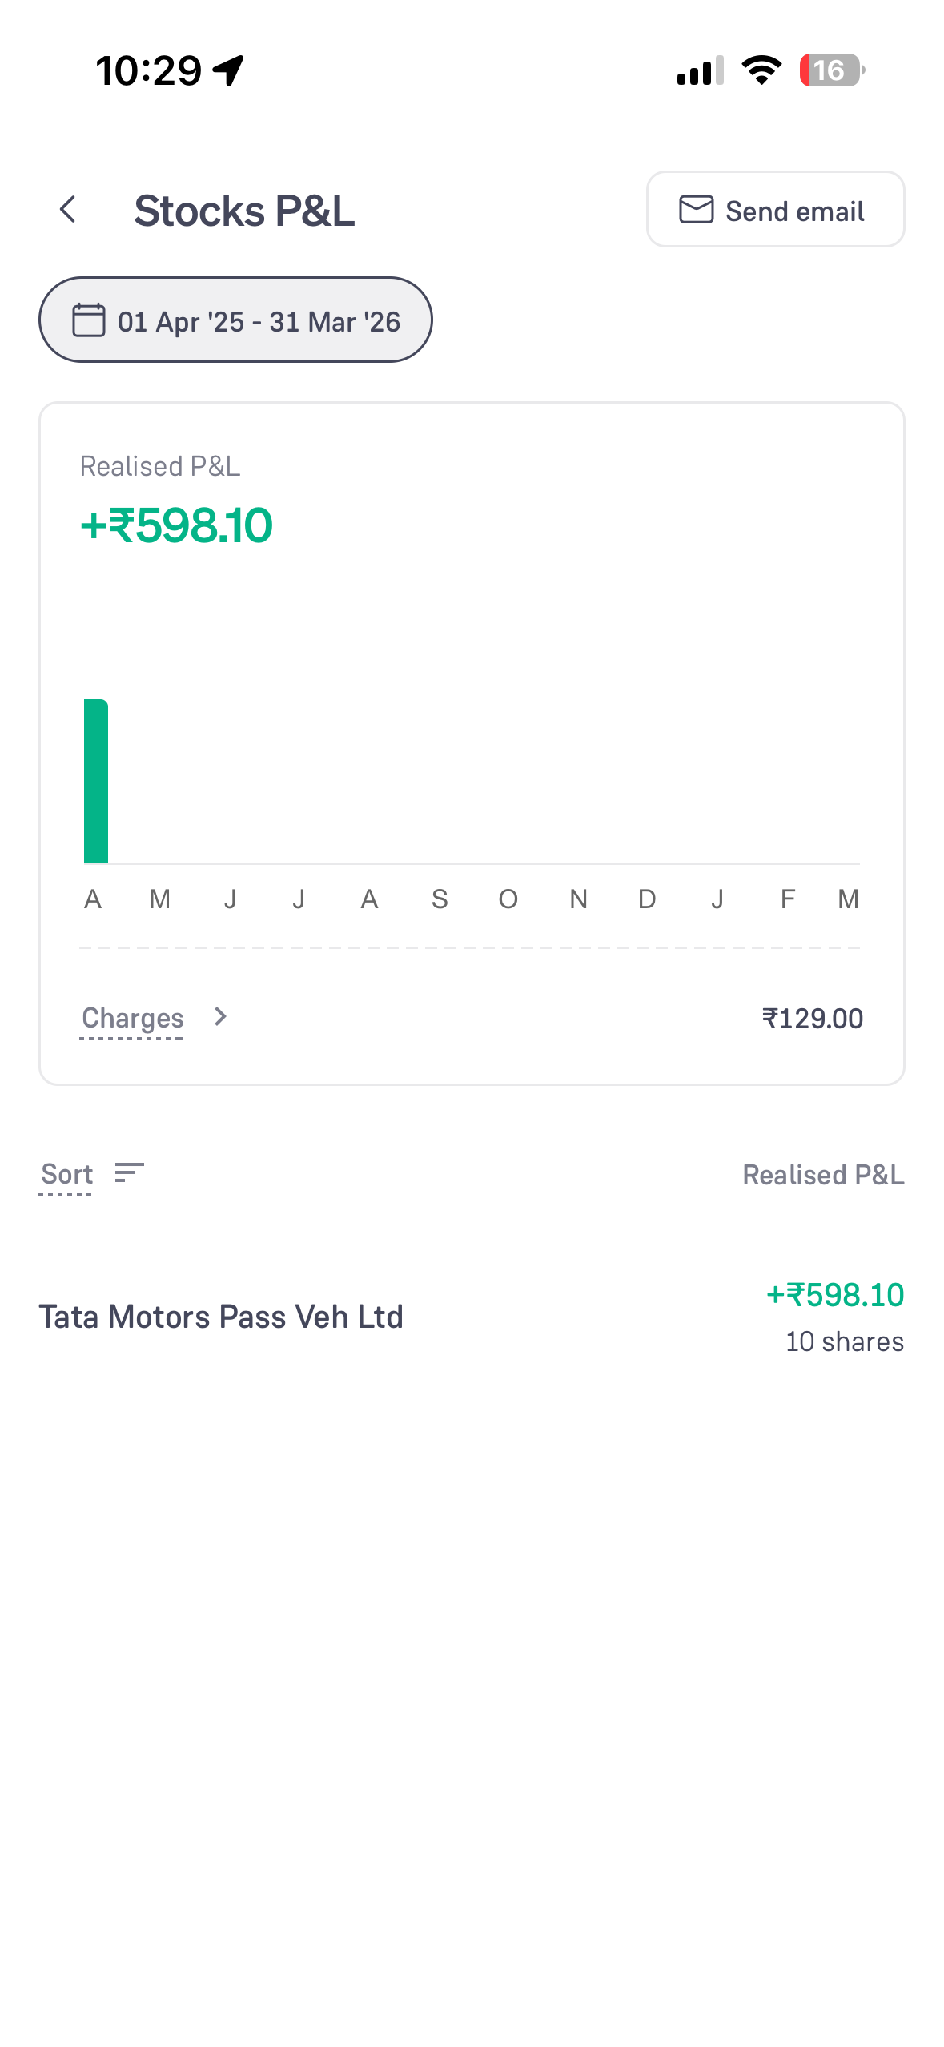
The Stocks P&L report covers your delivery and intraday equity trades.
- On the Reports & statements screen, click “Stocks P&L”
- Use the date button at the top to set the period
- The card shows the Realised P&L for the period, with a month-by-month bar chart below it
- The Charges row shows the total charges for the period and can be opened for the break-up
- The list below shows each stock with its realised P&L and the number of shares
- Use “Sort” to change the order of the list, and “Send email” on the top right to have the report emailed to you
Conclusion
Reviewing a trade after it is closed is as much a part of trading as placing it. The Stocks P&L and F&O P&L reports show what your trades earned, what they cost in charges and how the P&L moved across months and days.
These reports show what has already happened. They do not predict how future trades will perform.