Analyse Your F&O Trades Smarter with Groww’s New P&L Dashboard
Hello users,
If you are actively into fno trading or just starting your trading journey, you already know one thing. Trading is emotional.
Some days you want to celebrate your profits. Other days, you want to understand what went wrong and improve.
That’s exactly why Groww has introduced the F&O P&L Dashboard - a smarter way to track, analyse, and review your Futures & Options trading performance in one place.
Whether you want to:
- check your daily profit or loss
- analyse how your P&L moved during the day
- review winning and losing trades
- compare performance
- or download reports for deeper analysis
With the new dashboard, you can do it all seamlessly.
What is the F&O P&L Dashboard?
The F&O P&L Dashboard is a dedicated reporting experience inside Groww that gives you a complete picture of your trading performance.
Instead of manually calculating profits, checking contract notes, or going through multiple reports, you now get:
- a visual P&L summary
- daily performance tracking
- monthly/quarterly/yearly performance comparison
- order-level trade insights
- downloadable reports
The dashboard is designed to help traders move beyond just “profit or loss” and actually learn from their trades.
Feature Highlights
The F&O P&L Dashboard is designed to help traders get a complete view of their trading activity. It lets them analyse patterns, review trades, and make better decisions over time.
➡️ Track Your P&L Movement Throughout the Trading Day
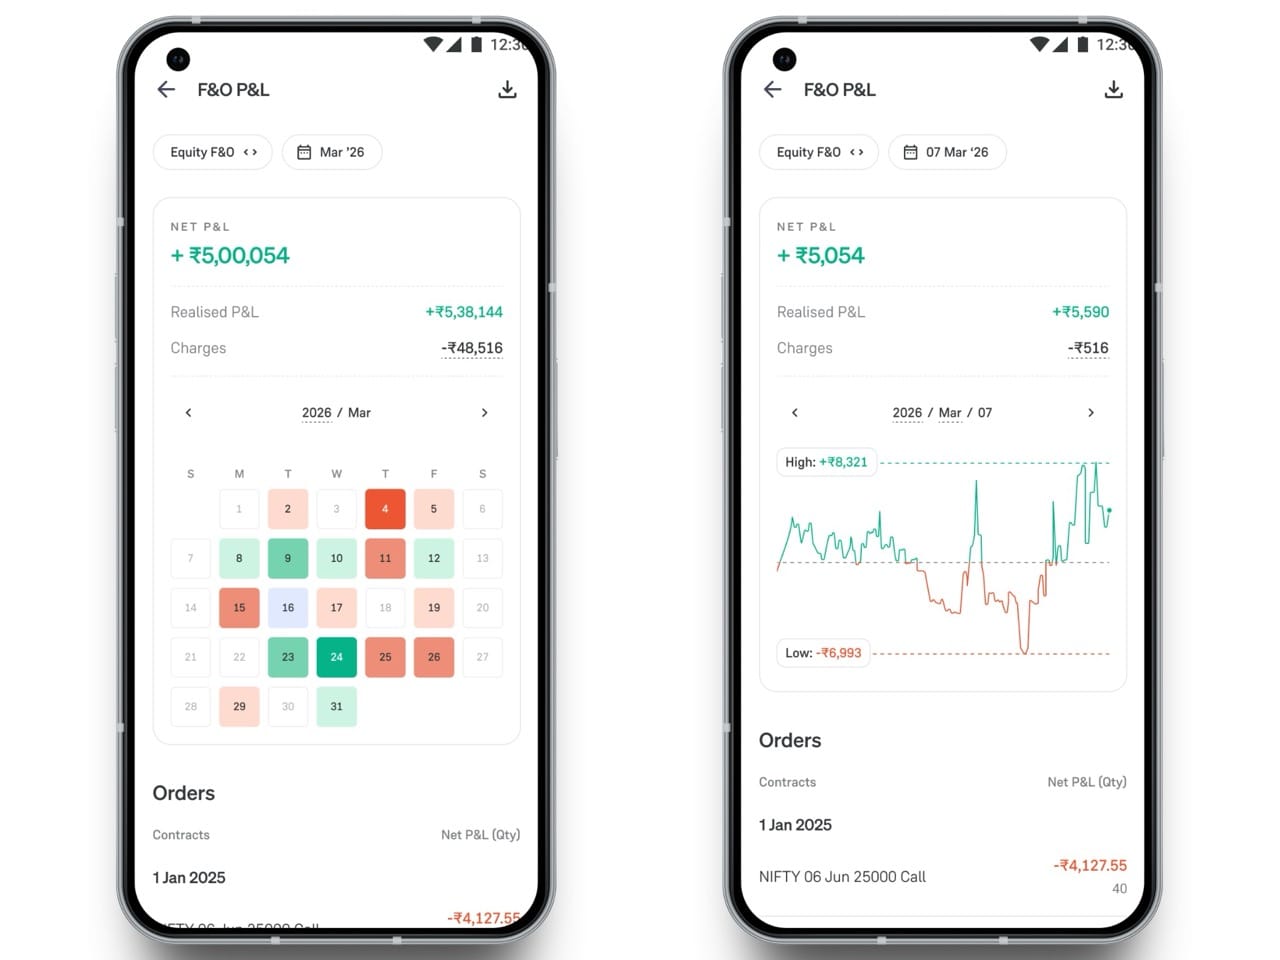
One of the biggest highlights of the F&O P&L Dashboard is the interactive day-level P&L chart.
Instead of only seeing your final P&L for the day, you can now see how your profits and losses changed throughout the trading session.
Simply move across the chart to view your P&L at different points in time and map it with the orders you placed or during significant market movements.
➡️ Get a Clear P&L Summary
Instantly view:
- Net P&L
- Realised P&L
- Charges
This helps you quickly understand how your trading day, month, or financial year performed.
➡️ Compare Performance Across Time Periods
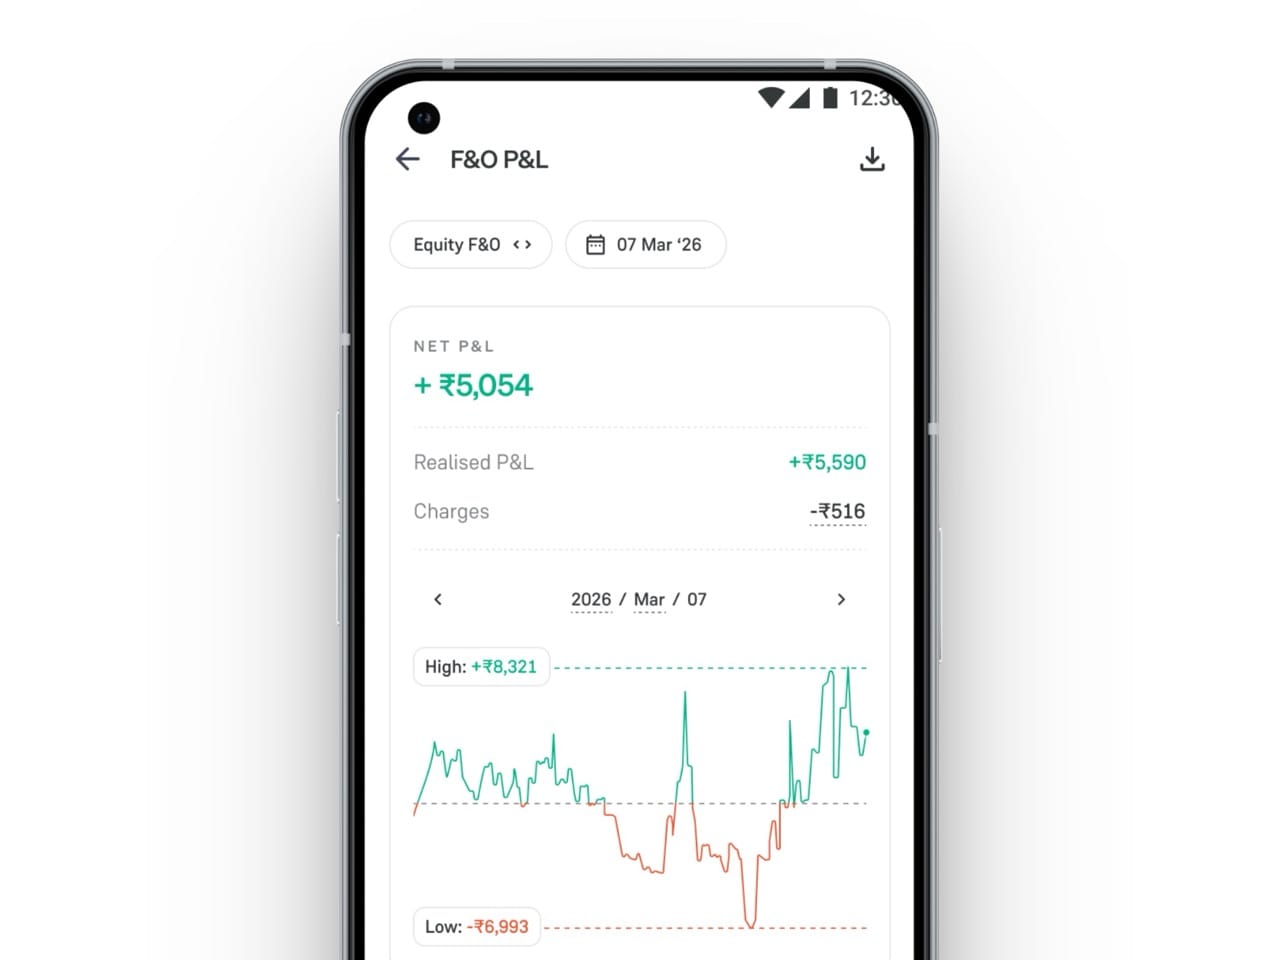
Analyse your trading performance across days/months/quarters/financial years.
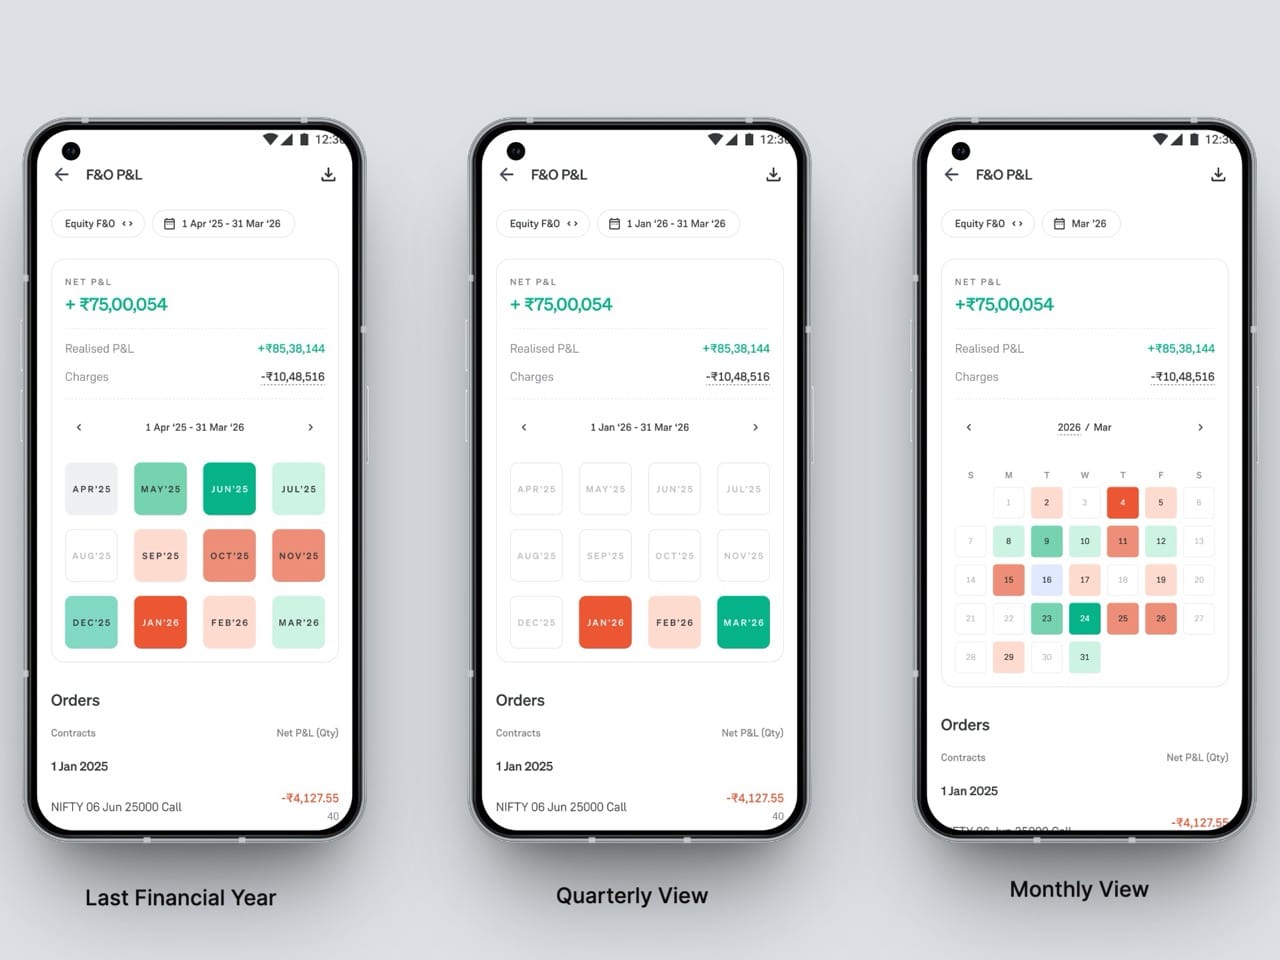
The colour-coded monthly performance view makes it easy to identify:
- your strongest trading months
- difficult periods,
- overall trading patterns

➡️ Review Order-Level Trade Insights
You can view detailed order-level breakdowns including:
- contracts traded
- quantities
- trade-wise P&L.
This helps you understand which trades worked, which didn’t, and where improvements can be made.
➡️ Download Reports Anytime
Need your data for analysis, taxes, or record keeping?
You can download your F&O P&L reports directly from the dashboard for further review whenever needed.
➡️ Separate Tracking for Equity F&O and Commodities
Track and analyse your performance separately across Equity F&O and Commodities, making it easier to evaluate segment-wise trading outcomes.
How to Access the F&O P&L Dashboard on Groww?
You can access the dashboard directly from the Groww app or website in just a few taps.
Step 1: Open Profile
Step 2: Tap on “Reports”
Step 3: Under the Profit & Loss section, tap on F&O P&L.
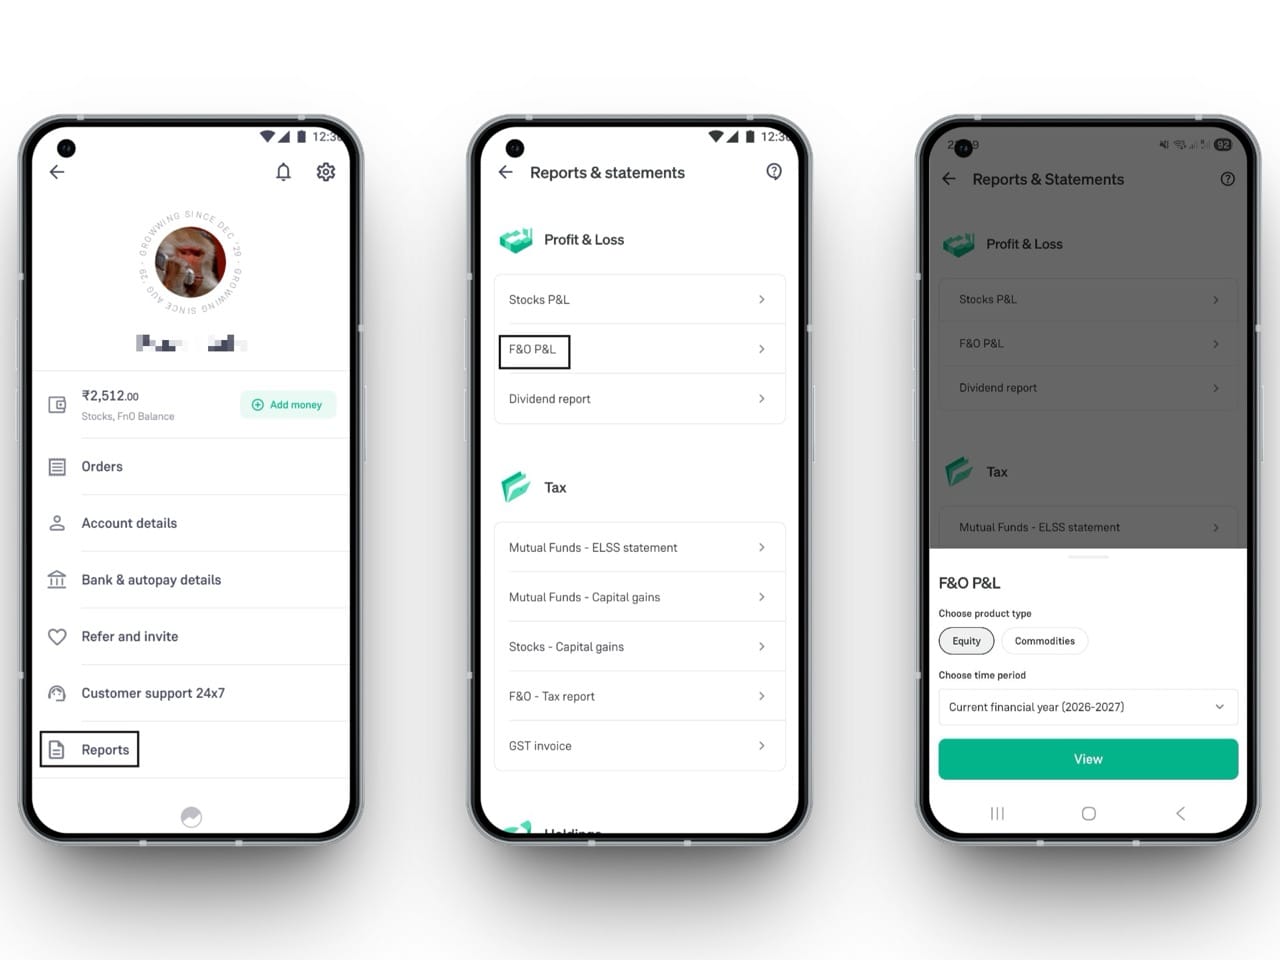
Step 4: Select Segment & Duration
Choose:
- Equity F&O or Commodities
- Daily, monthly, quarterly, or financial year duration
Step 5: View Your Trading Performance
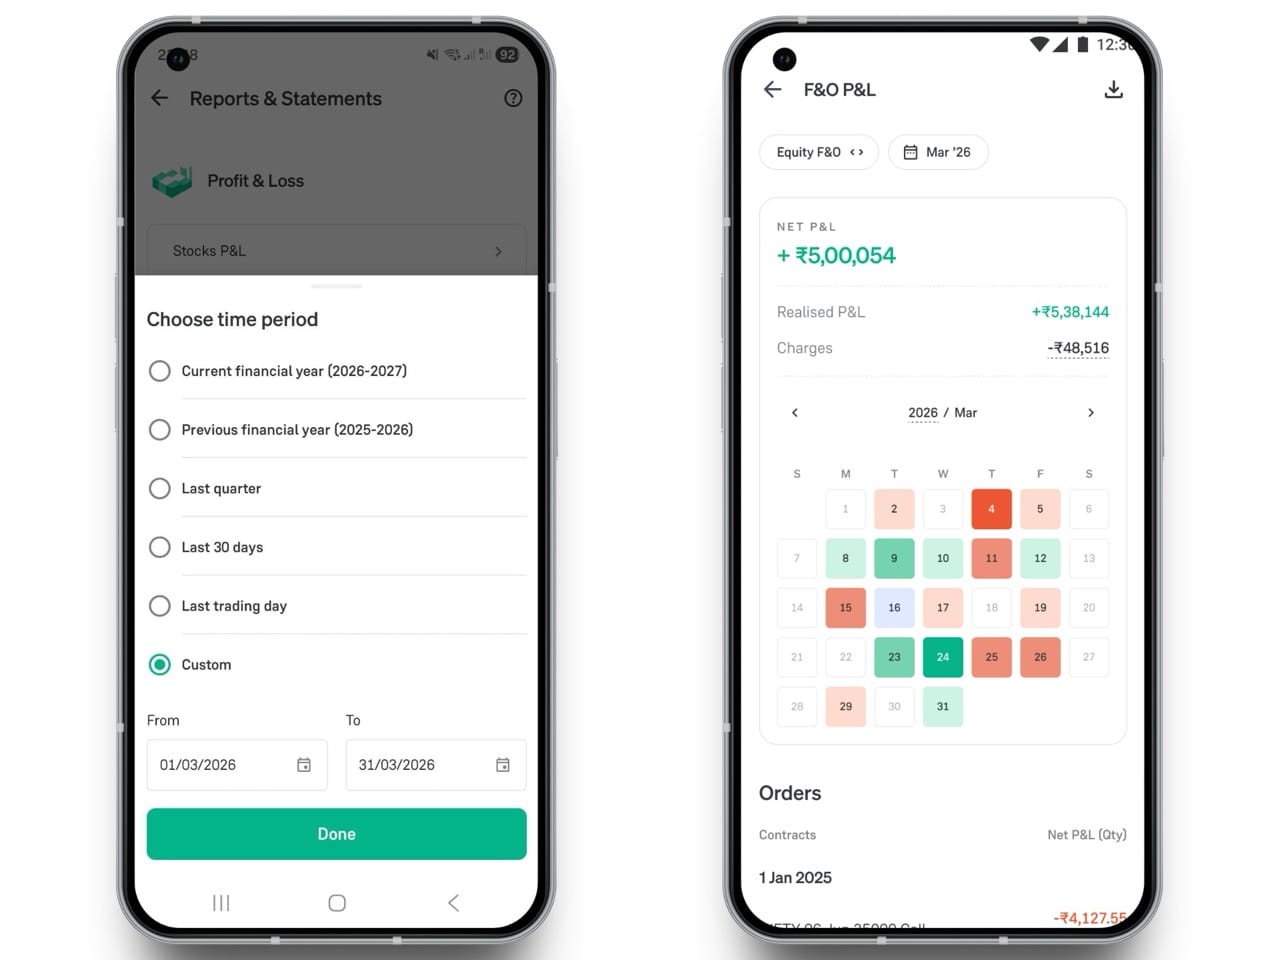
Understand Your Trading Performance Better
Every trader experiences profits and losses.
But the traders who improve consistently are the ones who analyse their performance, learn from mistakes, and refine their strategy over time.
Groww’s F&O P&L Dashboard is built to make that process simpler and faster.
Get a clearer view of your trading performance with detailed insights, trade-wise analysis, and downloadable reports — all in one place.
Ready to get started?
Explore it now and download your trading performance report.
- Team Groww
Other Updates