Directional Movement Index (DMI): Meaning, Calculation, and Trading Strategies


The Directional Movement Index (DMI) is a technical indicator that measures trend direction using two lines (+DI and -DI). It also includes a third line, the ADX, which measures trend strength. Traders use it to decide which side to trade and whether the trend is strong enough to trade.
Key Takeaways
- DMI is a trend-following indicator that shows both market direction and move strength.
- The DMI indicator consists of three components: +DI (upward strength), -DI (downward strength) and ADX (trend strength, not direction).
- A common strategy is the DI crossover to find the direction. Then ADX measures momentum strength.
What is the Directional Movement Index (DMI)?
The biggest pain point of trend followers is getting whipsawed in sideways markets. The Directional Movement Index (DMI) helps reduce this because it gives traders a sense of market direction and strength. J. Welles Wilder Jr. developed it and also created RSI and ATR, two of the most widely used indicators today.
Some traders argue that they can use SMA to identify direction. However, DMI can give added insight into whether the buyers or sellers are in control and how strong the trend is.
Components of Directional Movement Index (DMI)
The DMI consists of three components:
-
- +DI (Positive Directional Indicator): This measures the strength of upward price movement.
- -DI (Negative Directional Indicator): This measures the strength of downward price movement.
- ADX (Average Directional Index): This indicator measures trend strength. ADX does not indicate the direction of the movement.
How DMI is Calculated
Calculating DMI is slightly lengthy. Here are the steps:
Step 1: Calculate Positive and Negative Directional Movement
For this step, we require the previous day and current day data. Let’s take an example:
|
Date |
Open |
High |
Low |
Close |
|
01-07-2026 |
23897.65 |
24049.9 |
23895.1 |
24005.85 |
|
02-07-2026 |
24062.2 |
24194.55 |
24058.8 |
24175.7 |
|
Previous Day (July 1) |
Current Day (July 2) |
|
|
High |
24,049.90 |
24,194.55 |
|
Low |
23,895.10 |
24,058.80 |
Then we can calculate the up move = Current High - Previous High = 24,194.55 − 24,049.90 = 144.65
Also, we will calculate the down move = Previous Low - Current Low = 23,895.10 − 24,058.80 = −163.70
Now we will check which is larger. The up move is larger and positive, so +DM = 144.65 and −DM = 0.
Step 2: Calculate the True Range (TR)
Next, we need another input: the previous day's closing price. This value is 24,005.85 for 1 july. So, we can calculate the TR as below:
|
Calculation |
Value |
|
Current High − Current Low |
24,194.55 − 24,058.80 = 135.75 |
|
|Current High − Previous Close| |
|24,194.55 − 24,005.85| = 188.70 |
|
|Current Low − Previous Close| |
|24,058.80 − 24,005.85| = 52.95 |
The TR is the maximum value. Hence TR = 188.7
Step 3: Calculate +DI and −DI
Now we will repeat this step for all the days:
|
Date |
High |
Low |
Close |
+DM |
-DM |
TR |
|
01-Jul |
24,049.90 |
23,895.10 |
24,005.85 |
|||
|
02-Jul |
24,194.55 |
24,058.80 |
24,175.70 |
144.65 |
0.00 |
188.70 |
|
03-Jul |
24,378.15 |
24,252.35 |
24,270.85 |
183.60 |
0.00 |
202.45 |
|
06-Jul |
24,458.65 |
24,287.10 |
24,430.35 |
80.50 |
0.00 |
187.80 |
|
07-Jul |
24,530.90 |
24,348.95 |
24,398.70 |
72.25 |
0.00 |
181.95 |
|
08-Jul |
24,300.00 |
23,805.20 |
23,882.05 |
0.00 |
543.75 |
593.50 |
|
09-Jul |
24,134.70 |
23,925.70 |
23,962.80 |
0.00 |
0.00 |
252.65 |
|
10-Jul |
24,228.45 |
24,120.35 |
24,206.90 |
93.75 |
0.00 |
265.65 |
|
13-Jul |
24,259.80 |
24,000.20 |
24,211.00 |
0.00 |
120.15 |
259.60 |
|
14-Jul |
24,157.10 |
24,023.70 |
24,052.05 |
0.00 |
0.00 |
187.30 |
|
15-Jul |
24,220.35 |
24,010.55 |
24,078.50 |
63.25 |
0.00 |
209.80 |
|
16-Jul |
24,186.50 |
24,050.00 |
24,072.75 |
0.00 |
0.00 |
136.50 |
|
17-Jul |
24,367.30 |
24,099.05 |
24,334.30 |
180.80 |
0.00 |
294.55 |
|
20-Jul |
24,266.10 |
24,135.85 |
24,238.50 |
0.00 |
0.00 |
198.45 |
|
21-Jul |
24,262.20 |
24,135.65 |
24,187.70 |
0.00 |
0.20 |
126.55 |
|
Total (14 days) |
818.80 |
664.10 |
3,285.45 |
Wilder’s smoothing is not a simple moving average. The first smoothed value is the sum of the first 14 values, which is the Total row above. Each later value = previous smoothed value − (previous smoothed value ÷ 14) + current value. For example, smoothed TR on 22 Jul = 3,285.45 − (3,285.45 ÷ 14) + 226.30 = 3,277.08.
The next step is to find the +DI and -DI. This is just smoothing the values over a selected period. Usually, this is a 14-period. So, the formula is:
+DI = (Smoothed +DM ÷ ATR) × 100
−DI = (Smoothed −DM ÷ ATR) × 100
For July 21,
+DI = 818.80 ÷ 3,285.45 × 100 = 24.92
−DI = 664.10 ÷ 3,285.45 × 100 = 20.21.
Now, we can find the market direction. Since +DI > −DI, the indicator shows a bullish bias.
Step 4: Calculate ADX
Before we calculate the ADX, we have to find the Directional Index (DX). Here is the formula:
DX=(∣+DI−−DI∣) ÷ (+DI+−DI) ×100
Using the examples above:
DX = (|24.92 − 20.21| ÷ (24.92 + 20.21)) × 100 = (4.71 ÷ 45.13) × 100 = 10.43
The first ADX is the simple average of the first 14 DX values. After that, ADX = (previous ADX × 13 + current DX) ÷ 14. This needs 27 trading days of data in total, so the first ADX appears on August 7.
|
Date |
High |
Low |
Close |
+DM |
−DM |
TR |
Sm +DM |
Sm −DM |
Sm TR |
+DI |
−DI |
DX |
ADX |
|
21-Jul |
24,262.20 |
24,135.65 |
24,187.70 |
0.00 |
0.20 |
126.55 |
818.80 |
664.10 |
3,285.45 |
24.92 |
20.21 |
10.43 |
|
|
22-Jul |
24,166.30 |
23,961.40 |
23,996.25 |
0.00 |
174.25 |
226.30 |
760.31 |
790.91 |
3,277.08 |
23.20 |
24.13 |
1.97 |
|
|
23-Jul |
23,990.75 |
23,807.20 |
23,869.60 |
0.00 |
154.20 |
189.05 |
706.01 |
888.62 |
3,232.05 |
21.84 |
27.49 |
11.45 |
|
|
24-Jul |
23,823.60 |
23,606.30 |
23,767.45 |
0.00 |
200.90 |
263.30 |
655.58 |
1,026.05 |
3,264.49 |
20.08 |
31.43 |
22.03 |
|
|
27-Jul |
24,011.60 |
23,891.55 |
23,995.95 |
188.00 |
0.00 |
244.15 |
796.75 |
952.76 |
3,275.46 |
24.32 |
29.09 |
8.92 |
|
|
28-Jul |
24,041.15 |
23,954.60 |
23,985.35 |
29.55 |
0.00 |
86.55 |
769.39 |
884.70 |
3,128.05 |
24.60 |
28.28 |
6.97 |
|
|
29-Jul |
24,283.55 |
24,136.75 |
24,250.20 |
242.40 |
0.00 |
298.20 |
956.83 |
821.51 |
3,202.82 |
29.87 |
25.65 |
7.61 |
|
|
30-Jul |
24,342.95 |
24,187.10 |
24,317.15 |
59.40 |
0.00 |
155.85 |
947.89 |
762.83 |
3,129.89 |
30.28 |
24.37 |
10.82 |
|
|
31-Jul |
24,429.40 |
24,299.70 |
24,383.60 |
86.45 |
0.00 |
129.70 |
966.63 |
708.34 |
3,036.03 |
31.84 |
23.33 |
15.42 |
|
|
03-Aug |
24,774.30 |
24,515.15 |
24,774.30 |
344.90 |
0.00 |
390.70 |
1,242.49 |
657.75 |
3,209.87 |
38.71 |
20.49 |
30.77 |
|
|
04-Aug |
24,703.90 |
24,427.95 |
24,614.90 |
0.00 |
87.20 |
346.35 |
1,153.74 |
697.97 |
3,326.94 |
34.68 |
20.98 |
24.61 |
|
|
05-Aug |
24,677.60 |
24,497.95 |
24,624.65 |
0.00 |
0.00 |
179.65 |
1,071.33 |
648.11 |
3,268.96 |
32.77 |
19.83 |
24.61 |
|
|
06-Aug |
24,677.05 |
24,604.15 |
24,636.00 |
0.00 |
0.00 |
72.90 |
994.80 |
601.82 |
3,108.36 |
32.00 |
19.36 |
24.61 |
|
|
07-Aug |
24,630.40 |
24,522.75 |
24,570.65 |
0.00 |
81.40 |
113.25 |
923.75 |
640.23 |
2,999.58 |
30.80 |
21.34 |
18.13 |
15.60 |
A few things to understand from the table:
First ADX (7 Aug) = the average of the 14 DX values above = 218.35 ÷ 14 = 15.60.
DX is the same (24.61) on 4, 5 and 6 Aug because both DMs were 0 on 5 and 6 Aug. Both smoothed values shrink by the same 1/14, so the +DI to −DI ratio does not change.
Notice 7 Aug: +DI (30.80) is well above −DI (21.34), a bullish bias, but ADX is only 15.60, below 20. The trend is not strong enough to trade. ADX then stays below 20 through 1 Sep (16.94). This is exactly why traders add the ADX filter.
How to Read and Interpret Directional Movement Index (DMI)
To interpret the indicator, look at +DI, -DI, and ADX together. Here are the rules:
- All three lines (+DI, −DI, ADX) range from 0 to 100.
- +DI above -DI: Indicates bullish momentum.
- -DI above +DI: Indicates bearish momentum.
- ADX above 25 and rising: Indicates a strong, strengthening trend.
- ADX above 25 but falling: Indicates the trend is losing steam.
- ADX below 20: Indicates a weak or sideways market.
This is how it looks on the chart:
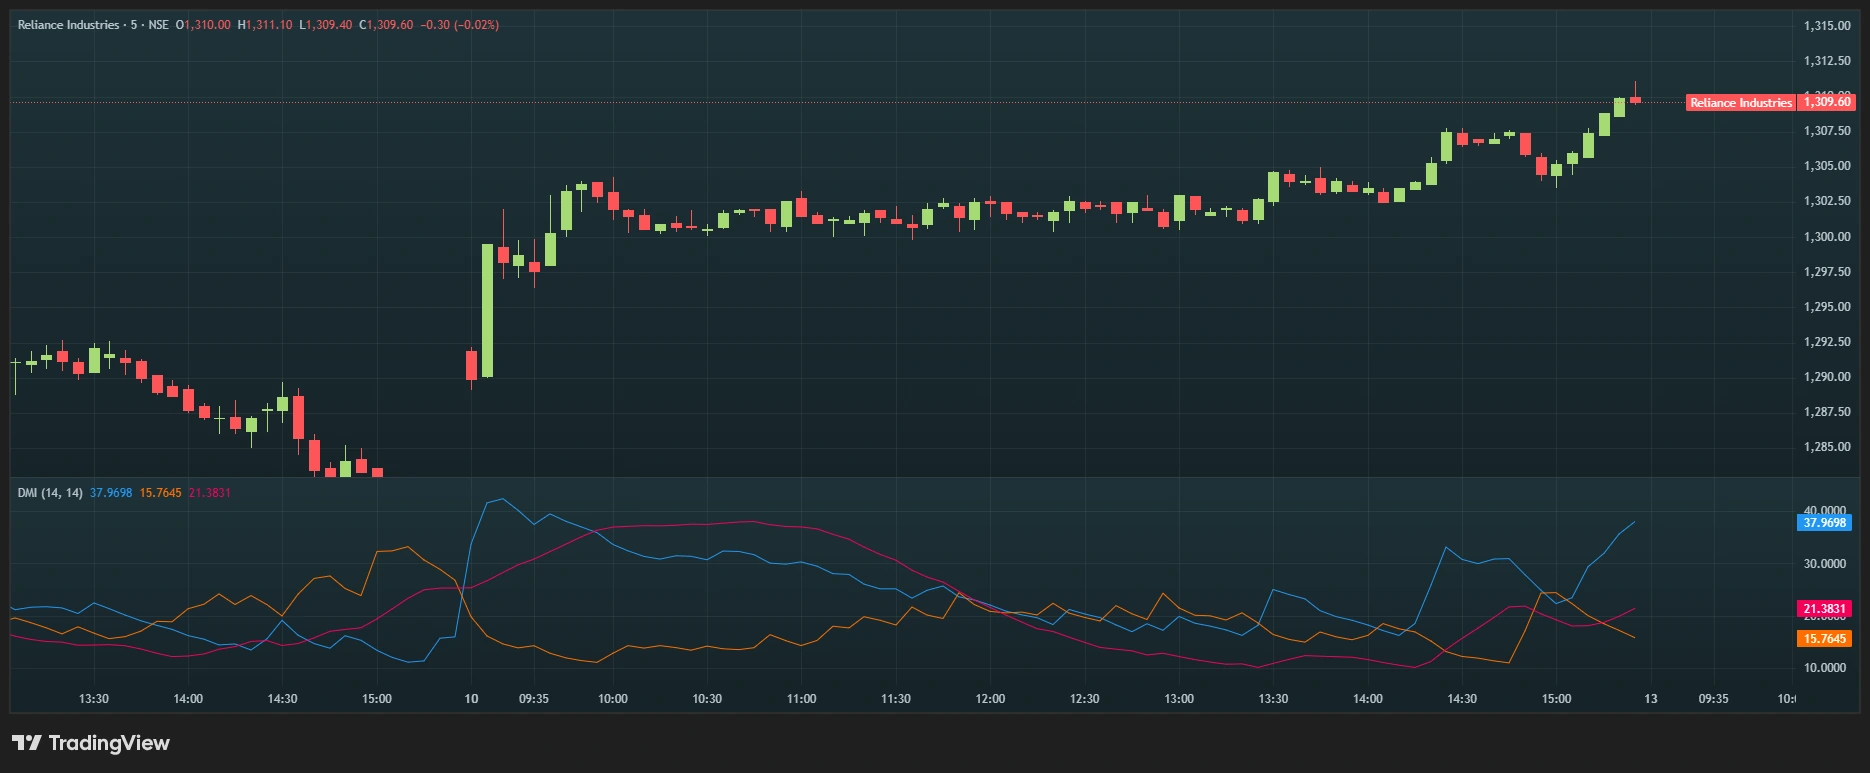
Here is Reliance on the 5-minute timeframe. The blue line is +DI and the orange line is -DI. The red line is the ADX.
Understanding +DI, -DI, and ADX
Although they are displayed together, each component serves a different purpose.
|
Indicator |
What It Measures |
Interpretation |
|
+DI |
Bullish directional movement |
Higher values indicate stronger buying pressure. |
|
-DI |
Bearish directional movement |
Higher values indicate stronger selling pressure. |
|
ADX |
Trend strength |
Higher values indicate a stronger trend, irrespective of direction. |
Trading Strategies Using Directional Movement Index (DMI)
As seen in the chart above, +DI crossed above -DI. This is the DI Crossover Strategy. This is a bullish signal. On the other hand, when -DI crosses above +DI, it is a bearish signal, because sellers have taken control from buyers.
A lot of traders include ADX here to confirm the momentum. If ADX is rising above 25, then the trend is strong, and a long trade can be initiated.
Benefits of Using Directional Movement Index (DMI)
DMI is a complete indicator because it shows both trend direction and trend strength. This can help traders avoid weak markets.
The indicator works best during breakouts and even across different asset classes and timeframes.
Limitations of Directional Movement Index (DMI)
Like all trend-following indicators, DMI performs best in trending markets and may generate false signals during sideways or highly choppy conditions. Since it relies on historical price data, it is also a lagging indicator and may react after a trend has already begun.
Another common mistake when using DMI is trading DI crossovers when ADX is below 20. This can be risky because ADX is a lagging indicator.
So traders should confirm price structure and key support and resistance levels before entering.
Conclusion
The Directional Movement Index (DMI) is a versatile trend-following indicator that helps traders identify bullish and bearish trends while measuring their strength through the ADX. The indicator combines 3 lines, +DI, -DI, and ADX, which together help traders identify the direction and strength of the move.