Nifty 50 vs Nifty Next 50 vs Nifty 100
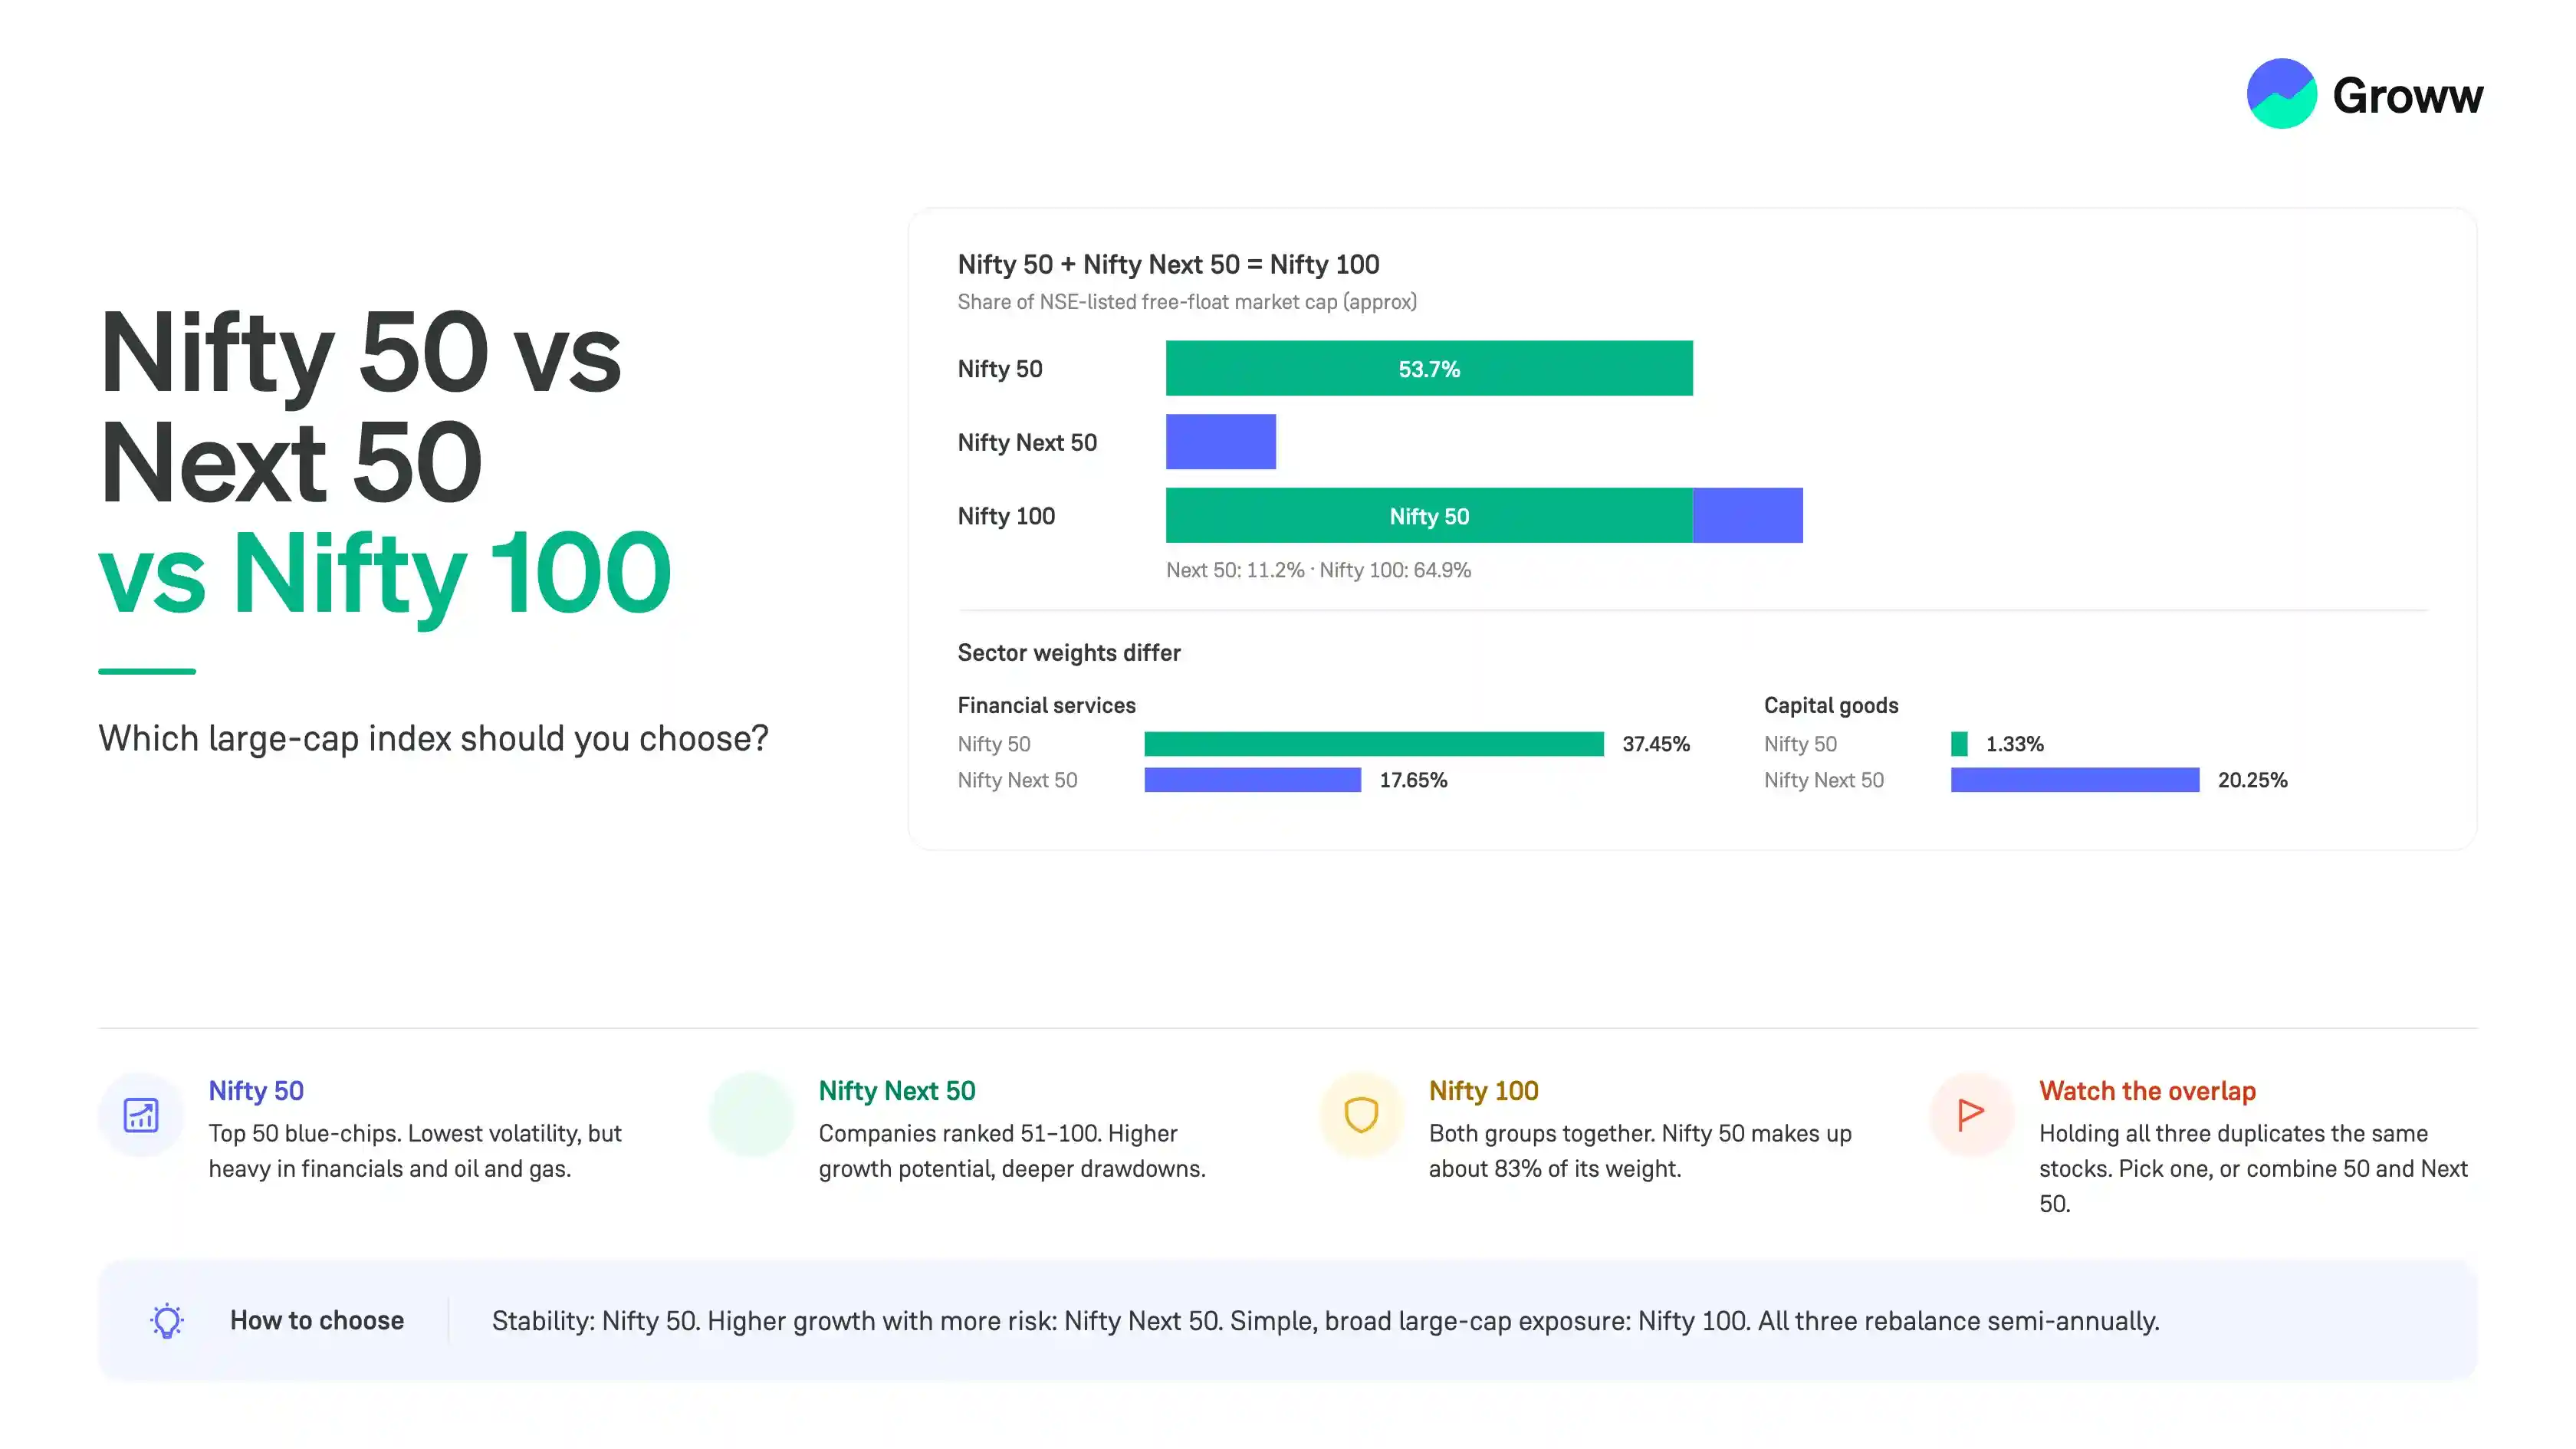


The Nifty 50, Nifty 100, and Nifty Next 50 are all among the leading large-cap indices on the NSE (National Stock Exchange) of India. The Nifty 50 tracks the top 50 heavyweight blue-chip companies and offers relatively lower volatility and higher stability for investors.
In comparison, the Nifty Next 50 tracks the next 50 blue-chip companies (51-100). It may offer higher growth potential but comes with higher volatility. The Nifty 100 combines both indices to offer broader large-cap market exposure and wider sector-based diversification.
Here is how they relate to each other:
- The Nifty 50 tracks the top-50 biggest and most liquid companies in the country.
- The Nifty Next 50 tracks the next 50 companies (51-100).
- The Nifty 100 combines both groups together and covers all 100 top companies as a major large-cap index.
So, in essence, Nifty 50 + Nifty Next 50 = Nifty 100
Which large-cap index should you choose? Here is a guide to all three indices, their similarities, differences, and how to choose.
Key Takeaways
- The Nifty 50 includes the top 50 large-cap companies and usually has lower volatility, whereas the Nifty Next 50 covers the next 50 companies and could provide higher growth potential at the cost of greater risk.
- The Nifty 100 index includes both the Nifty 50 and the Nifty Next 50, thus giving wider exposure to the top 100 large-cap companies through a single index.
- Although the three indices all employ free-float market capitalisation weighting, their sector allocations, the make-up of the companies they contain, and their risk profiles are different.
- The Nifty Next 50 has, in the past, yielded higher long-term returns during certain market cycles, but it may also suffer steeper drawdowns than the Nifty 50.
- Depending on their level of risk tolerance, investment time frame and desire for stability, growth or more extensive exposure to large companies, investors may select between the Nifty 50, Nifty Next 50 or Nifty 100.
- Putting money into all three options can result in a great deal of overlap. A fund that tracks the Nifty 100 might be appropriate for people who want a simpler and more general exposure, whereas combining the Nifty 50 with the Nifty Next 50 enables investors to adjust their allocation.
What is the Nifty 50 Index?
The Nifty 50 monitors the weighted performance of the 50 biggest and most liquid blue-chip companies listed on the NSE across multiple sectors. It is the flagship stock market index of the NSE, representing about 53.7% (subject to change) of the free-float market capitalisation of NSE-listed stocks.
Here are some of its key aspects:
- Often regarded as the primary or main barometer of the country’s economy and a reflection of its overall financial health and market sentiments.
- The index is computed with a free-float market capitalisation-weighted method. This means weights may be assigned on the basis of the value of shares available for public trading.
- Leading Nifty 50 sectors include information technology, financial services, consumer goods and oil and gas.
- Leading constituents often include top names like Reliance Industries, ICICI Bank, HDFC Bank and others.
- Global asset managers and financial institutions often use the Nifty 50 as a benchmark for various investment products. These may include exchange-traded funds or ETFs, mutual funds and structured derivatives.
Dated Sector Weights and Top Holdings (30 September, 2026):
- Financial Services: 37.45%
- Oil and Gas: 9.39%
- IT: 7.52%
- Auto: 6.65%
- FMCG: 5.50%
Top Holdings:
- HDFC Bank: 10.38%
- ICICI Bank: 9.05%
- Reliance: 7.58%
What is the Nifty Next 50 Index?
The Nifty Next 50 index signifies what it tracks through its name itself. It tracks the next tier (51-100) of large-cap companies listed on the National Stock Exchange (NSE). So, it includes the next 50 companies from the Nifty 100 index after excluding the constituents of the flagship Nifty 50 index.
Here are some key aspects:
- It tracks these constituents based on the free-float market capitalisation methodology.
- The index offers exposure to stocks that could be possible blue-chip biggies in the near future.
- It works as a breeding ground or incubator of sorts, from which successful entities often graduate into the flagship Nifty 50 during rebalancing (done semi-annually). Interestingly, 52 stocks have moved up since 2002 from the Nifty Next 50.
- The Nifty Next 50 is well-diversified throughout multiple sectors and, interestingly, often has lower sectoral concentration than the Nifty 50.
- It does have slightly higher risks and volatility levels than the top-50 constituents (Nifty 50). However, it has historically delivered higher growth potential as well.
- Investors can tap into this index through ETFs and index funds to capture the growth prospects of rapidly growing market leaders before they gain flagship status.
What is the Nifty 100 Index?
The Nifty 100 Index is a diversified index that tracks the performance and behaviour of the top 100 companies listed on the NSE (based on full market capitalisation). So, it combines the Nifty 50 and Nifty Next 50 indices and is a broader representation of how India’s large-cap market segment is performing.
Here are some key aspects:
- The Nifty 100 represents roughly 70% (subject to change) of the overall free-float market capitalisation of all NSE-listed stocks.
- It thus offers a more holistic and extensive picture of the equity market than just relying on the Nifty 50.
- This is because it covers not just market powerhouses, but also rapidly emerging large-cap entities.
- It is rebalanced semi-annually to ensure proper representation of present market realities and liquidity standards.
- The index may be a vital benchmark for institutional investors, investment funds, and portfolio managers looking for broader exposure to core economic growth drivers.
Nifty 50 vs. Nifty Next 50 vs. Nifty 100
Here is a side-by-side comparison of the three indices:
|
Key Feature |
Nifty 50 |
Nifty Next 50 |
Nifty 100 |
|
Number of Constituents |
50 stocks |
50 stocks |
100 stocks |
|
Market Cap Range Ranking |
1-50 |
51-100 |
1-100 |
|
Free-Float Market Coverage |
53.7% of NSE-listed ecosystem (approx) |
11.2% of NSE-listed ecosystem (approx) |
64.9% of NSE-listed ecosystem (approx) |
|
Weighting Methodology |
Free-Float Market Capitalisation |
Free-Float Market Capitalisation |
Free-Float Market Capitalisation |
|
Primary Sectoral Concentration |
Highly concentrated (Financial sector and oil and gas dominant) |
Widely diversified throughout cyclical sectors |
Balanced (heavily mirrors Nifty 50) |
|
Historical Volatility & Risk Profile |
Lowest (stable blue-chips) |
Highest (aggressive/aspiring large-caps) |
Moderate (Core combination) |
|
Maximum Drawdown Potential |
Managed/moderate |
Deep/high recovery period |
Managed (weighted to top 50) |
Here are some key aspects:
Weighting Methodology (Free-Float Market Capitalisation)
- Free-Float Market Capitalisation: All three indices use a free-float market capitalisation-weighted formula. The company’s index directly correlates to the market value of publicly traded shares in the open market.
- Weight Skew: Since it is cap-weighted, the Nifty 100 is mainly dominated by the leading 50 stocks. Nifty 50 represents almost 83% of the total weight of the Nifty 100 (approx). This means that investments in Nifty 100 closely track the standard Nifty 50.
- Frequency of Rebalancing: NSE Indices rebalance and review stock allocations and boundaries across all three setups semi-annually.
Sector Concentration Comparison
- Nifty 50 Concentration: High sector concentration, with more priority usually focused on the financial services and information technology segments. The top 5 stocks are about 36% and the top 10 about 52%. The sectoral contrast is clear with financial services at 37.45% and capital goods at only 1.33%.
- Nifty Next 50 Diversity: Offers more diversification, with no single segment dominating the asset mix. Allocations are more evenly spread throughout segments like pharmaceuticals, consumer goods, engineering and chemicals. The top 5 and 10 are about 20% and 34% respectively. The finanical services sector takes up 17.65%, while capital goods take up 20.25%.
- Nifty 100 Baseline: Marginally dilutes the heavy sector concentration of the Nifty 50, although it is more inclined towards the financial sector (due to the huge weight of large-cap banks).
Historical Returns (1-Year, 5-Year, 10-Year CAGR)
- Long-Term Performance Tendency: Throughout multi-decade horizons, the Nifty Next 50 has historically performed better than the Nifty 50. This indicates the high-growth trajectories of companies graduating into the mega-cap category.
- Market Cycle-Based Volatility: Over shorter periods, the standard annualised returns may fluctuate considerably. For structural bull runs, Nifty Next 50 may outperform the others significantly. However, in stagnant or correction-driven cycles, the Nifty 50 may yield better risk-adjusted returns.
- In the Middle: The Nifty 100 sits between the others. It offers the stability of the top 50 companies and modest gains from the Next 50 segment.
*as of 30th September, 2026
|
Index |
1-Year Total Return |
5-Year Total Return |
10-Year Total Return |
|
Nifty 50 |
-7.09% |
6.38% |
11.48% |
|
Nifty 100 |
-5.18% |
7.06% |
11.68% |
|
Nifty Next 50 |
3.74% |
11.44% |
12.93% |
*Note: Figures are approximate and subject to fluctuations.
Volatility and Drawdown Comparison
- Nifty 50: Has the most stable risk profile among the three large-cap indices. Dominant positions and large cash reserves often safeguard mega-caps in downturns, leading to shorter recovery cycles.
- Nifty Next 50: Has higher volatility (sometimes similar to mid-cap stock trends) and witnesses deeper maximum drawdowns in volatile periods. It needs longer investment horizons for enduring price corrections.
- Nifty 100: Works to cushion systemic equity jolts with higher concentration of blue-chip and stable holdings.
Here are some facts that will help put things in perspective:
- 5-year annualised volatility: 13.8% for Nifty 50 and 17.9% for the Nifty Next 50.
- Worst fall: About -38% (Jan-Mar, 2020) for the Nifty 50 and -41% (Jan 2018-Mar 2020) for the Nifty Next 50.
- Distance from all-time high: About -13% for the Nifty 50 and about -10% for the Nifty Next 50.
How Companies Move Between Nifty 50 and Nifty Next 50
Companies may move between the Nifty 50 and Nifty Next 50 through a semi-annual index reconstitution procedure. NSE Indices Limited manages it.
Here is the timeline and schedule:
- Semi-annually/twice each year.
- Cut-Off Dates: 31 January (changes in March) and 31 July (changes in September).
- Execution: Changes are implemented from the last trading day of March and September. The September 2026 changes, for example, took effect from 30 September, after the close on 29 September.
- Announcements are usually made 4 weeks before (regarding any changes).
Rules for Moving Between Indices:
- 1.5x Free-Float Market Capitalisation Rule: For replacing any constituent of the Nifty 50, the eligible candidate should have an average free-float market capitalisation of at least 1.5 times (150%) the free-float market cap of the smallest existing constituent it wishes to replace (over the preceding six months). Stocks that cross this threshold and meet other norms may move up into the Nifty 50.
- Reverse Movement: Companies sometimes drop out of the Nifty 50 and come down to the Nifty Next 50. This happens due to market capitalisation changes or failure to meet trading or liquidity metrics.
Compulsory Eligibility Parameters:
- F&O Category: The stock should be traded in this segment.
- Liquidity (Impact Cost): Should have an average impact cost of 0.50% or less for 90% of the observations (over the last six months).
- Trading Frequency: 100% or near-100% trading frequency for the review period.
- Listing History: Should adhere to minimum listing criteria (usually one month for Nifty 50).
The NSE Indices Sub-Committee makes the final call, although mechanical rankings and systems trigger most shifts. Yet, the organisation has the authority to use its discretion in case of unexpected corporate actions, sudden regulatory hurdles, or mergers/demergers.
How a Return Gap Compounds Over 10 Years
Here is an assumption of how a return gap compounds over ten years.
|
Nifty 50 |
Nifty Next 50 |
|
Initial Investment Amount: ₹1,00,000 |
Initial Investment Amount ₹1,00,000 |
|
Investment Duration: 10 years |
Investment Duration: 10 years |
|
Assumed CAGR: 12% |
Assumed CAGR: 14% |
|
Value after 10 years: ₹3,10,585 |
Value after 10 years: ₹3,70,722 |
|
Net Profit: ₹2,10,585 |
Net Profit: ₹2,70,722 |
Which Index Fund or ETF Should You Buy?
- Expense Ratio: Direct-plan index funds may charge around 0.05-0.20% for Nifty 50 and Nifty 100. Nifty Next 50 index funds/ETFs may sometimes have higher expense ratios (0.30-40%), depending on the fund house. ETFs usually have lower expense ratios than index funds (but brokerage and transaction costs apply).
- Tracking Error: It measures how closely the fund is replicating the index. Nifty 50 funds usually have the lowest tracking error (with high liquidity and daily trading volumes). Nifty Next 50 funds may have marginally higher tracking errors (some constituents may trade less frequently than big blue-chip corporations).
- Which Vehicle Suits You: Index funds are ideal for SIPs and long-term investments without demat accounts. ETFs are ideal for intraday trading through brokerages.
Taxation of Index Fund Investments
Index funds that track the Nifty 100, Nifty 50 and Nifty Next 50 all have more than 65% of their portfolios in domestic equities. Hence, they have the same equity-focused taxation structure. In this scenario, the taxation structure is the following:
- STCG (short-term capital gains): Holding period is less than 12 months with rates of 20% (plus surcharge/cess).
- LTCG (long-term capital gains): Holding period is more than 12 months with rates of 12.5% (without indexation benefits) above the exemption limit of ₹1.25 lakh per year.
For SIPs (systematic investment plans), every monthly instalment will be counted as an individual purchase. The holding period and subsequent STCG/LTCG will be calculated independently for each instalment using the First In, First Out (FIFO) method. Note that the FY2026-27 capital gains rules were left unchanged in the Union Budget 2026. Also, switching between index funds will count as a redemptoin, triggering capital gains taxes. Hence, the most tax-efficient way you can add an index is via new SIPs.
Which Index Should You Choose?
Who Should Consider Choosing Nifty 50?
- More conservative equity investors looking for lower volatility.
- Investors who want reliable dividends with long-term wealth creation.
- Institutional fund allocation targets.
- Beginners in the stock market.
Who Should Consider Choosing Nifty Next 50?
- Aggressive growth seekers looking for mid-cap-like returns.
- Those with long-term horizons and risk-tolerant capital allocators.
- Future blue-chip identifiers.
Who Should Consider Choosing Nifty 100?
- Investors seeking broader, core exposure without manual rebalancing.
- Long-term and hands-off Investors with moderate risk profiles.
- Those looking for a more complete large-cap ecosystem with automated top-tier allocations.
How to Decide: A Simple Investor Checklist
- Risk Level Verification: Check your risk level carefully at the outset. Go for Nifty 50 if you are worried about market drops. Nifty Next 50 is okay if you can take risks and stay calm during sharp price fluctuations.
- Timeframe: The Nifty Next 50 or Nifty 100 works better if you have a long-term investment horizon (more than 5 years) and want compounding growth.
- Operational Mechanisms: The Nifty 100 gives you an all-in-one large-cap fund. If you want more active control and customisation, you can buy Nifty 50 and Nifty Next 50 funds separately.
Can You Invest in All Three Together?
You can invest in all three indices together, but it will often create significant redundancy and overlapping holdings. The Nifty 100 combines the other two, so if you invest in it, you will not have to buy the same stocks twice.
Buying a Nifty 50 fund and a Nifty 100 fund doubles your allocation to the top 50 companies without adding new market exposure. All stocks in the Nifty Next 50 are part of the Nifty 100, and the same is true for the Nifty 50.
How to Combine and Invest:
Simple Approach (Only Nifty 100):
- Buy only a Nifty 100 ETF or index fund.
- Get exposure to all the top 100 large-cap companies with one product and automatic rebalancing.
Customised Approach (Nifty 50 + Nifty Next 50):
- Split allocation between a Nifty 50 fund and Nifty Next 50 fund, fully skipping the Nifty 100.
- The Nifty 50 and Nifty Next 50 help you select the exact ratio/split, i.e. 50:50, 60:40 or 70:30, depending on your preferences.
- Sometimes the Nifty 100 may be heavily weighted in favour of the top 50 stocks. Hence, you can use this method to manually rebalance the portfolio over time.
Key Takeaways:
- A single Nifty 100 investment may be more operationally efficient and automated. Just make one transaction and track one fund, with the index rebalancing automatically between the top 50 and next 50, along with lower maintenance needs for passive and long-term investors.
- Combining the Nifty 50 and Next 50 may, however, offer more customised control over asset allocation. However, you will have two separate funds and periodic rebalancing to deal with (for maintaining your chosen target ratio).
- You can still flexibly overweight the Nifty Next 50 (historically offers more growth potential with more volatility) during broad market rallies. Active investors may thus choose this combination at times.
Conclusion
It is important to weigh the risk profile, volatility and intrinsic nature of each index before deciding where to invest. As observed, the Nifty 100 suits you if you want a long-term and passive approach to investing with automatic rebalancing. However, if you want more customisation, manual rebalancing and a personalised capital split, you may consider a combination of the Nifty 50 and Nifty Next 50 instead. Consider your risk tolerance and investment horizon before deciding.