Fundamentals of Mean Reversion in Trading
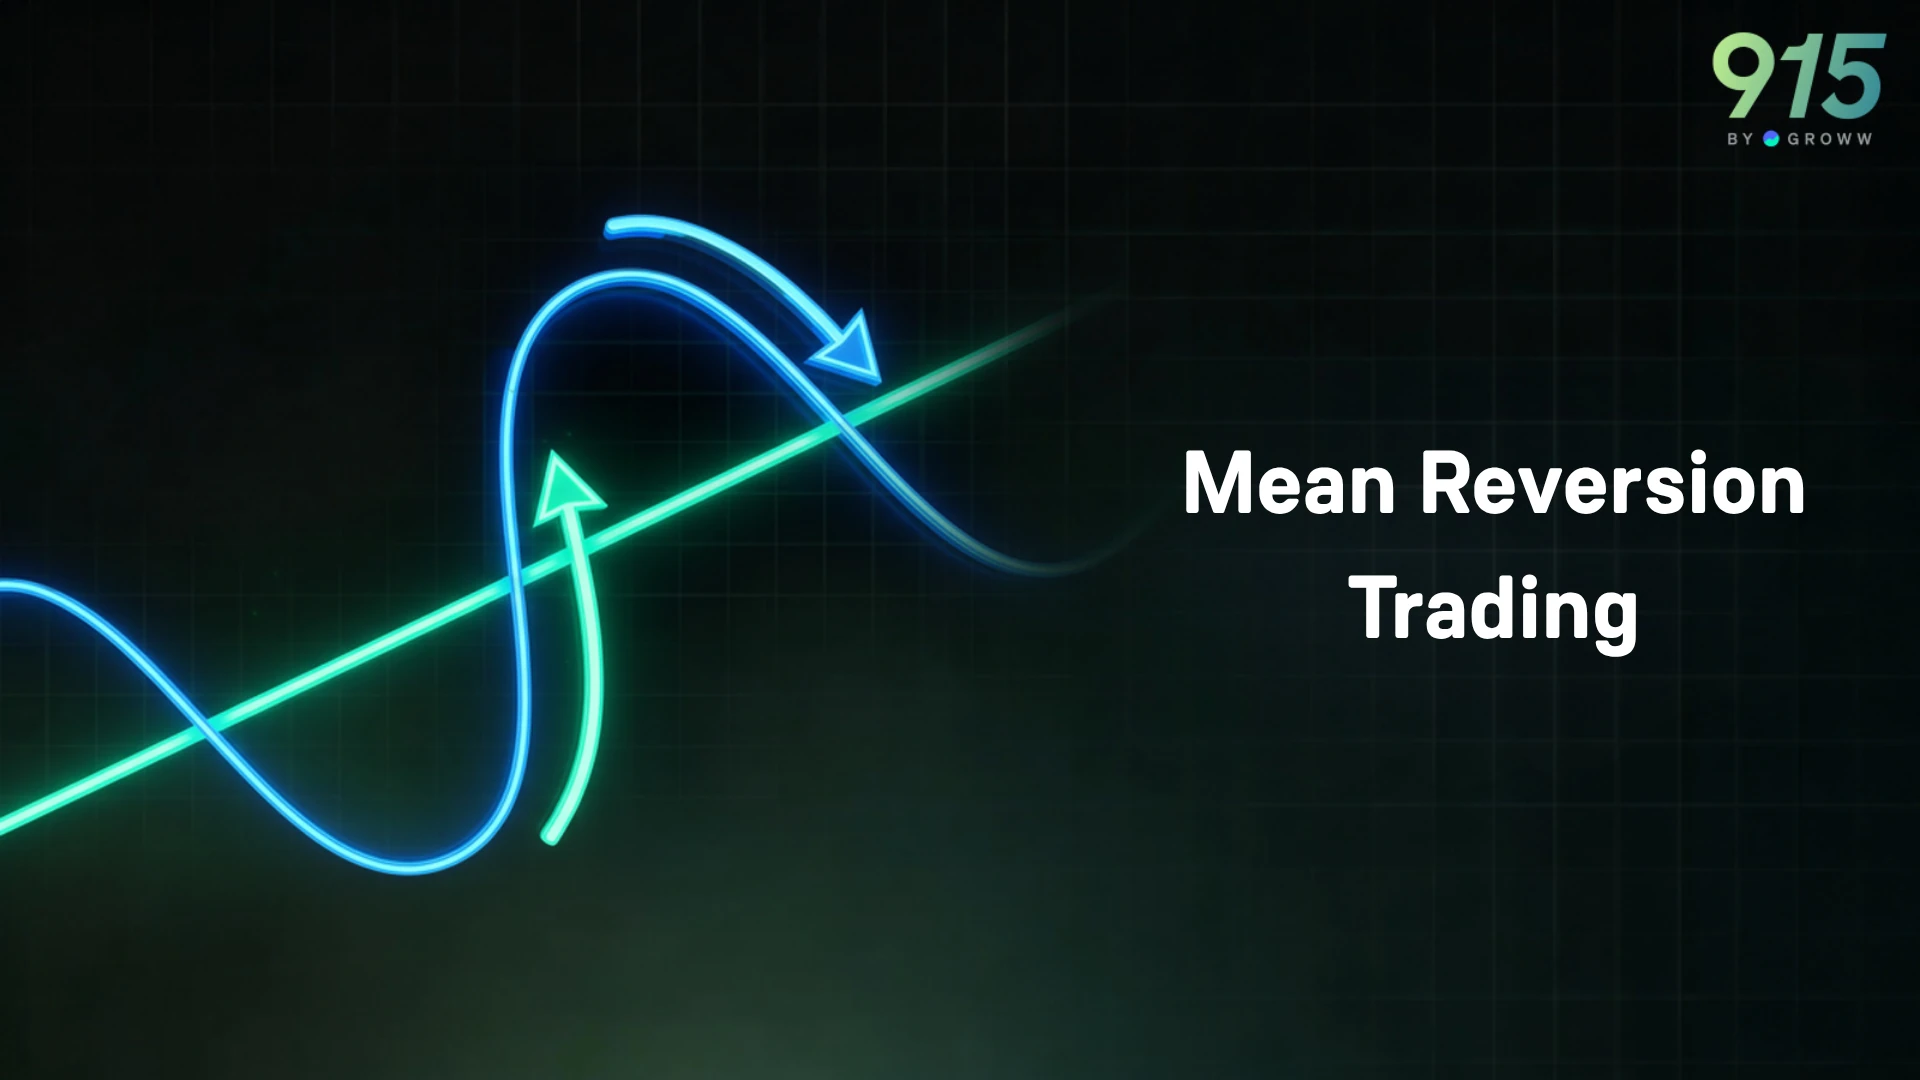


Mean reversion is a financial theory suggesting that asset prices and historical returns eventually return to their long-term average.
What goes up must come down' is an old saying that frequently applies to the stock market. Because it is extremely rare for stock prices to move in one direction indefinitely, prices eventually reverse to their average level - a phenomenon known as mean reversion.
What Mean Reversion Means in Trading
Most stocks tend to return to the average once they are overextended. This phenomenon is known as mean reversion. Usually, the word “mean” can refer to any of the below:
- A moving average
- Historical average price
- Long-term equilibrium level
- Statistical average
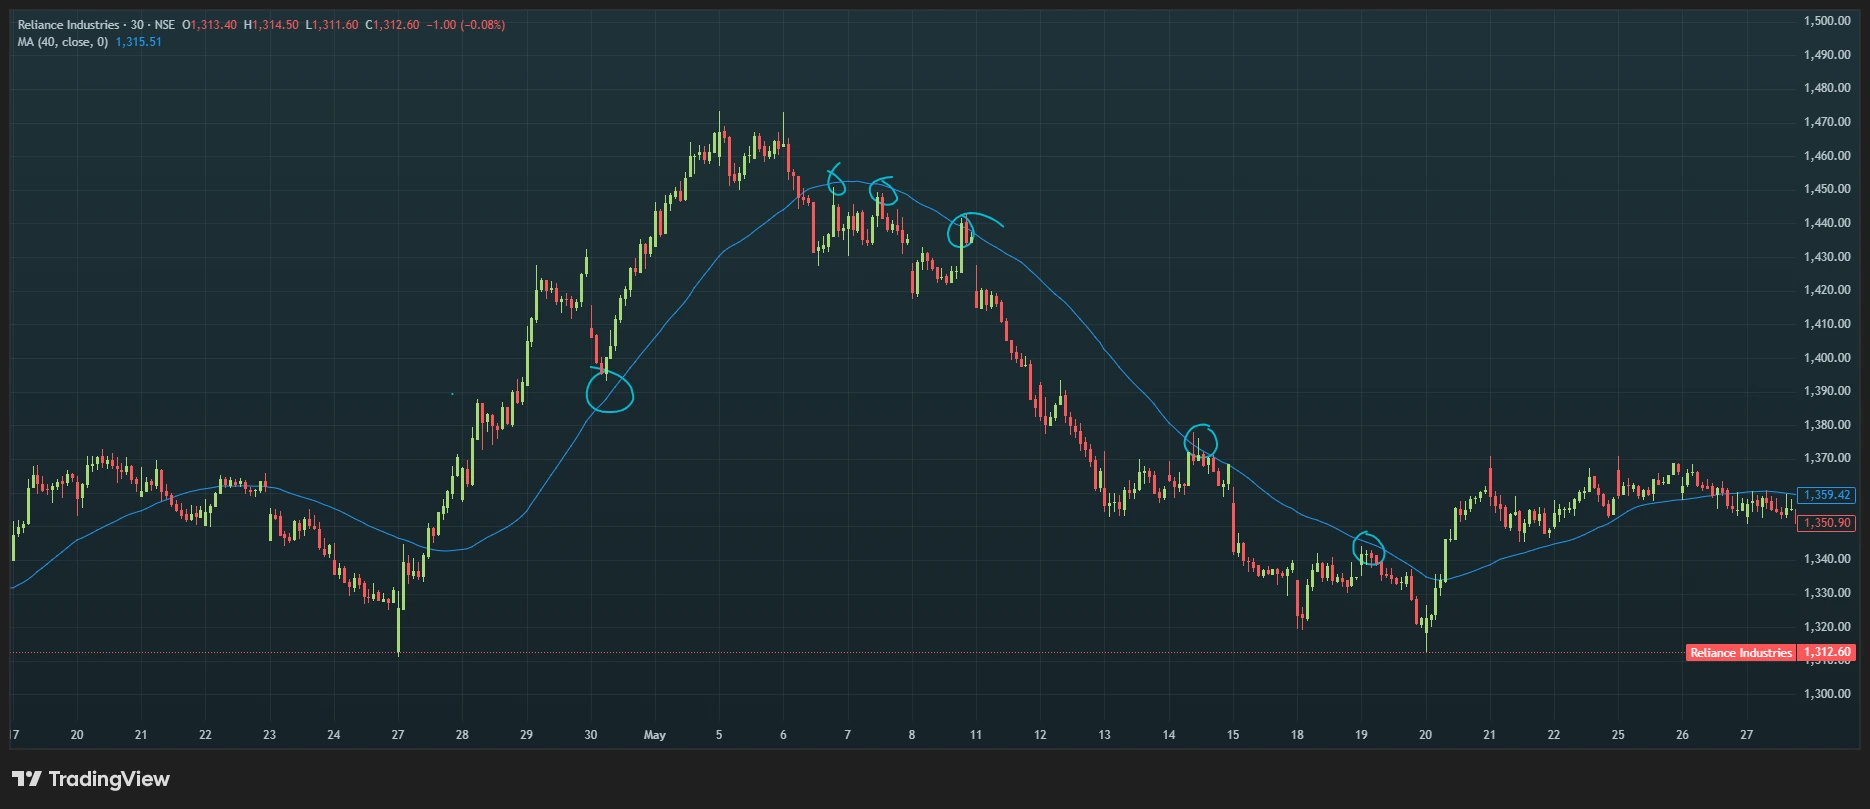
Let's take an example/ Here is Reliance on a 30-minute timeframe. The moving average is added, which acts like a mean. As you can see, once the price moves too far in one direction, it tries to come back and touch the moving average, as shown with circles.
Here is a key distinction. Mean reversion can be understood as both a chart pattern and a statistical phenomenon. The idea is that extreme deviations from a long-term historical average tend to normalise over time. However, this isn't limited to charts. For example:
Stock Valuations: When stock valuations are too extreme (high P/E ratio), then the stock can fall dramatically. This is usually the end of a bubble.
Volatility: IV is considered to be mean-reverting in the long term. So, when IV spikes during a market event, it typically falls back after the event is over. This is usually seen in event trading strategies. .
Spreads Between Assets: If two assets are correlated, but the gap between them increases too much, they tend to come towards each other. This is the basis of pairs trading
Why Prices Revert Toward the Mean
Mean reversion can happen due to any of the following reasons:
Profit Taking: When a trader has taken an entry, and the stock has gone considerably up, they may want to book profits. This leads many traders to sell their existing longs. These actions can pull prices back toward equilibrium.
Institutional Rebalancing
Many large institutions frequently rebalance portfolios. This is usually done when assets become excessively expensive or cheap relative to historical norms. As a result, institutional flows can encourage reversion.
Behavioral Biases
Market price movements are based more on psychology than anything else. Traders move in herds. Emotions like fear and greed can drive mean reversion. Fear can drive prices too low. On the other hand, FOMO and greed can push prices too high. Once emotions settle, prices may normalise.
Liquidity Effects
Sometimes supply and demand can become imbalanced, leading to exaggerated moves that eventually correct themselves.
When Mean Reversion Works Best
Mean reversion does not work equally well in all environments. It tends to perform best when markets are:
Range-Bound: Markets are sideways 90% of the time. Sideways markets often experience repeated moves away from and back toward an average level.
Highly Liquid: The best markets to trade are liquid markets where the buyers and sellers are in good numbers. Liquid markets tend to recover from temporary dislocations more efficiently.
Stable Volatility Regimes: Volatility can be very sticky and can lead to irrational behaviour by the traders. Moderate, predictable volatility often supports mean-reversion behaviour.
Indicators Used to Spot Mean Reversion Setups
Now the question is how the trader will know the right time to go for a mean reversion trade. Here are some indicators that can help the trader:
Moving Averages
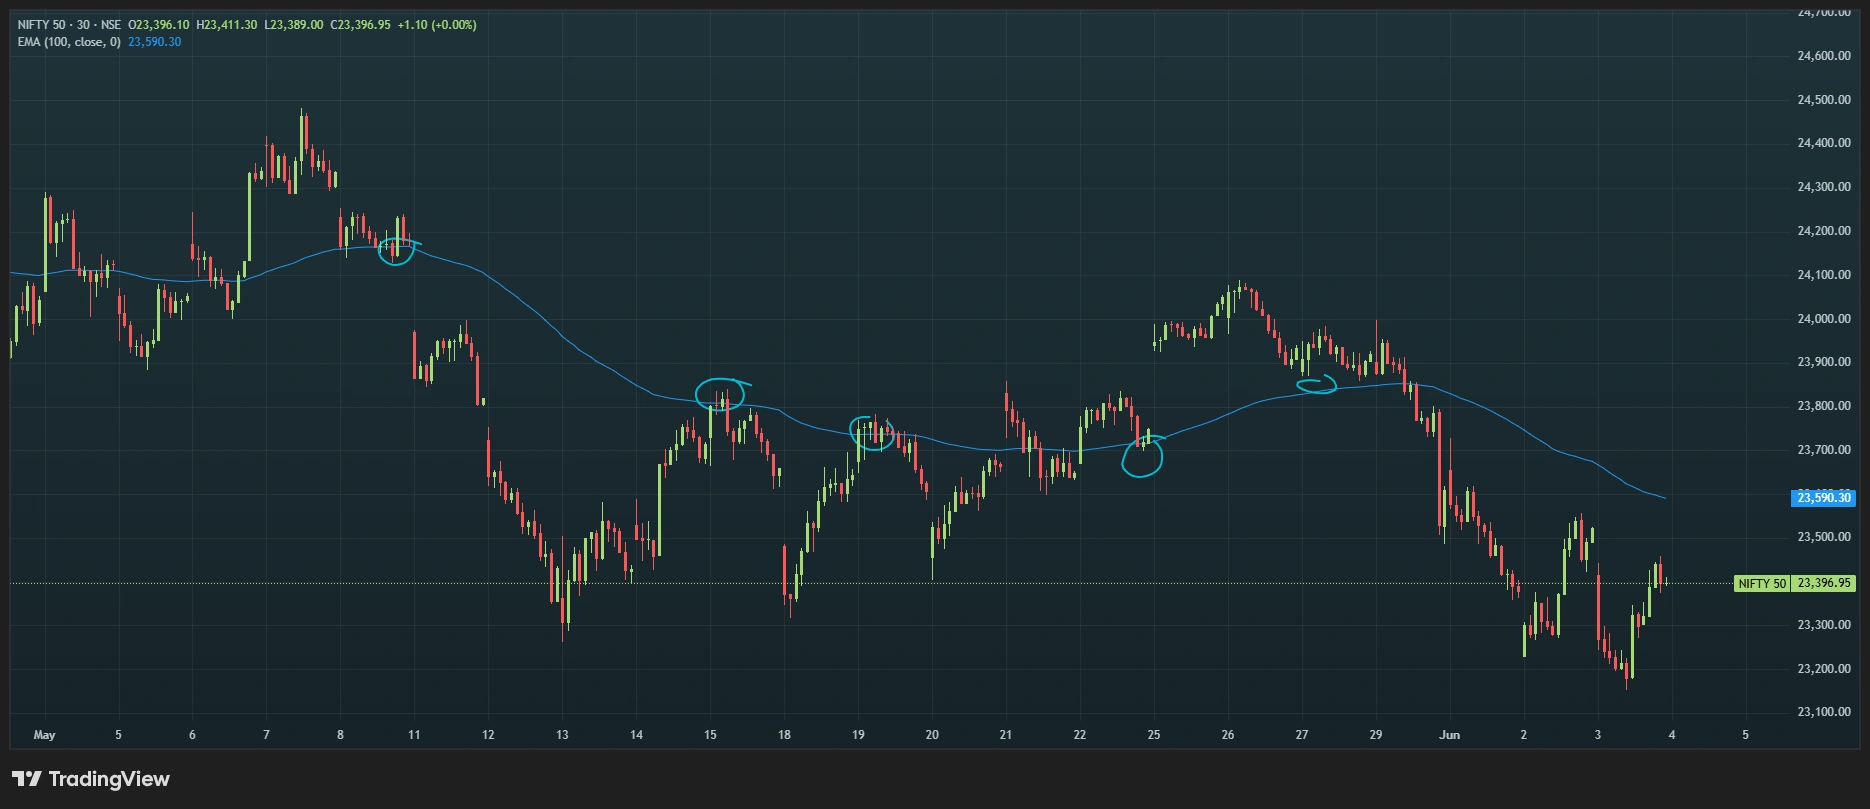
Moving averages are among the simplest mean reversion tools. They act like a magnet when the markets are too overstretched.
Common choices include:
- 20-day MA
- 50-day MA
- 100-day MA
- 200-day MA
Here is an example of Nifty on a 30-minute time frame:
Bollinger Bands
Bollinger Bands consist of:
- Middle moving average
- Upper band
- Lower band
Often, price tends to retrace when it touches the upper or lower band. Once the price reverses, it tends to come back and touch the moving average. Here is an example of Nifty on the daily timeframe.
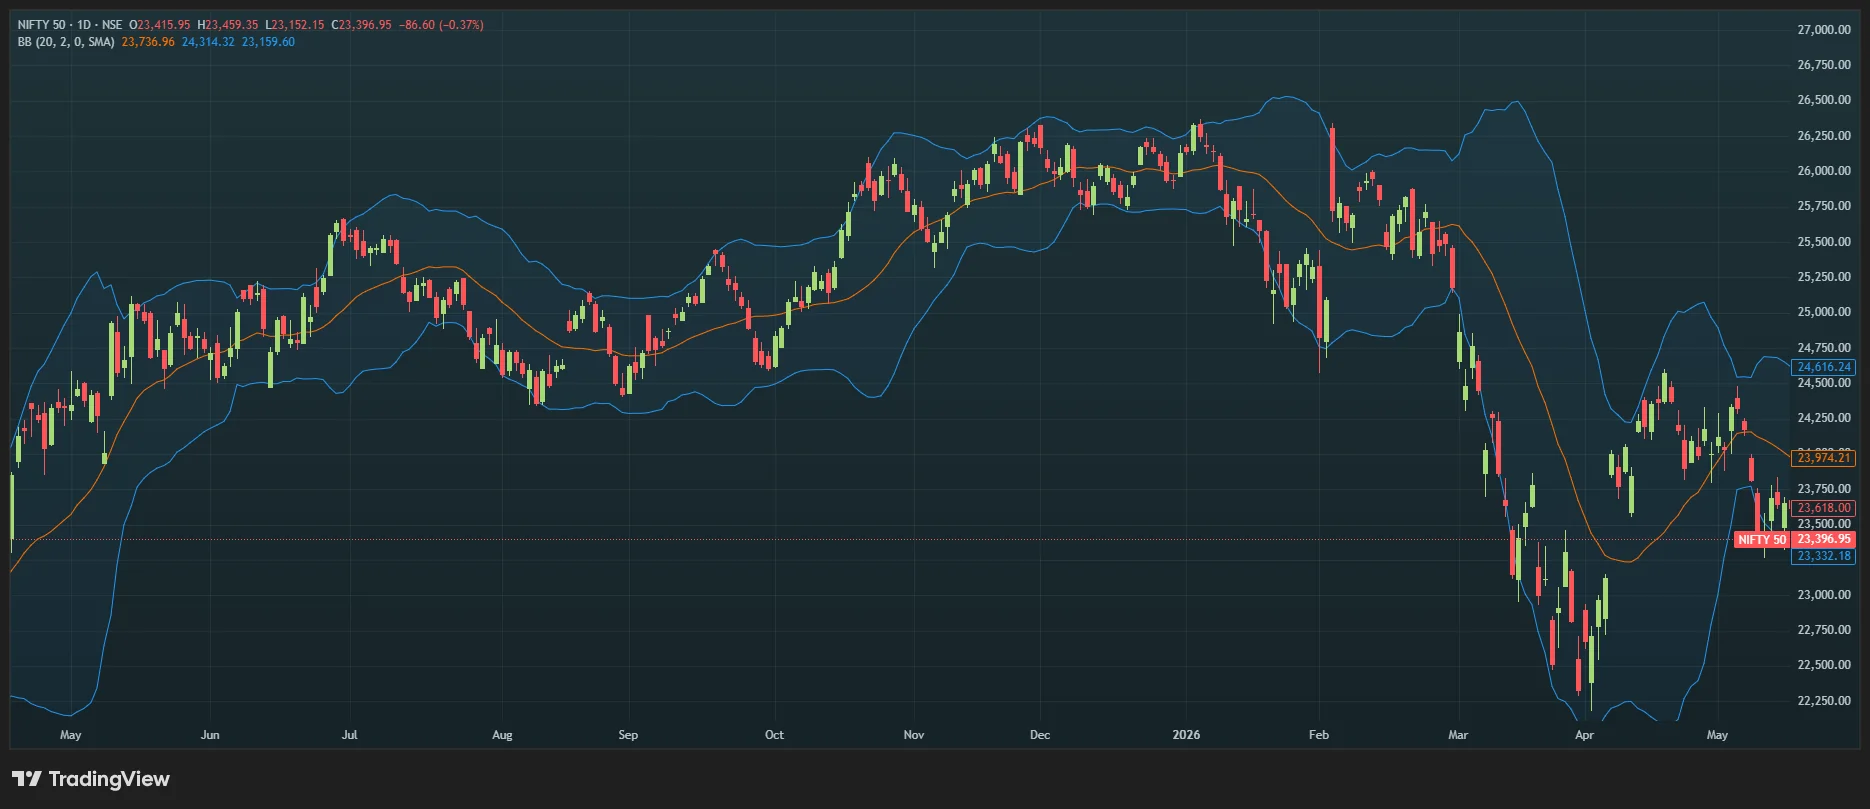
Clearly, the market is touching the Bollinger band many times and reversing to the mean.
VWAP
Volume Weighted Average Price is particularly useful for intraday mean reversion. This is because many institutions monitor VWAP. They try to enter when price is near the VWAP level. Hence, VWAP may attract:
- Institutional rebalancing
- Short-term mean reversion traders
Intraday traders frequently use VWAP as a reversion target. Here is an example of Nifty on the 5-minute timeframe:
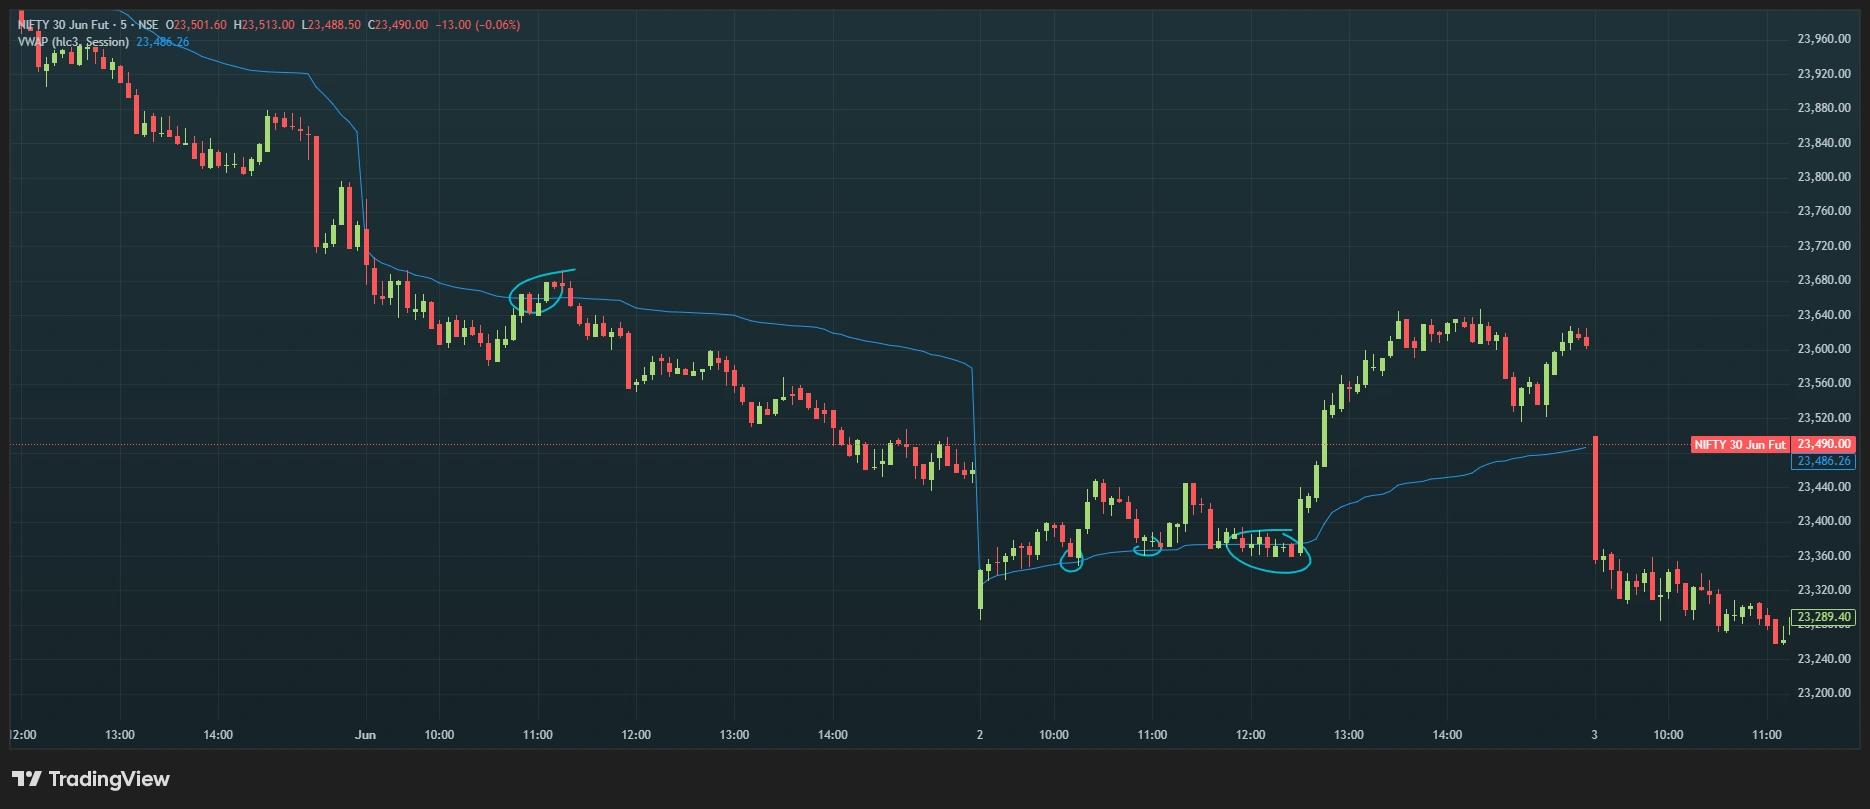
Again, it is clear that VWAP acts like a strong magnet, even in a free-fall market.
A Real Mean Reversion Trade Example
Let us take an example. A stock price is currently Rs 100. Its 20 SMA is Rs 90, so it is around 11% above the mean. The trader backtests the stock and realises that when the stock goes above 10% from its mean, it tends to revert back. The pullback is usually by 5%. So here is the trading opportunity:
The Trade:
- Entry: Short at ₹100
- Target: ₹95 (5% reversion toward the mean)
- Stop Loss: ₹103 (3% above entry)
Risk to Reward:
- Risk = ₹3 (from ₹100 to ₹103)
- Reward = ₹5 (from ₹100 to ₹95)
- R:R ratio = 1:1.67
Building a Mean Reversion Strategy: Step by Step
Step 1: Define the Mean
The trader must define how they will find the mean. There are many options, such as SMA, EMA and VWAP
Step 2: Measure the Deviation
The next step is to define how to get the “extreme”. Again, this can be done by an indicator such as Bollinger Bands or using a Z-score
Step 3: Create an Entry Threshold
Now we have to define the entry rule. This can be a detailed rule such as “only enter a short when price is more than 10% above the 20-day SMA”.
Step 4: Create an Exit Rule
Entry is the easier part. The exit is more important, and the trader must define this. Common exit rules are:
- Price returns to the mean: exit when price touches the moving average
- Fixed target: exit at a predetermined percentage reversion such as 5%
- Time-based exit: exit after a fixed number of days if the trade has not worked
Step 5: Risk Management
Even though the strategy has high win rate, a trader must always define the stop loss before entering. A common approach is to place the stop at a level where the deviation has extended so far that reversion is unlikely in the near term. Also, as a good practice, one trade should not risk more than 2% of capital.
Mean Reversion vs Momentum Trading
Some traders like to trade momentum. While both momentum and mean reversion are opposing strategies, the best traders create 2 sets of strategies – one for mean reversion and the other of momentum trading. Here are the features of both
|
Feature |
Mean Reversion |
Momentum Trading |
|
Core Idea |
The prices tend to return to the mean once overstretched |
The prices tend to keep continuing and trending in the same direction |
|
Entry Logic |
In mean reversion, the idea is to buy at the lows and sell at the highs |
In momentum trading, traders can buy at high prices and then sell when the market goes up further |
|
Holding Period |
Mean reversion usually requires traders to trade in the short term |
Momentum trading works best in the medium and long term |
|
Win Rate |
The win rate can be more than 50% |
Trend following has a low win rate of less than 50% |
|
Average Reward |
Smaller R:R |
High R:R |
|
Works Best In |
Range-bound markets |
Trending markets |
Neither approach is universally superior. Market conditions often determine which performs better.
Conclusion
Mean reversion is one of the most widely used concepts in trading and investing. Many indicators can be used to build mean-reversion strategies. The best traders combine the following to be profitable in mean reversion:
- Statistical validation
- Risk management
- Regime identification
- Backtesting
The key lesson is that markets do not always revert when you expect them to.