What is Volatility Trading & How Does it Work?


Volatility is the statistical measure of how much an asset's returns fluctuate around their average. It is calculated as the standard deviation of returns and is usually quoted as an annualised percentage. An annualised volatility of 15% on Nifty means that the index is expected to stay within a band of 15% above or below its current level over the next year. Volatility trading is the practice of taking a position on that number itself rather than on the direction of price.
Key Takeaways
- Volatility trading is based on predicting volatility rather than market direction.
- There are two types of volatility: historical volatility (backwards-looking) and implied volatility (forward-looking, derived from option prices).
- Common volatility strategies include long volatility, short volatility, volatility breakouts, and mean reversion in volatility. Most strategies are executed using options.
- Traders track volatility using indicators like India VIX, ATR and Bollinger Bands.
What is Volatility Trading?
Most traders spend their careers trying to answer one question: which way will the market go? There is a second question that is often easier to answer: how far will it move? Volatility trading is built on that second question.
The trader takes a view on the magnitude of the move and on the level of implied or historical volatility, and leaves the direction to everybody else.
How Volatility Trading Works
Volatility trading aims to predict whether volatility will increase or decrease in the future. If traders expect volatility to rise, they may buy options or use long volatility strategies. If they expect volatility to fall, they may sell options or use short-volatility strategies.
Since option premiums are heavily influenced by implied volatility, traders monitor changes in volatility as closely as they monitor price movements.
Types of Volatility
Volatility is of two main types:
- Historical Volatility (HV): This measures how much an asset's price has fluctuated in the past. You can calculate it using the asset’s stock price.
- Implied Volatility (IV): This is more complex. IV reflects the market's expectation of future price volatility and is derived from option prices.
In a way, historical volatility is backwards-looking and implied volatility is forward-looking. Implied volatility also plays a crucial role in options pricing.
It is important to understand Vega at this point.
Vega: The Link Between Volatility and Option Prices
Vega is the option Greek that measures how much an option's premium changes for a one percentage point change in implied volatility.
If a Nifty option carries a Vega of 8, its premium rises by roughly Rs 8 when IV moves up by one point and falls by roughly Rs 8 when IV drops by one point.
How Traders Measure Volatility
Volatility can be calculated using different methods such as:
- Standard Deviation: Historical volatility is simply the standard deviation of past returns. The daily standard deviation is annualised by multiplying it by the square root of 252, the number of trading days in a year. This answers how much the asset has actually moved.
- Implied Volatility: IV is calculated using the live option prices. One model used to calculate IV is the Black-Scholes model.
- Expected Move: Once IV is known, the expected one-standard-deviation move works out to Spot x IV x square root of (days to expiry / 365). For Nifty at 25,000 with an IV of 12% and 30 days to expiry, that is roughly 860 points. This is the most practical number in volatility trading because it tells the trader which strikes are realistically in play.
IV Rank and IV Percentile
A raw IV number means very little on its own. An IV of 18% is low for a small-cap stock and high for Nifty. So traders compare current IV against the instrument's own volatility history using two metrics:
- IV Rank (IVR): IVR = (Current IV minus the lowest IV of the last year) divided by (highest IV minus lowest IV of the last year), multiplied by 100. If Nifty IV has moved between 10% and 30% over the past year and today it is 15%, the IVR is 25. That means IV is sitting in the lower quarter of its own one-year range.
- IV Percentile (IVP): IVP is the percentage of trading days in the past year when IV closed below today's level. An IVP of 80 means IV was lower than this on 80% of the days over the past year.
- How they are used: A high IVR or IVP favours selling premium, because volatility is expensive and tends to revert downwards. A low IVR or IVP favours buying premium. IVP is generally more reliable, since one sharp volatility spike can distort the one-year high and skew IVR for months afterwards.
Volatility Trading with Options
Most of the volatility strategies are executed using options. Here is a summary:
|
Strategy |
Best Used When |
|
Long Straddle |
Expect a large move and rising volatility |
|
Long Strangle |
Expect large move with lower premium cost |
|
Short Straddle |
Expect falling volatility (advanced traders) |
|
Iron Condor |
Expect low volatility and range-bound markets |
|
Calendar Spread |
Expect changes in implied volatility over time |
Volatility Indicators and Tools
Traders use a wide range of indicators to better understand market volatility. Here are a few of those indicators:
|
Indicator |
Purpose |
|
India VIX |
Measures expected market volatility |
|
ATR |
Measures price volatility |
|
Bollinger Bands |
Identifies volatility expansion and contraction |
One clarification on India VIX is important. India VIX is an index, not a tradable instrument. A trader cannot buy or sell India VIX directly. India VIX is therefore used as the signal.
Usually, traders buy options when volatility is expected to rise, and prefer selling options when it is expected to fall.
Benefit of Volatility Trading
One major benefit of volatility trading is that it lets traders profit from changes in volatility rather than relying solely on price direction. Many traders find it hard to predict the market direction.
However, traders can execute volatility trades based on earnings announcements, economic events, and periods of market uncertainty.
Risks of Volatility Trading
Volatility trading also carries risks. Implied volatility can change unexpectedly, options can decay rapidly, and assumptions about future volatility can be wrong. All these changes can lead to losses.
Many volatility strategies involve asymmetric risk-reward profiles, making risk management especially important. Here are 2 examples which can lead to big movements and traders should be aware of these:
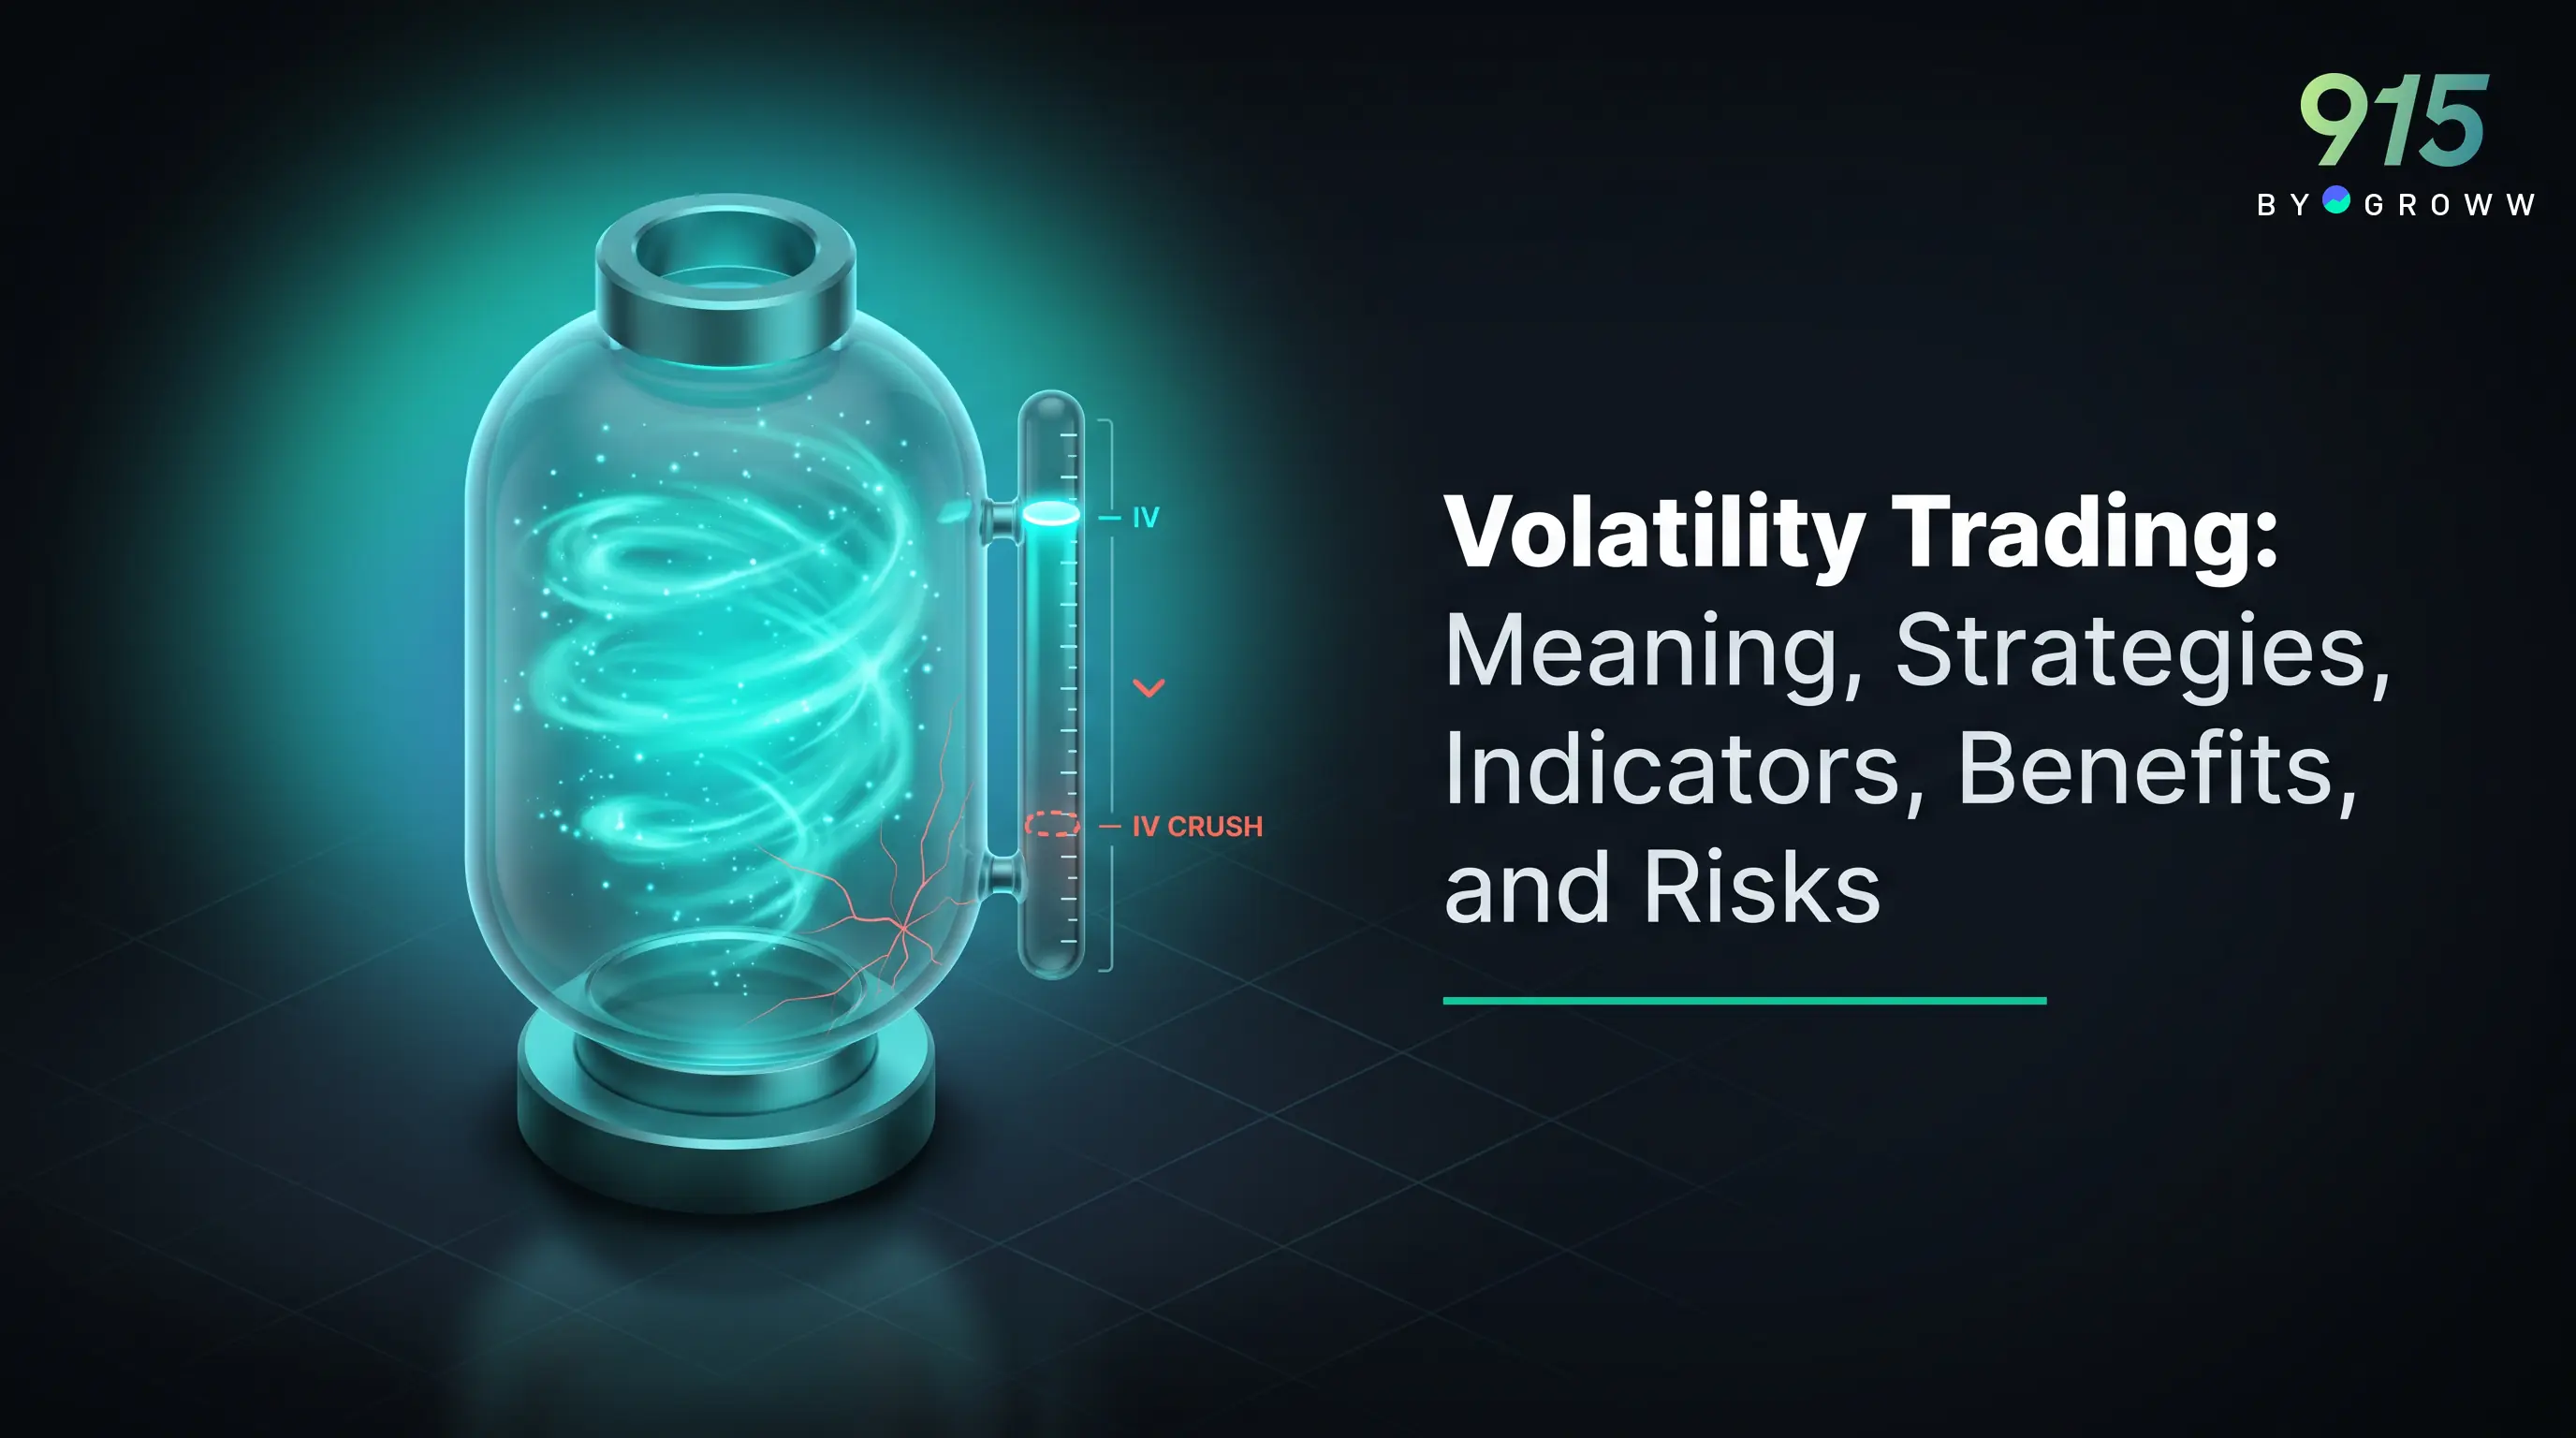
- IV Crush: Ahead of a binary event such as the Union Budget, an RBI policy decision or a company's earnings, implied volatility increases because everybody is positioned for a big move. Once the event is over, that uncertainty disappears, and IV collapses. This is called IV crush.
An option buyer can be right on the direction and still end the day in a loss, because the fall in IV takes more out of the premium than the price move puts in.
- Asymmetric risk and reward: An unhedged short straddle is the clearest example of an asymmetric risk and reward. The trader collects the premium of both legs upfront, and that premium is the maximum profit possible.
On the other hand, the loss can be unlimited. A large overnight gap can devastate this strategy. Limited reward against theoretically unlimited risk is exactly why these positions demand hedges, strict stop-losses and conservative position sizing.
Volatility Trading Example
Suppose Nifty 50 is trading at 25,000, and a Union Budget announcement is scheduled in three days. Traders expect a large move; however, the direction is unclear. In this case, the trader can initiate a Long Straddle by purchasing an ATM Call Option and an ATM Put Option.
Assume the 25,000 CE costs 180 and the 25,000 PE costs 160, so the combined premium paid is 340 points. If the Budget pushes Nifty sharply higher, the Call gains while the Put moves out of the money and its entire premium of 160 decays towards zero. So the losing leg isn't a small loss; it is usually a total loss of that leg's premium.
For the trade to be profitable overall, the winning leg has to appreciate by more than the combined 340 points paid for both legs. In this example, Nifty has to close above 25,340 or below 24,660 before the straddle starts making money.
And if the market stays range-bound, the position takes a double hit: both legs bleed time value, and implied volatility collapses once the Budget is out of the way. That is the IV crush described earlier, and it can leave the straddle in a loss even if Nifty moves a couple of hundred points.
Conclusion
Volatility trading is a different type of trading in which the aim is to predict market volatility rather than market direction. By understanding historical volatility, implied volatility, and option pricing, traders can profit from a wide range of market conditions.
Disclaimer: This article is solely for educational purposes. The securities/investments quoted here are not recommendatory.