How to Use Golden Crossover Strategy
A Golden Cross is a chart pattern that occurs when a reasonably short moving average crosses above a relatively long-term moving average. The Golden Crossover Strategy is considered a bullish breakout pattern.
Understanding What is Golden Crossover
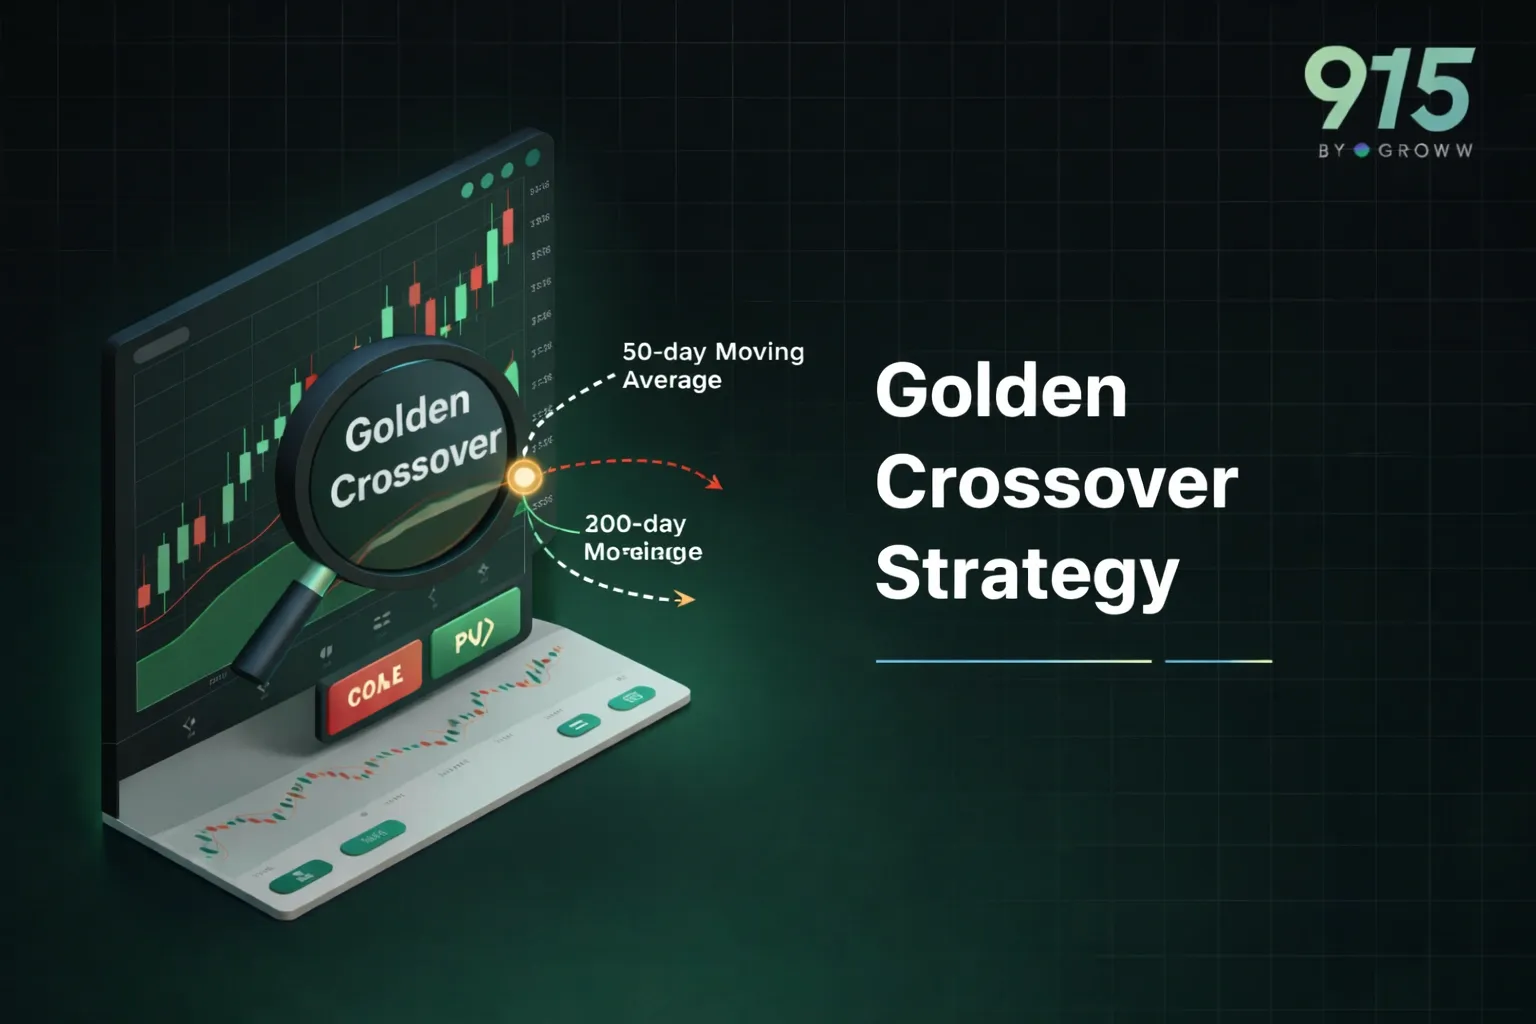
A Golden Cross occurs when a security or index's 50-day Golden Cross moving average crosses above the 200-day moving average. This means that the recent average price is higher than the longer-term average price, which is often interpreted as a bullish signal indicating the progression of an uptrend.
During trading hours, investors who want to invest in these schemes submit a purchase and redemption request for the overnight funds of their choice. Asset Under Management (AUM) is in cash at the start of each business day. The bonds are bought overnight; the next business day is when they become fully paid. The cycle continues as fund managers frequently use the cash to purchase more of these bonds the following day.
As is clear from the blog's title, the focus of this post will be a technical analysis strategy known as the Golden Crossover Strategy. Before that, let's learn about Moving Averages, a fundamental component of fundamental indicators. Read on!
Moving Averages and How to Use Them
Moving Average (MA) is a calculation where multiple averages are created using data subsets of a complete data set to identify and analyze trends. In the stock market, it is used as a technical indicator to plot future stock price trends. The most common moving averages are the 15-, 20-, 30-, 50-, 100-, and 200-day Moving Averages.
The Moving Average is a lagging indicator, i.e., it provides data on past prices. The longer the Moving Average time period, the greater the lag. A 200-day MA (DMA) will lag much more than a 20-DMA since the former is plotted for the past 200 days. The latter will lag much less since it is plotted using the most recent 20-day data.
The Moving Average is a completely customizable indicator. You can opt for a moving average of any period length. The shorter the MA, the more sensitive it is to price changes. Here are a few pointers on using the Moving Average-
- Traders use short-period Moving Averages and longer-period ones as well.
- You have to experiment with multiple periods of the Moving Average before deciding what works best for you.
- A rising Moving Average indicates a security price trending upwards; a downward moving average is the opposite.
Also check : Scalper Mode on 915 | Straddle Chart
Using Moving Average to Spot Trending Direction
- When a stock is on an uptrend, its moving average will act as the support (the floor) price.
- In a downtrend, the moving average will form a resistance (ceiling) level, with the stock price likely to go downward.
How to Identify a Golden Cross on A Chart?
Moving Analysts and Traders interpret the Golden Cross, which happens when a short-term moving average crosses over a significant long-term Moving Average to the upside, as indicating a clear upward turn in the market.
For example, a crossover between the 100-day and 50-day Moving Averages is how some analysts define it, while others refer to the 200-day average crossing the 50-day average. Until they cross, the short-term average tends to increase more quickly than the long-term average.
How to Predict Stock Trends Using Golden Crossover Strategy?
Going long on a stock after bluntly searching for a Golden Cross is not what you should do. A Golden Cross is merely a technical indicator, so there must be evidence to support this claim.
Here are some suggestions for using them to generate ideas rather than profits-
Search for Patterns
A single Golden Cross is ambiguous. Therefore, to find setups for long downtrends, it is preferable to look for a few bullish reversal patterns, such as the three white soldiers’ pattern and the bullish flag pattern.
Utilize Line Segments & Trendlines
You might know the significance of line segments and trendlines if you are already familiar with technical analysis. As such, you can use it in addition to the golden cross.
Find the Double Bottom
The next pattern combines a Golden Cross with a double bottom to show a shift in trend from bearish to bullish.
Stages of A Golden Cross
An ideal Golden Cross goes through three stages:
Stage 1: A downward trend that eventually reverses as supply runs out.
Stage 2: The shorter the moving average passes through, the longer the moving average is in the second stage.
Stage 3: Lastly, the upward trend is still present, which should result in higher prices.
Apart from the Golden Cross Strategy, you may also want to know the Best Intraday Trading Strategies and Rules
Conclusion
In conclusion, you should prioritize developing strong trade management skills and a successful Trading Strategy.
The stock market is unpredictable, and sudden market movement and unexpected changes are always possible. Therefore, manage your trade actively each time to safeguard yourself from unfavourable price reactions.
Disclaimer: This blog is solely for educational purposes. The securities/investments quoted here are not recommendatory.