5-Minute ORB System for Option Scalping

As we all know, the first few minutes are extremely volatile for every stock. Smart money places its bets in the market in the first few minutes; hence, it is always good to take the entry once the initial volatility subsides. During the first few minutes, the institutional orders are executed, and overnight positions are adjusted. Also, in the first few minutes, price discovery occurs, which can create small bursts of volatility that scalpers can exploit. One way to take advantage of this volatility and momentum is to trade the 5-Minute Opening Range Breakout (ORB) system.
This approach focuses on identifying the initial price range and trading the breakout when the price shows commitment. When applied correctly, it helps traders avoid random trades and instead participate in moves supported by early order flow.
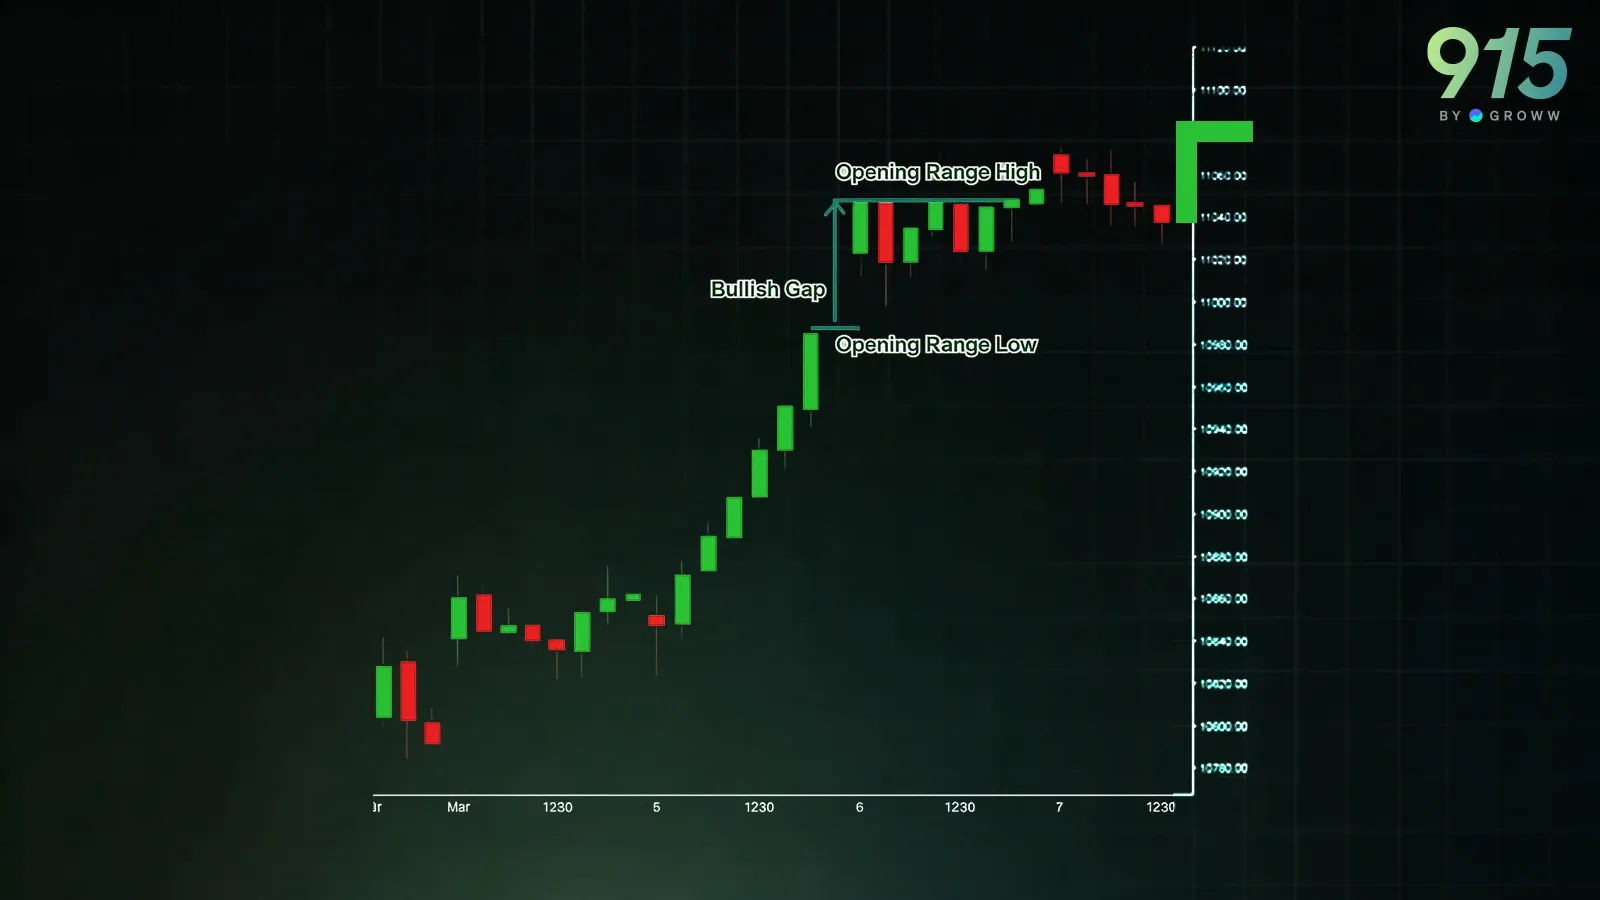
What is the 5-Minute Opening Range?
The 5-minute opening range breakout is a very popular trading strategy. This is usually done on indices such as the Nifty and the Sensex. The traders wait for the initial 5 minutes to pass and for the first 5-minute candle range to form. This range can serve as an important reference zone and a level to initiate trades.
Now the trader is looking to take the entry once this range is broken. If the high of the range is broken, it is bullish momentum, and traders can go for buying opportunities. On the other hand, if the low of the range is broken, the trader can go for shorting opportunities
Once the entry is made, the stop-loss is usually on the opposite side of the range. Hence, if the long entry is taken, the stoploss is the low of the first candle. If the short entry is taken, the stoploss is the high of the first candle.
The target is usually kept at 1:1 or 1:2 risk-to-reward.
How to Use Options to Take Entry
Since this is a Momentum strategy, option buying works pretty well. If the high of the candle is broken and a long trade is to be taken, the trader can buy an ATM call option. On the other hand, if the candles break, then the trader can buy an ATM put option. The stop-loss and target are now set based on the first candle on the options chart. The low of the first candle of the option chart is the stop loss. And the target can be twice the first candle's range. Money management and risk management are, as usual, important in this strategy.
Example on Nifty
After the first 5 minutes, the range was created in Nifty. The high of the first candle was 23173, and the low was 23029. A breakout trade occurred on the second candle itself, to the downside. Hence, a short entry was taken in the second candle. So we will look at the put option chart.
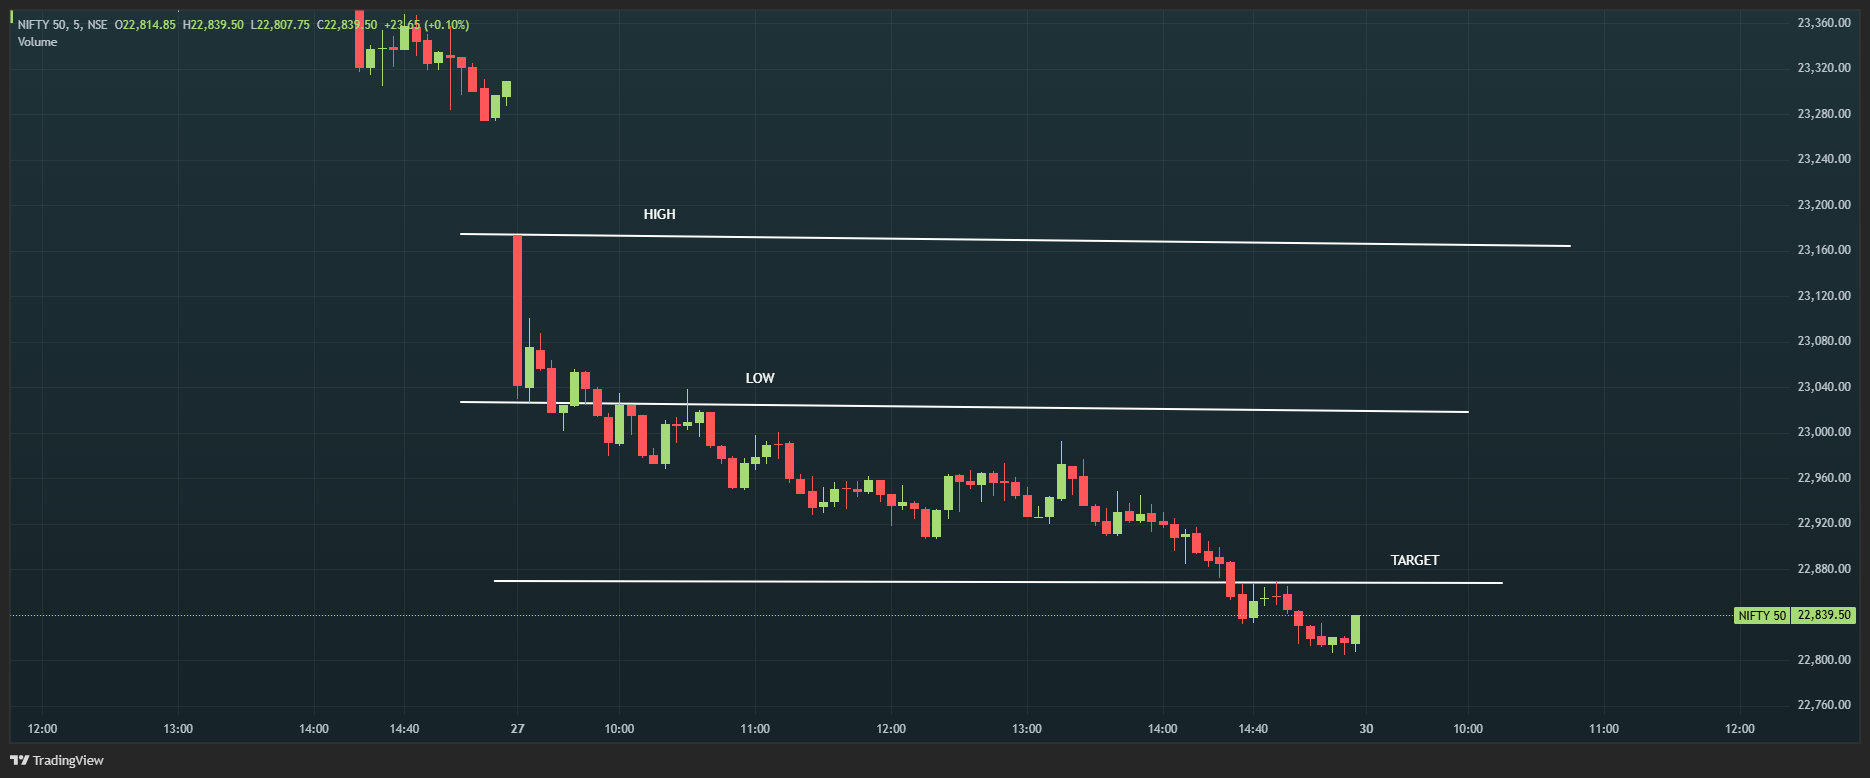
We will use the ATM put option in this example. Hence, a 23050 PE was chosen. Here is the chart -
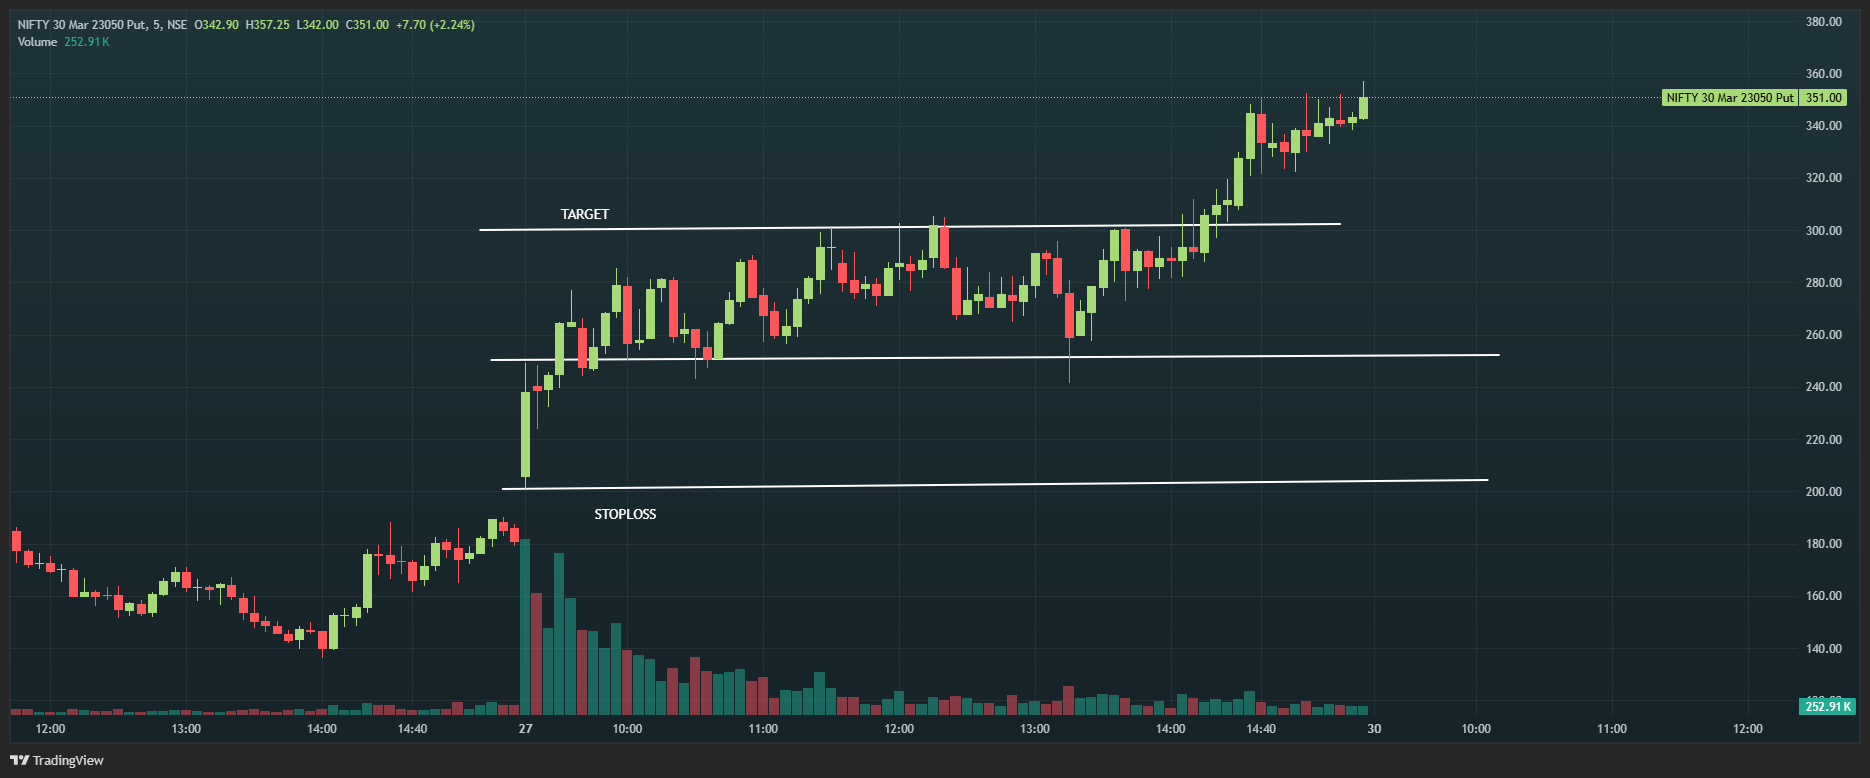
The buy entry in the put option chart triggered on the fourth candle at rupees 250. The stop loss is the low of the first candle which is Rs 200. Since the target is with 1:1 risk to reward, the target becomes Rs 300. The target was achieved at around 12 o'clock
Risk management is also very important. Here are the calculations that can guide traders. Assuming the trader is starting with Rs 10 Lakh capital.
Risk = 250-200 = 50 points
Risk/trade (in Rs) = 50*65 = Rs 3250
In each trade, the trader should take a max risk of 3% of the capital.
Risk allowed = 10 Lakh x 3% = Rs 3000
Hence, the trader should trade with 1 lot in this strategy.
Points to Make the Strategy Better
This opening range breakout strategy is a good strategy, but some points to be kept in mind by the traders:
- There can also be a fake breakout. If the breakout occurs with high volume, it lends more credibility.
- The strike selection is very important. The trader should go for at least an ATM or an ITM option to maximise profits. OTM options should be avoided because the Delta is very low.
- Each trade should have the correct risk defined. The stop-loss should be set in the system. And the trader must follow the risk and money management rules
- The strategy is momentum-based, and the trader should try to capture it. If, after entry, the momentum is dying, the trader can exit the position rather than holding it for too long.
- The best part of the strategy is that there is only one or, at most, two trades per day. This reduces the external costs for the traders.
- The orb strategy can be further refined by taking traits based on the previous day's trend or at key support and resistance levels. Traders can also check the higher time-frame structure and combine it with the ORB to improve decision quality.
Summary
The 5-minute Opening Range Breakout is a very popular trading strategy in which the trader seeks to take advantage of morning momentum. The strategy can be implemented as an options-buying system, since the momentum is with the trader. However, as with any strategy, this strategy might have some loss-making days. So to minimise that, the trader should follow strict risk and money management and trade the correct strike to get the maximum benefit.