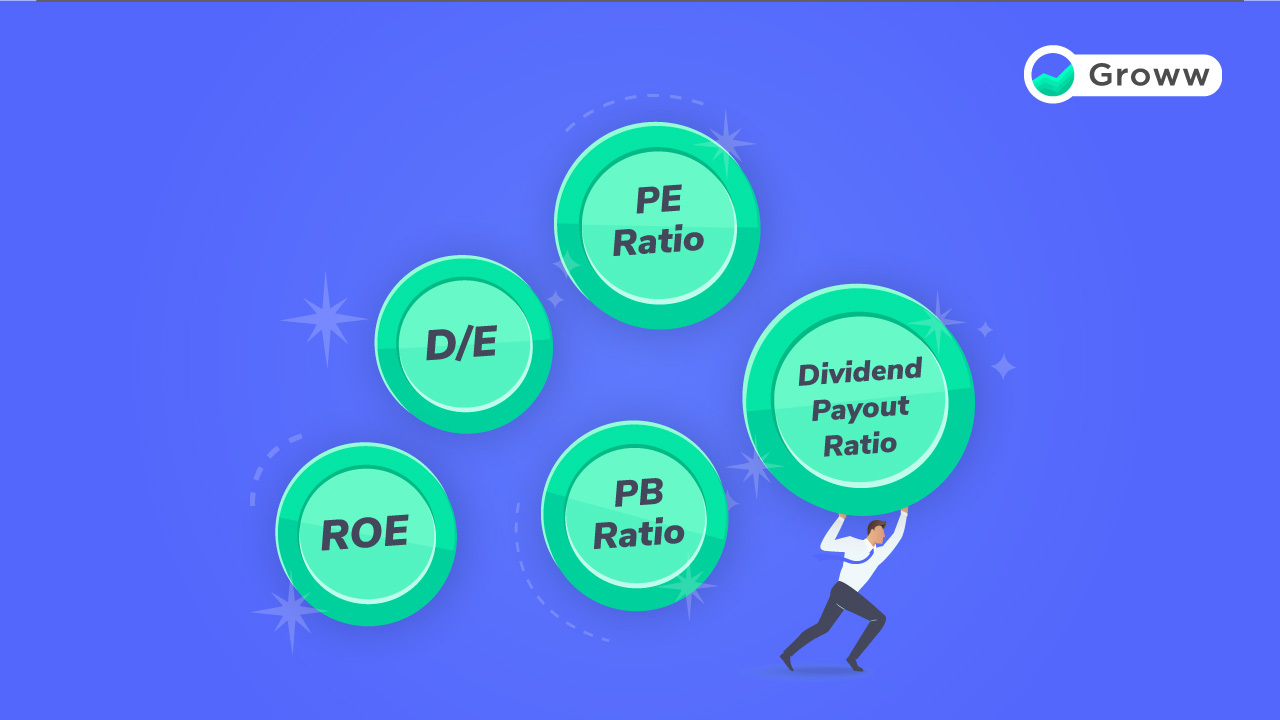
5 Financial Ratios Every Stock Investor Should Know
In stock investing, most experts will tell you about conducting the fundamental analysis of the company before picking stocks. This means that you need to look at the financial records of the company and assess if its stocks are worth investing in right now.
However, not everyone is a finance wiz to know what exactly to look for while assessing a company and its stocks. Hence, there are some fundamental areas that need your attention to ascertain the viability of the investment.
Here’s where financial ratios can come to your aid to analyse a stock and make a decision. Let’s see what these ratios are and what they say about the viability of a stock. Read on!
1. Price to Earnings (P/E) Ratio
As the name suggests, a P/E ratio is the ratio of the current share price to the earning of the company per share. This ratio can tell you if the company is undervalued or overvalued in the market.
Let’s say that a company has an overall earning of Rs.1000. Also, it has 100 shares trading in the market.
Therefore, its ‘earning per share’ is Rs.10.
Further, let’s say that the shares of the company are trading at Rs.100 per share. Hence, we have
P/E Ratio = 100/10 = 10
In the simplest terms, this means that you are paying Rs.10 for getting Rs.1 from the company’s earnings. Hence, it is easy to deduce that if a company has a higher P/E ratio, it is that much overvalued.
What should be the ideal P/E ratio of a stock that you can invest in?
The answer to this question is not straightforward. This is because you cannot compare P/E Ratios as absolute values since every industry has a different benchmark.
For example, in the FMCG industry, the normal P/E Ratio is around 40-50. Let’s look at two FMCG companies:
- Hindustan Unilever Ltd (HUL) has a P/E ratio of >70
- Britannia has a P/E ratio of ~ 50
Hence, HUL is overvalued as compared to Britannia.
Just to give you more clarity, the P/E ratio of JK Paper is 4. If you compare this with the P/E ratios of HUL or Britannia, then you will get an incorrect picture because the industries are different. In the Paper Industry, the normal P/E ratio is around 7-9. Therefore, JK Paper is around normal.
Hence, while analyzing the P/E ratio of a company, it is important to know the industry benchmarks and assess its valuation accordingly.
Companies | Type | Bidding Dates | |
| Regular | - | ||
| Regular | - | ||
| Regular | - | ||
| Regular | - | ||
| Regular | - |


2. Return on Equity (RoE) Ratio
As the name suggests, the RoE Ratio is a measure of the rate of return on the stock of a company. In other words, it tells investors how good the company is at generating returns on stock investments.
Mathematically,
RoE = Net Income/Total Shareholder’s Equity
This is an important ratio because it shows the company’s ability to turn equity investments into profits.
Let’s say that you are the promoter of a company and have contributed Rs.100 in equity and the total equity of the company is Rs.100.
Using this equity if the company generates an income of Rs.20, then the RoE is 20%. Imagine another company with the same total equity but generating an income of Rs.40 – its RoE ratio will be 40%. The company that generates better RoE is considered better.
However, you should not look at RoE as a standalone factor. Here is a quick example:
- Last year, Coal India had an RoE of 70%
- The RoE of HEG was > 100%
Does this mean that these are good companies to invest in?
There are a couple of important things that you need to understand about RoE ratios:
- Like the P/E ratios, the RoE ratios can vary according to sectors and industries. Hence, it is important to understand the industry average too.
- A company can also have a high RoE ratio because it has taken a lot of debt and its equity investment is low. Hence, you must look at the equity structure of the company along with its complete financials to make the decision.
3. Price-to-Book (P/B) Ratio
The price-to-book ratio is a simple comparison of a company’s market value (market capitalization) to its book value. It compares the company’s stock price to its book value per share.
Before we understand the P/B ratio, let’s look at what book value means:
The simplest way to understand book value is to think that if a company stops doing all business, pays off its loans, and sells its assets, what will be the value of the company. Here is an example:
Let’s say that the value of a company is Rs.1000. It decides to shut down the company and receives Rs.1000. Out of this, it has to pay Rs.400 as loan repayment. Also, the company has some assets that fetch it Rs.200. Therefore,
The total book value of the company = 1000 – 400 + 200 = Rs.800
Next, let’s say that the total number of outstanding shares was 100. Therefore, the book value of the company per share = 800/100 = Rs.8
Now,
P/B ratio = Market price of a share/Book value per share
Let’s say that the market price of a share of the company is Rs.80. Therefore,
P/B ratio = 80/8 = 10
If a company has a low P/B ratio, then it is said to be undervalued and a high P/B ratio is overvalued. It is an excellent way to identify companies whose stock prices have sky-rocketed without any asset base.
However, as is the case with the other ratios mentioned above, you should not make a decision about the strength of a company by looking at its P/B ratio alone. In the current markets, with panic selling being the theme, many fundamentally weak stocks will have a low P/B ratio (even less than 1).
You must ensure that you look at the industry average and other financial factors before making an investment. Here is an example to explain this point:
We all know that Yes Bank was in a lot of problems recently. However, its P/B ratio is 1.14 (that’s low). On the other hand, the P/B ratio of D-mart is 22 but it is considered to be fundamentally strong!
4. Dividend Yield or the Dividend-Price ratio
Dividend yield or the dividend-price ratio is the amount of money or dividend that a company pays its shareholders over the course of a year divided by its current stock price. It is an indicator of the returns you can expect on your investment.
Let’s say that you purchased a stock at the market price of Rs.100. A year later, the stock price is still Rs.100. Is this a good investment?
A quick look at the appreciation of share price says that it is not – you got a zero percent return! However, have you considered the dividend before making this decision?
What is dividend?
Let’s say that the company makes a profit of Rs.1000. Out of this, it decides to keep Rs.600 for business expansion and distribute Rs.400 among its shareholders. Assuming that there were 100 shares in the market, each shareholder will receive a dividend of Rs.4.
This becomes the return on investment for the shareholder. Even if the share price did not appreciate, the shareholder earned a return on his investment.
Dividend yield is an important ratio because there are many stocks that do not appreciate in price but offer handsome dividends. If the dividend yield is higher, the investor has a better chance of receiving higher dividends for the same investment as compared to a stock with a low dividend yield.
5. Debt-to-Equity (D/E) Ratio
As the name suggests, this ratio gives you an overview of the debts and equity of the company. It is calculated by dividing the company’s total liabilities (debts) by its total shareholder equity. It can give you an indication of how much is the company running on loans versus owned funds.
There is no ideal D/E ratio as it can vary with industries and sectors.
Usually, if a company has a lot of debt, then it is assumed that the company will find it difficult to pay it back. Also, since debt attracts interest, it will directly impact the company’s profit and loss statement and negatively impact its net income leading to a drop in the cash flow.
The D/E ratio can help you determine if the company has a lot of debt or not. A high D/E ratio means higher debt and vice-versa.
However, it is important to remember that high debt does not necessarily mean a bad thing. If the company factors in the interest and repays its debts on time while utilizing the funds constructively, it can experience growth.
Hence, it is important to treat this ratio as a mere indicator of the amount of debt a company as with respect to its equity.
Summing Up
While a detailed fundamental analysis of a company is a must, these ratios can help you get a bird’s-eye view of the company’s financials. It is also important to remember that these ratios are dynamic in nature.
Hence, it is important to recalculate them once every quarter (after the declaration of the quarterly financial results). Prudence is a necessary skill for investors and learning how to analyze the fundamentals of a company before investing in its stock is the first step to becoming a prudent investor.
Happy Investing!